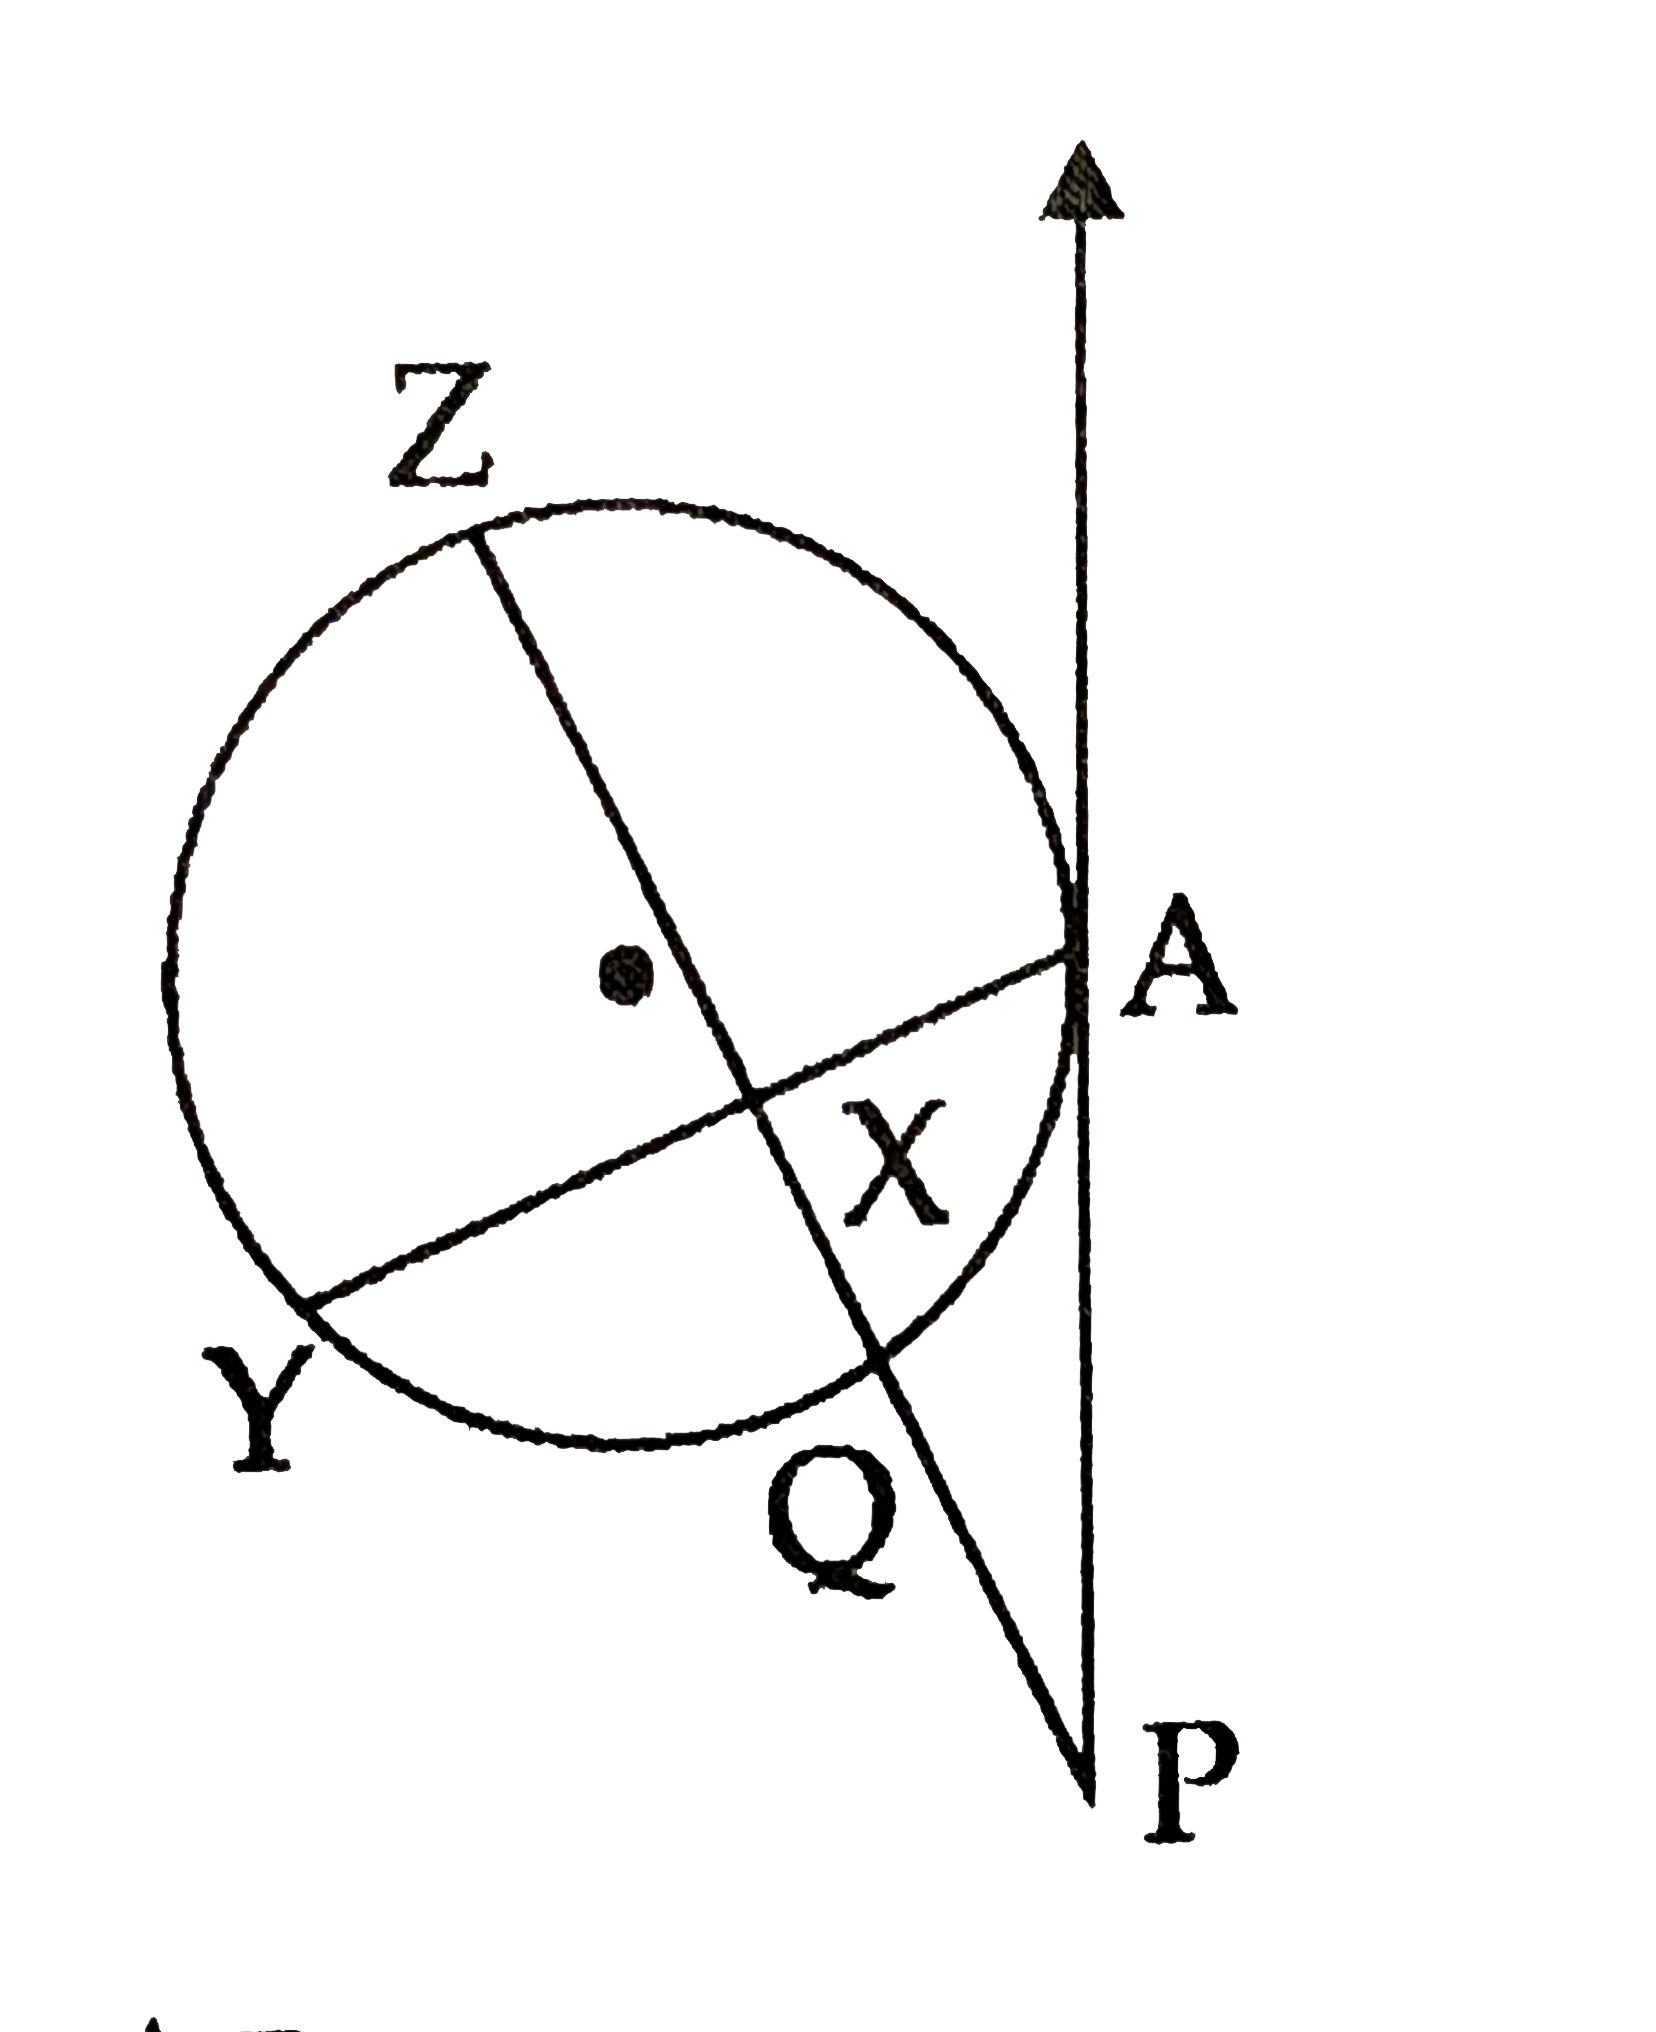
In the adjoining figure line PA is a tangent to the circle at point A . Secant PQZ intersects chord AY in point X, such that AP = PX = XY. If PQ = 1 and QZ = 8 . Find AX.
 Solution in Tamil
Step by step video & image solution for In the adjoining figure line PA is a tangent to the circle at point A . Secant PQZ intersects chord AY in point X, such that AP = PX = XY. If PQ = 1 and QZ = 8 . Find AX. by Maths experts to help you in doubts & scoring excellent marks in Class 10 exams.
Updated on:21/07/2023Topper's Solved these Questions
- CIRCLEBOOK - CHETAN PUBLICATIONCHAPTER - CIRCLEEXERCISE - Assignment - 3 (Solve the following sub questions: (any two)):
3 Videos
- CHALLENGING QUESTIONSBOOK - CHETAN PUBLICATIONCHAPTER - CHALLENGING QUESTIONSEXERCISE - Mensuration
9 Videos
- CO-ORDINATE GEOMETRY BOOK - CHETAN PUBLICATIONCHAPTER - CO-ORDINATE GEOMETRY EXERCISE - ASSIGNMENT-5
11 Videos
Similar Questions
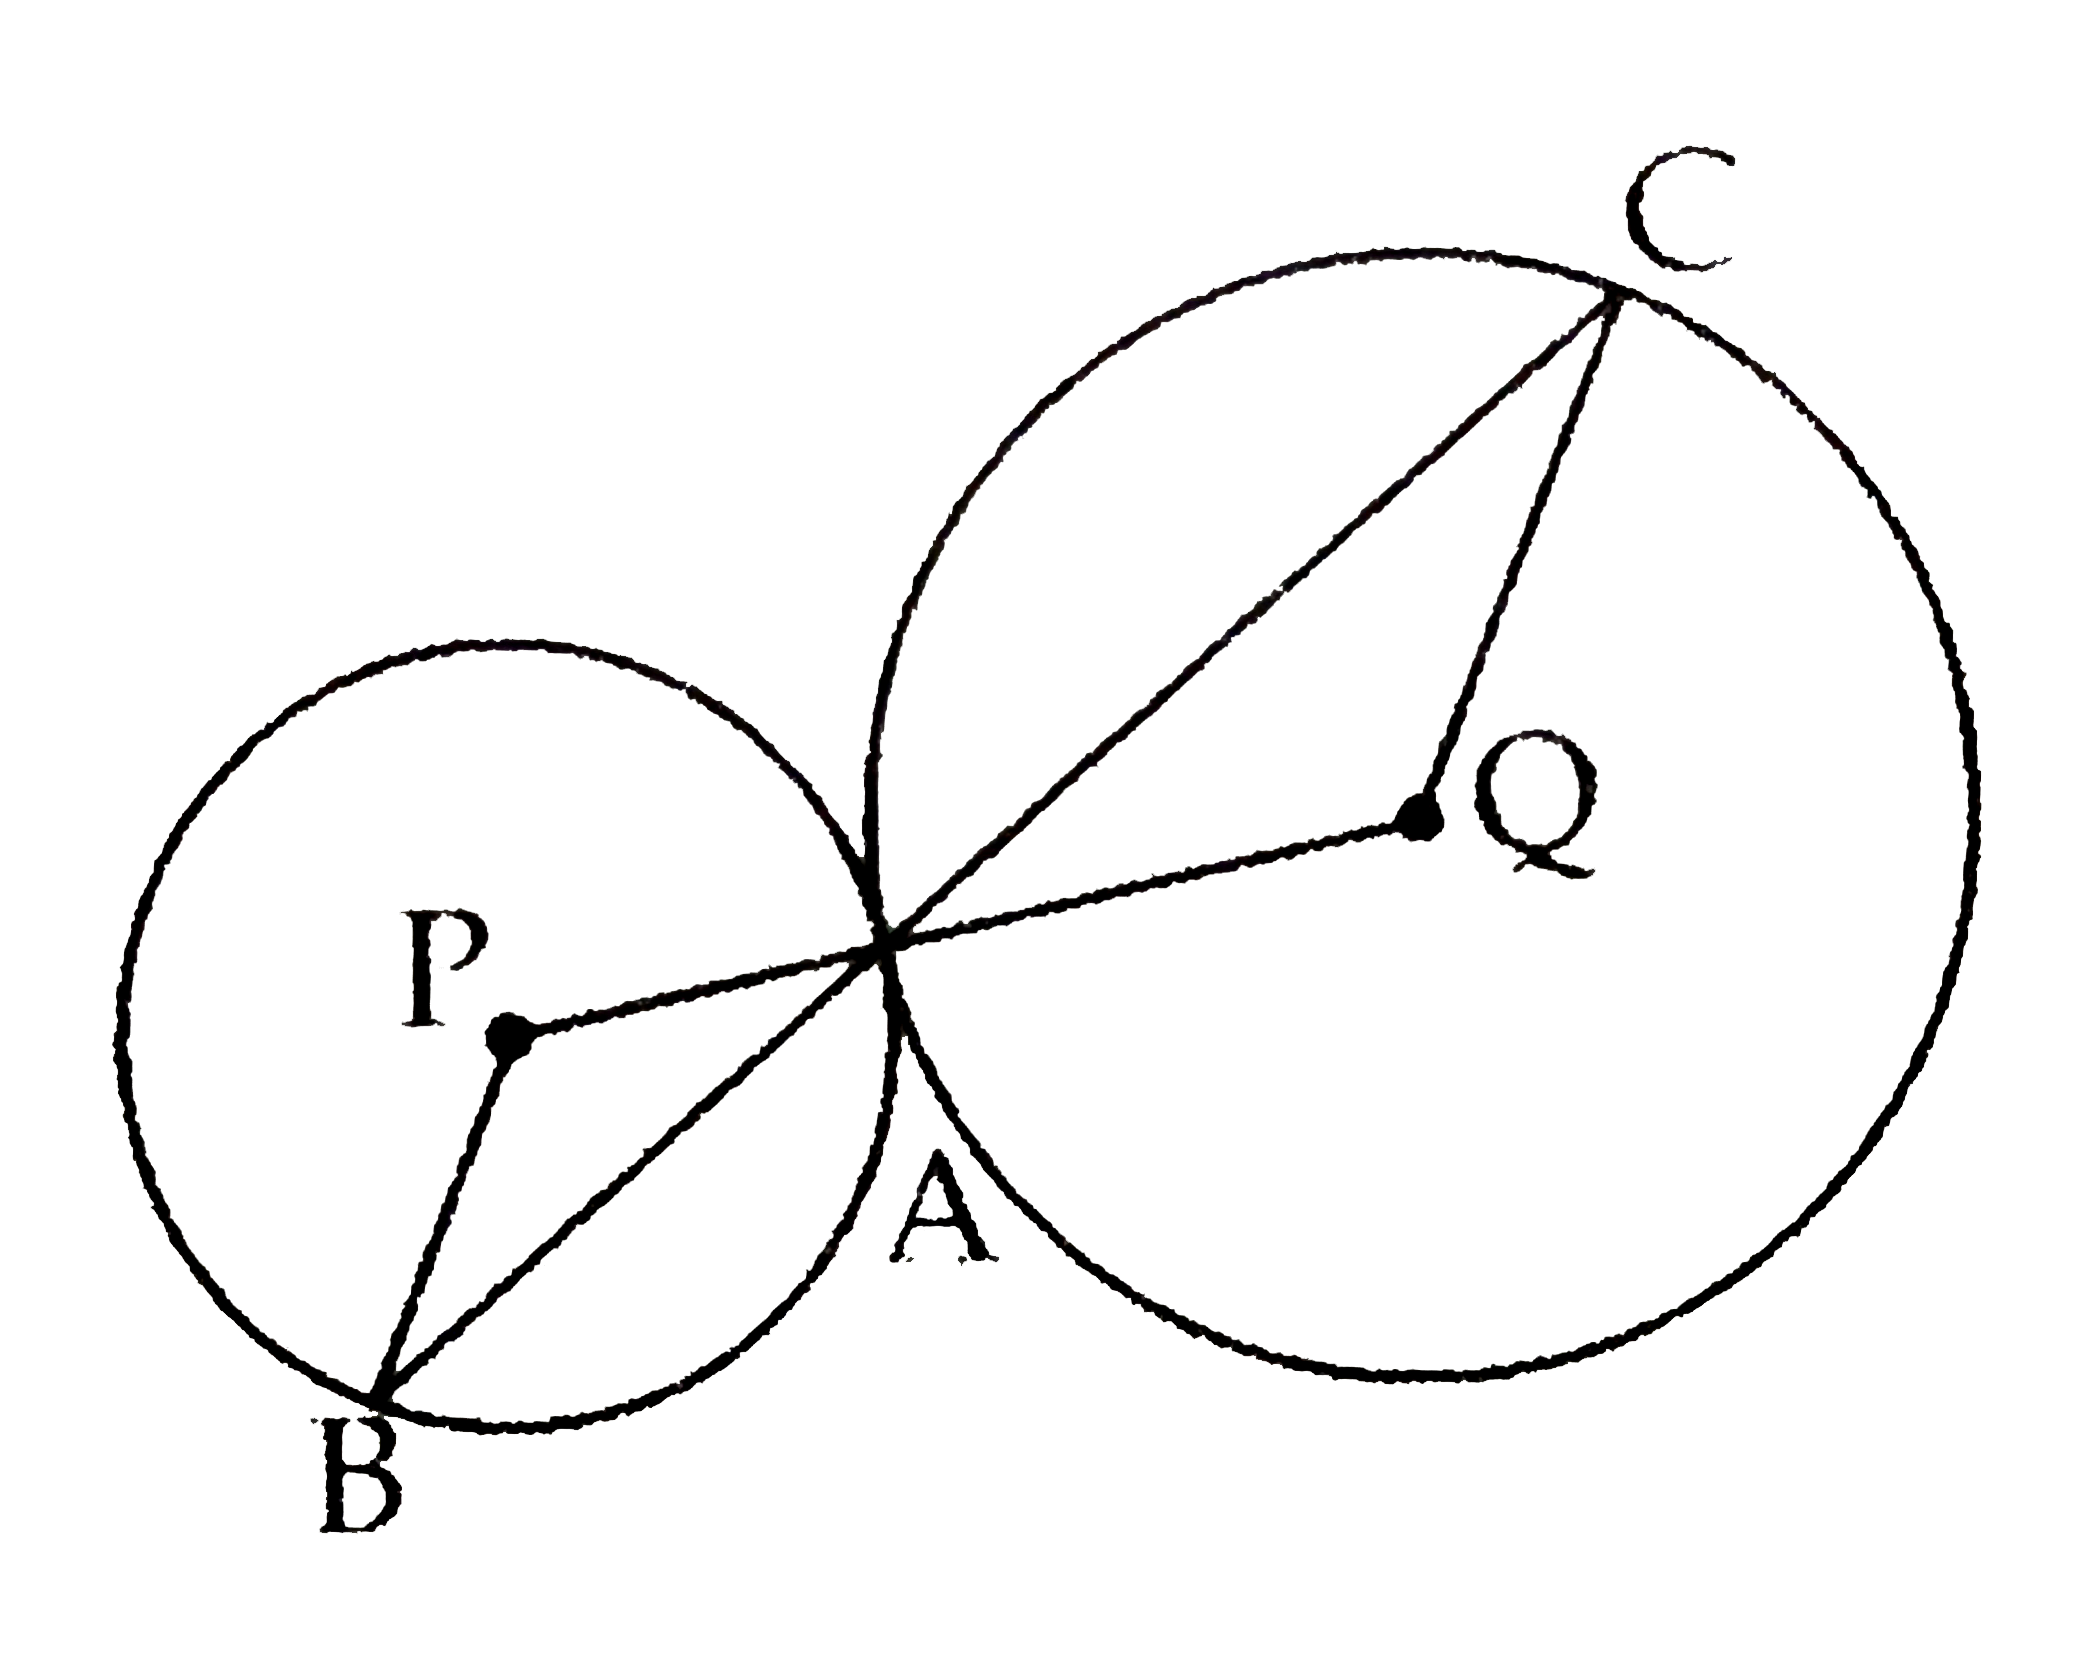
Two circles with centres P and Q touch each other at point A . ∠BPA=60∘ . Find ∠QCA and ∠CQP

View SolutionA tin maker converts a cubical metalic box into 10 cylindrical tins. Side of the cube is 50 cm and radius of the cylindrical is 7cm. Find the height of each cylinder so made if the wastage incurred was 12%. (π=227)
View SolutionSlope of a line is √3. Find its inclination.
View SolutionHow many lines of symmetry does the above figure have ?
View SolutionDetermine the point of symmetry of a regular hexagon.
View SolutionDtermine the images of the following figure about the given line :
View SolutionMatch the following Column A to Column B

View SolutionMatch the following Column A to Column B

View SolutionMatch the following Column A to Column B

View SolutionFind the area of figure given below.

View SolutionFind the perimeter of the figure given below.

View SolutionFind the area of the figure given below.

View SolutionThe inequation represented by the graph given below is :
View SolutionThe inequation that best describes the graph given below is _________
View SolutionThe inequation that best describes the following graph is _________
View SolutionThe equation of straight line shown in figure is :
ltimg src="https://d10lpgp6xz60nq.cloudfront.net/physics_images/ALN_PHY_R04_E01_020_Q01.png" width="80%"gt
View Solution
