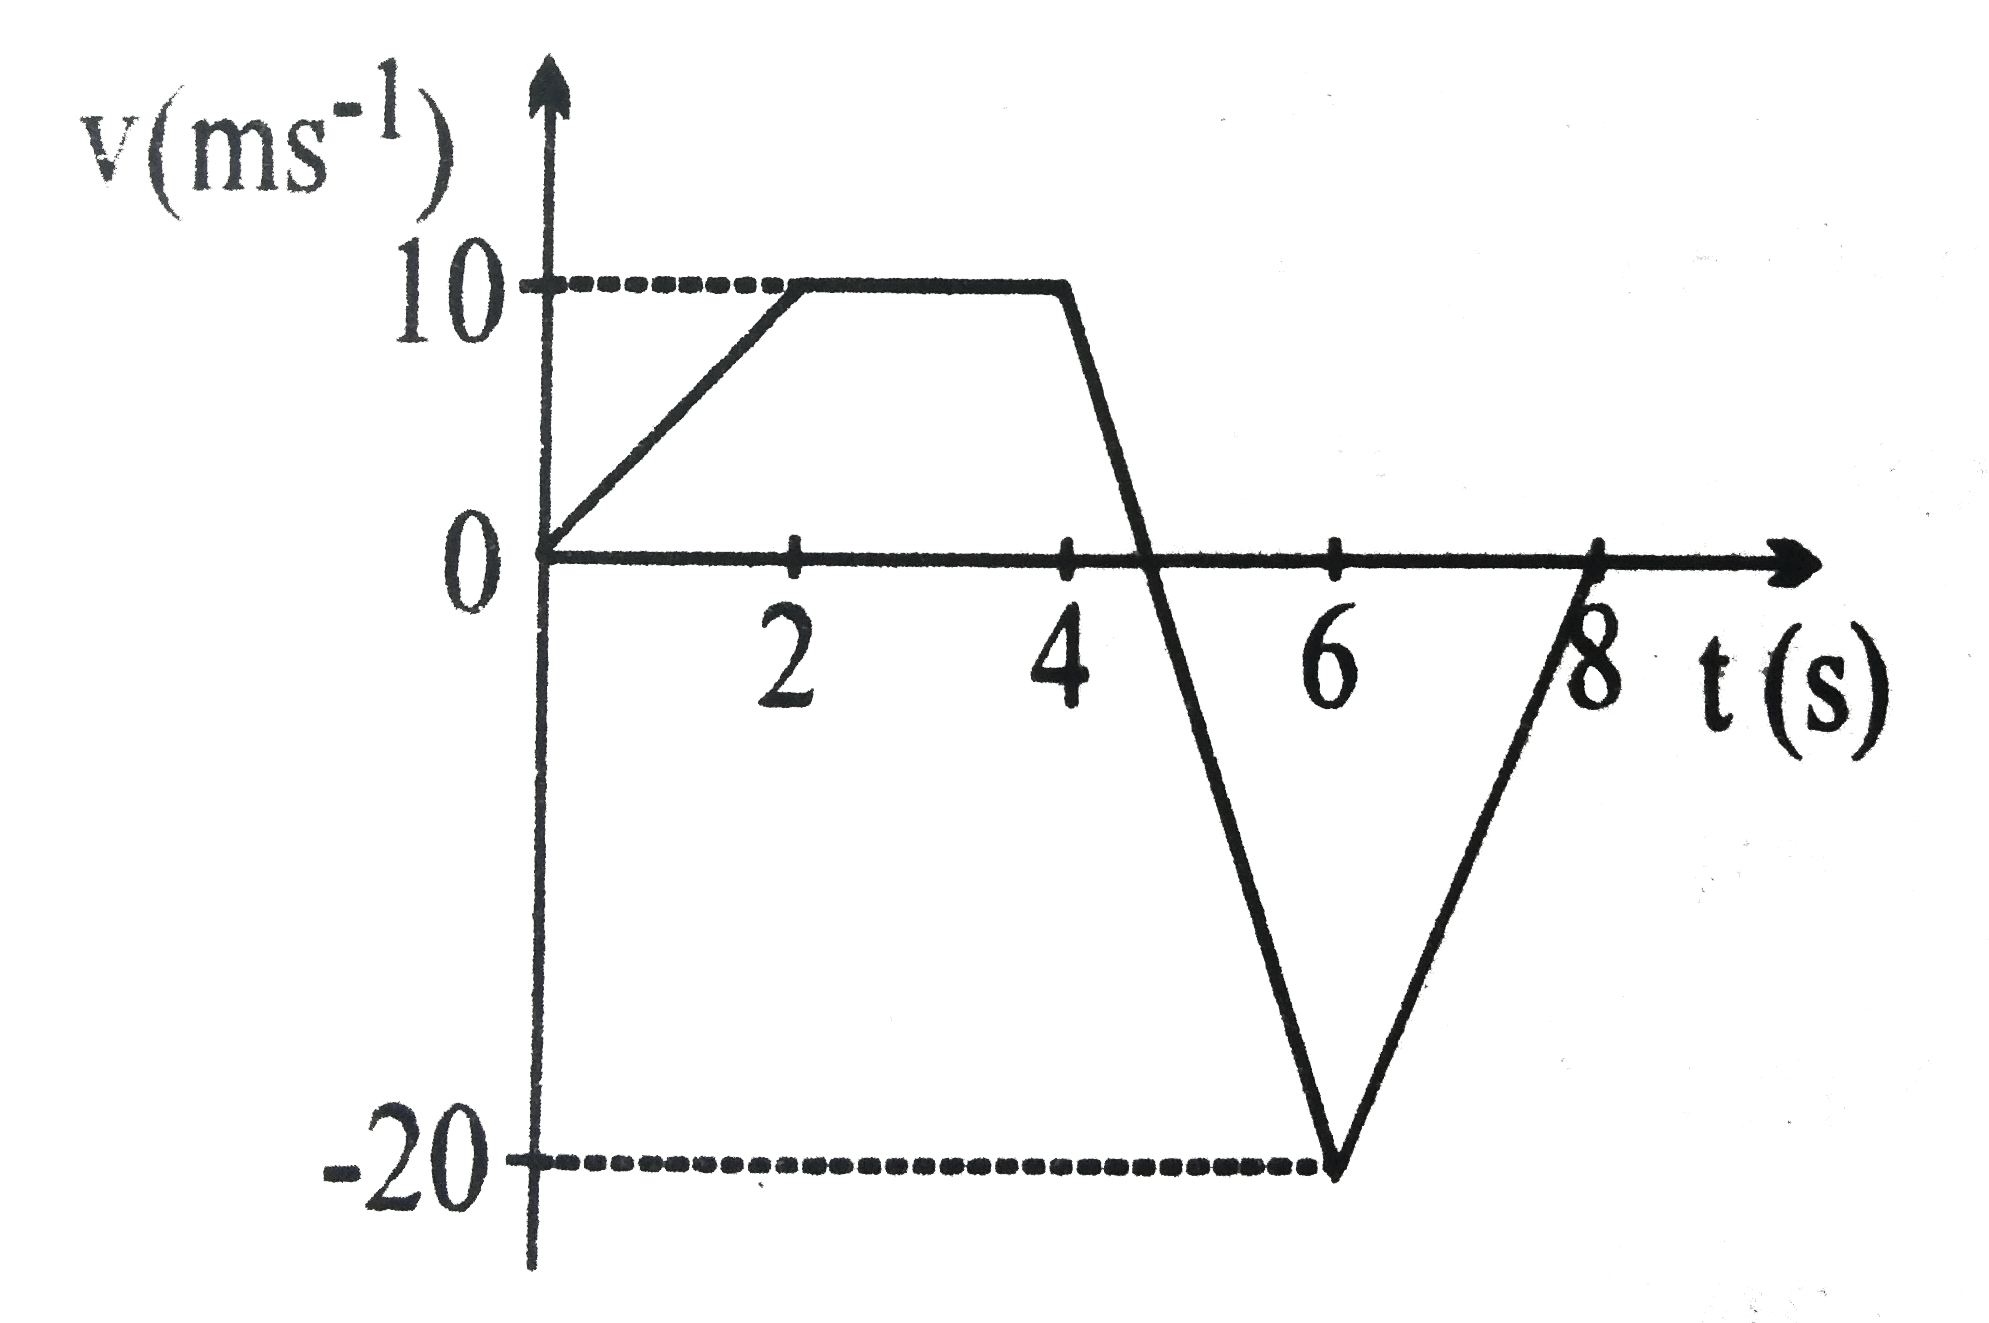
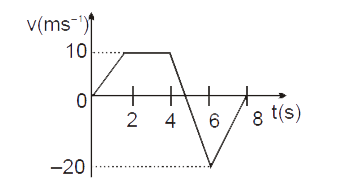
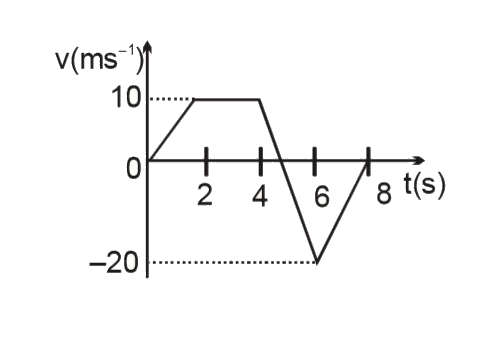
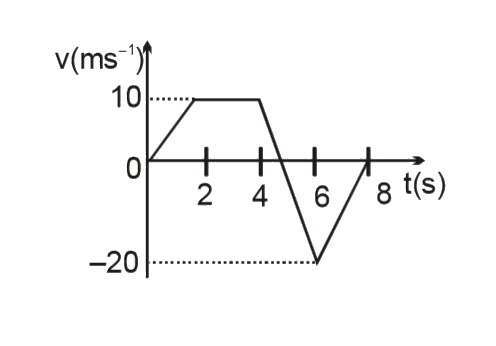
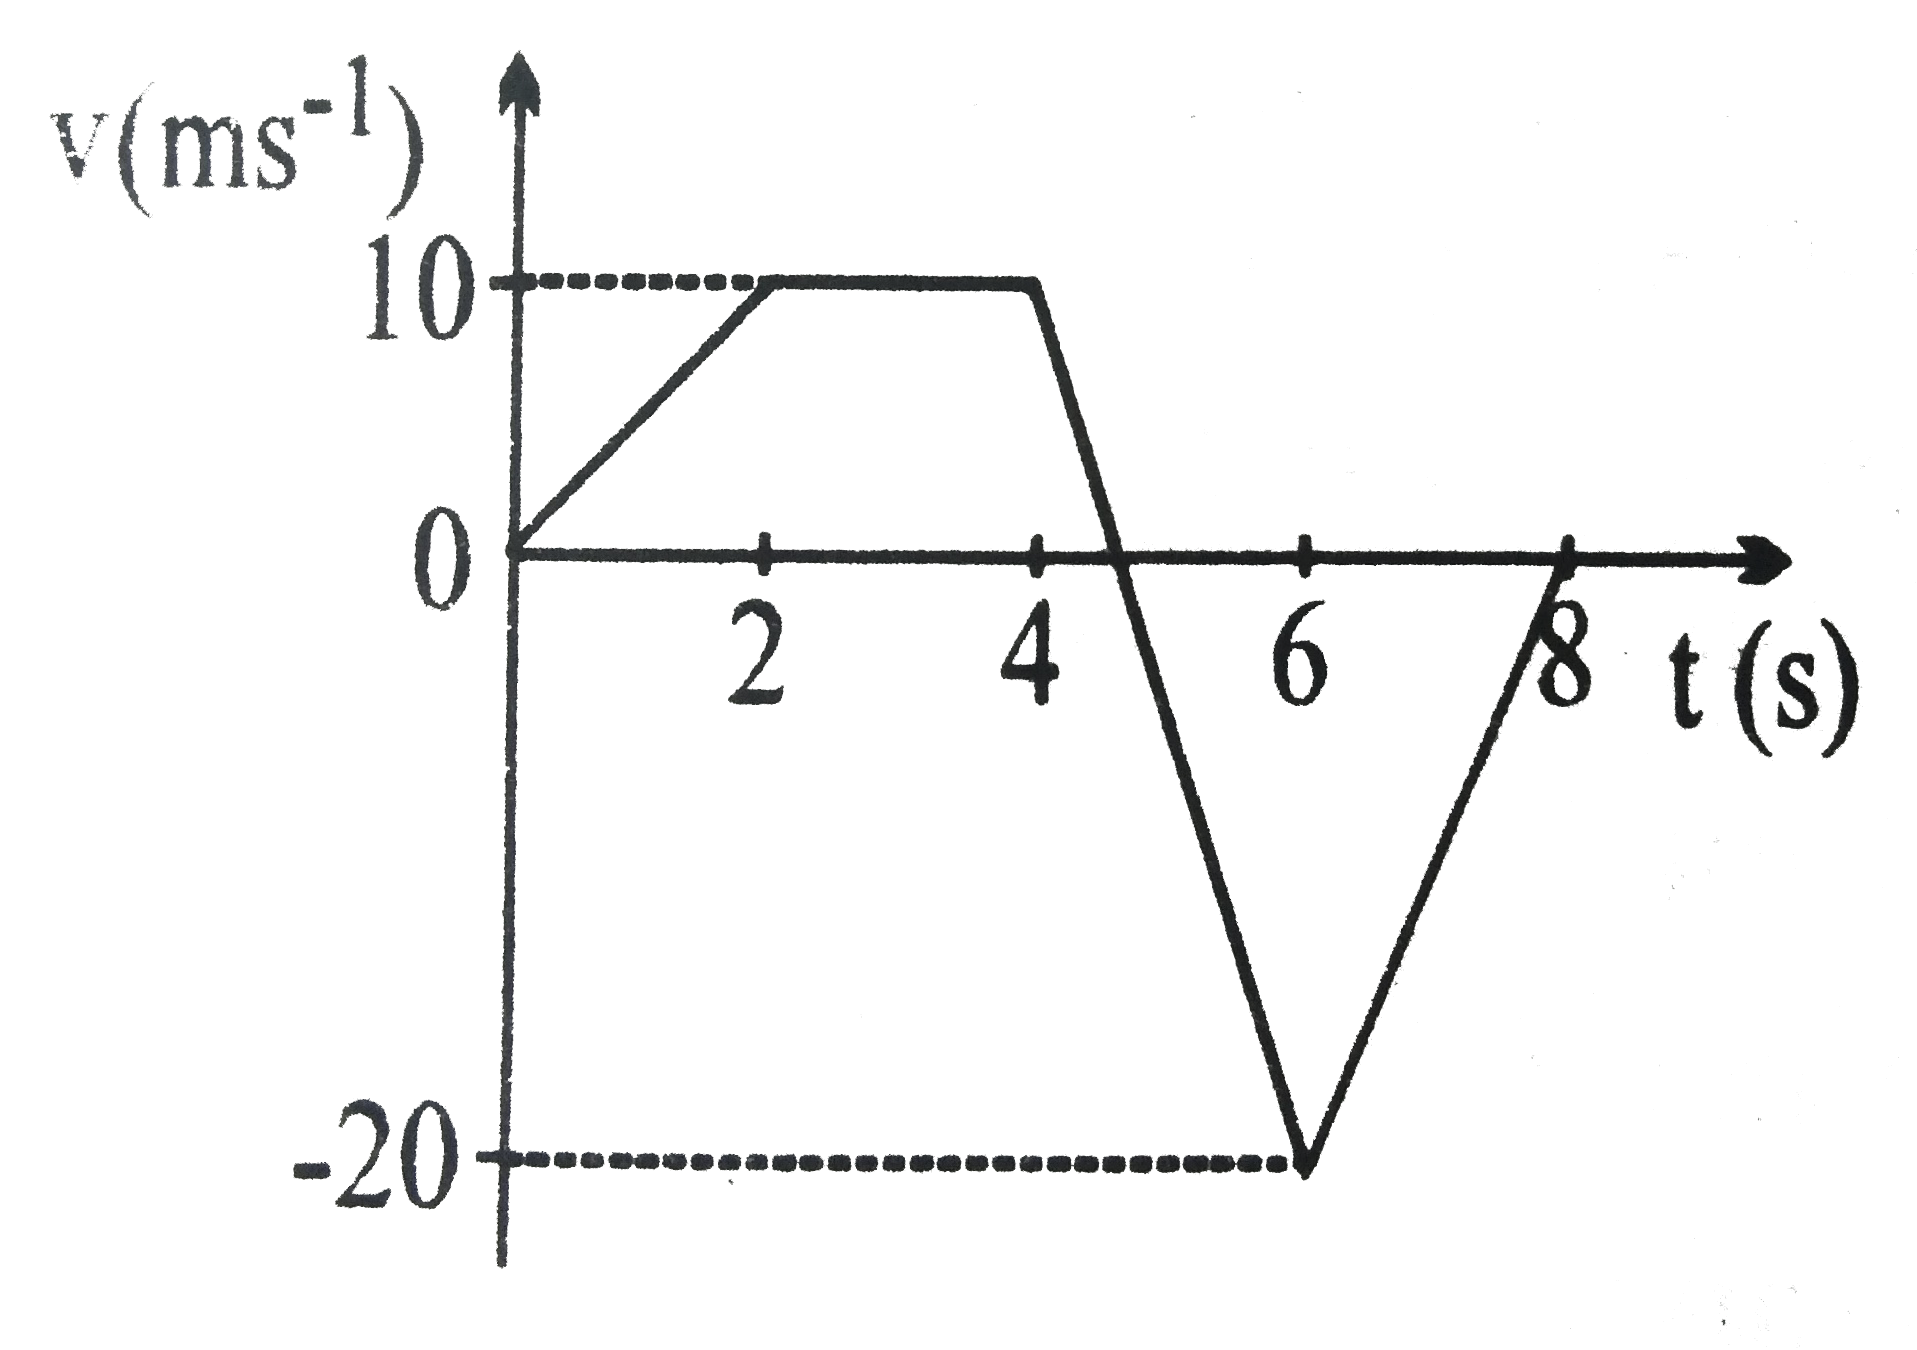
The figure shows a velocity-time graph of a particle moving along a straight line
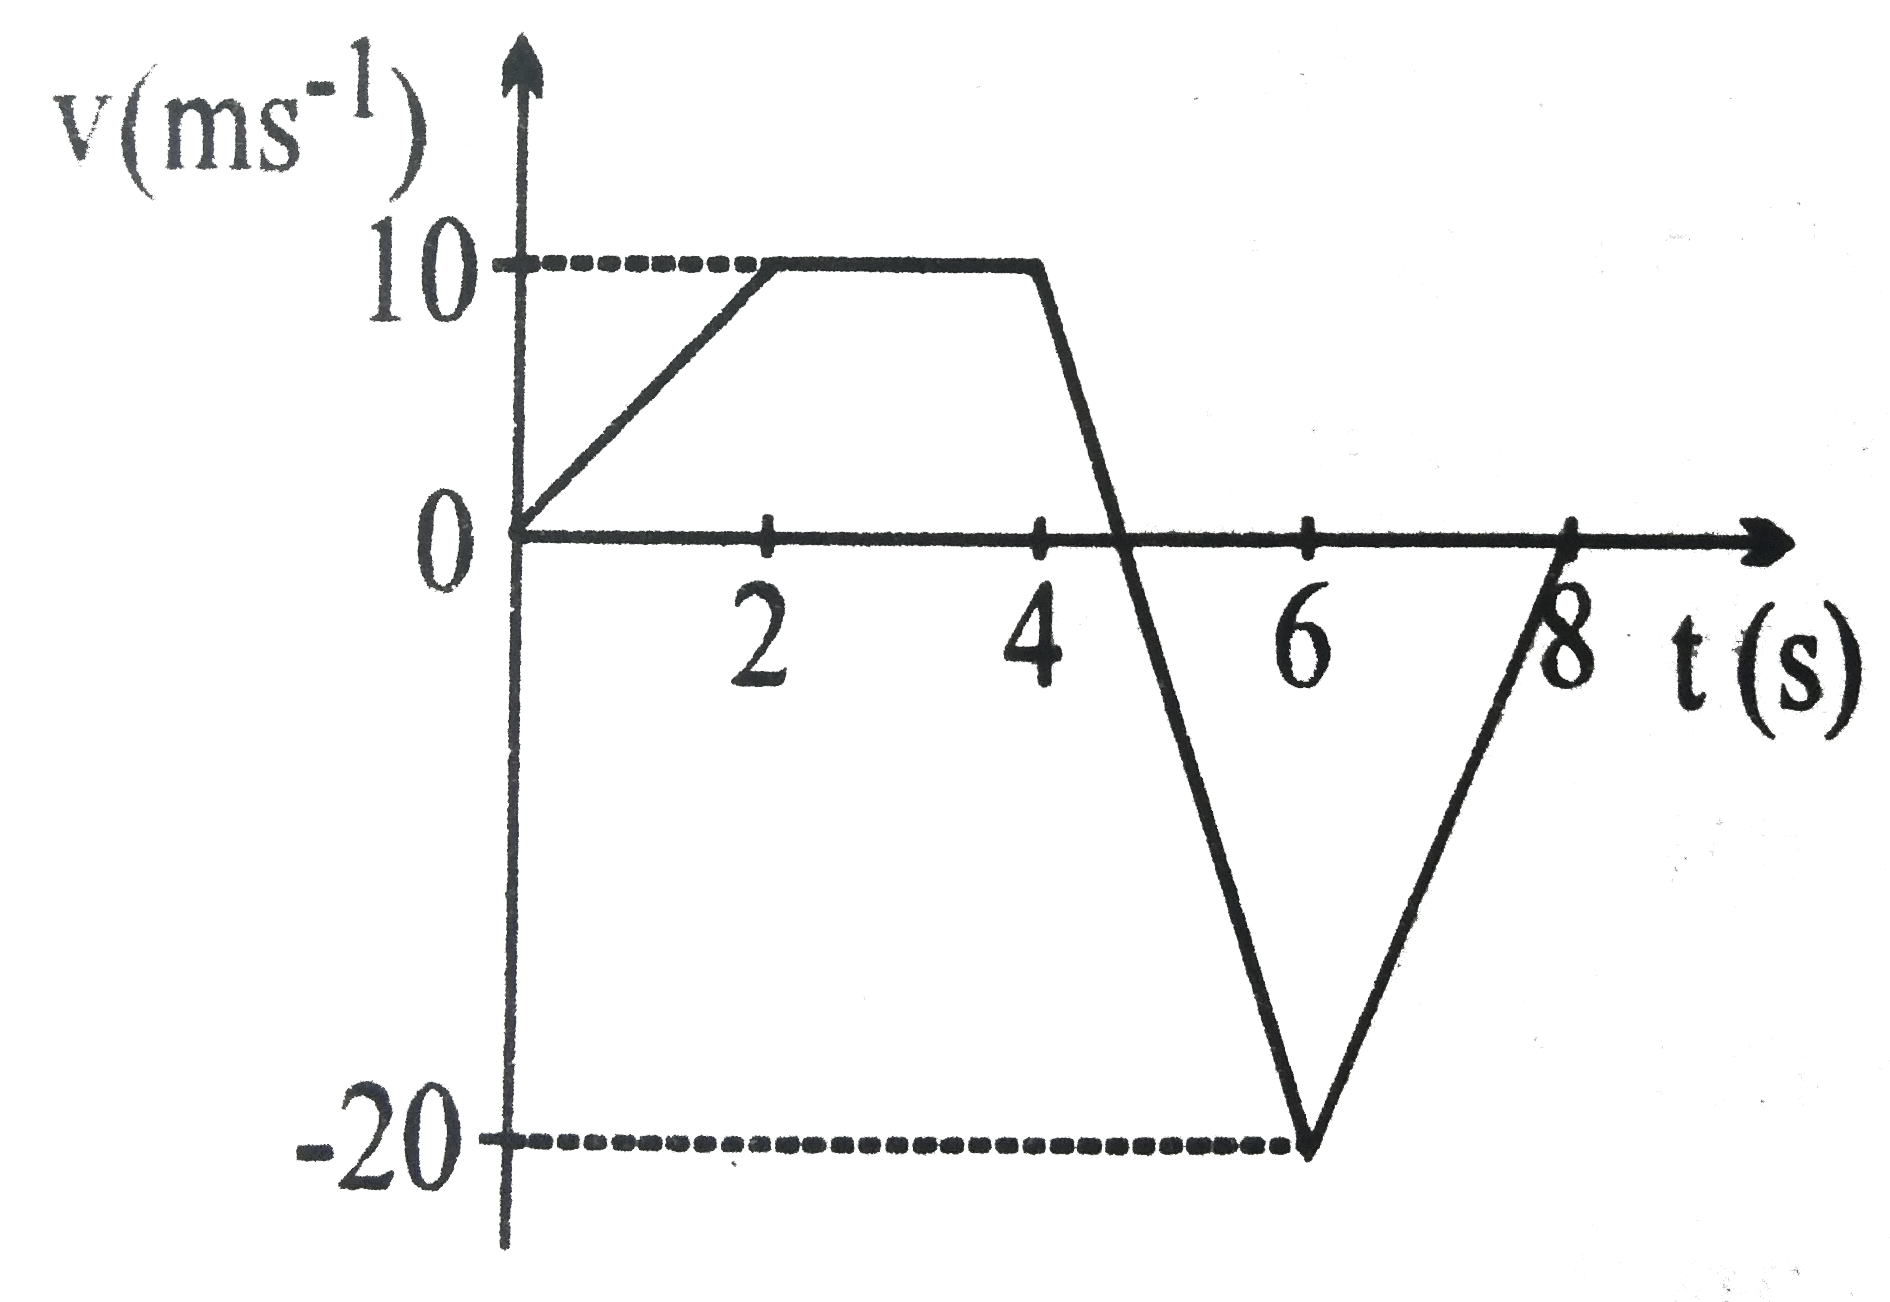
If the particles starts form the position x0=−15m, then its position at t=2s will be
A
−5
B
5m
C
10m
D
15m
Video Solution
Text Solution
The correct Answer is:A
displacement = Area convered by v−t graph on time axis
x−x0=12×2×10
x−(−15)=10⇒x=−5m
|
Similar Questions
Knowledge Check
The figure shows a velocity-time graph of a particle moving along a straight line
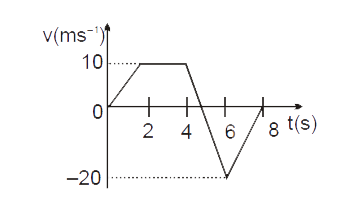
If the particle starts from the position x0=–15 m, then its position at t = 2s will beA−5mB5mC10 mD15 mThe figure shows a velocity-time graph of a particle moving along a straight line
Q. If the particle starts from the position x0 = –15 m, then its position at t = 2s will beA−5mB5mC10mD15mThe figure shows velocity-time graph of a particle moving along a straight line. Identify the correct statement.
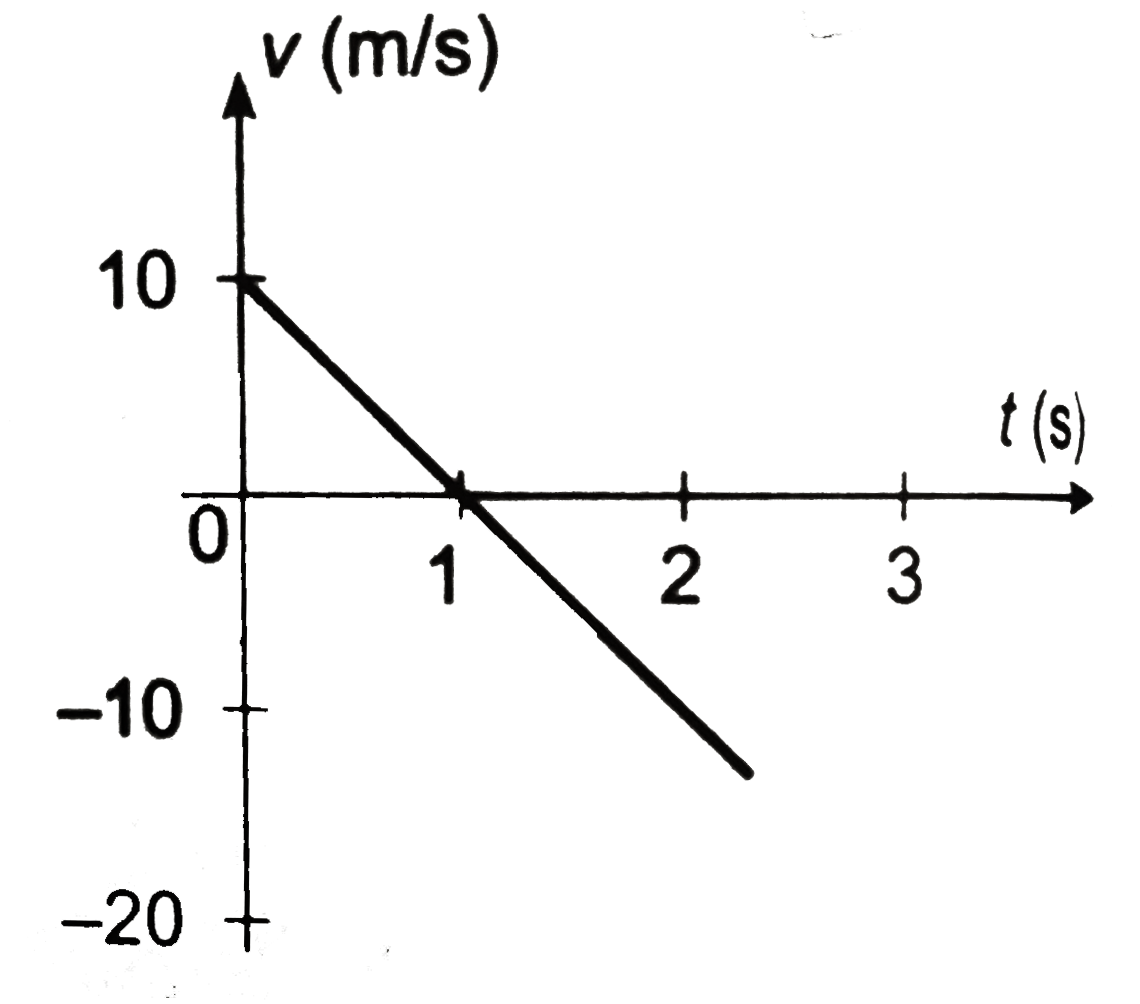 AThe particle starts from the originBThe particle crosses it initial position at t=2sCThe average speed of the particle in the time interval, 0≤t≤2s is zeroDAll of the above
The figure shows a velocity-time graph of a particle moving along a straight line
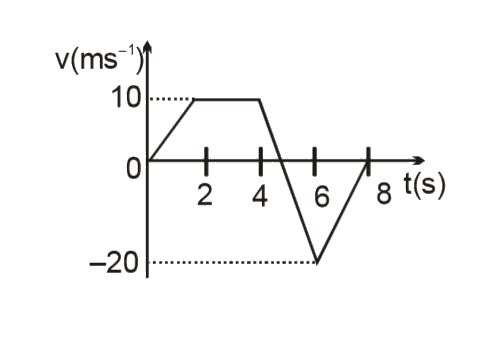
Q. The maximum of displacement of the particle is
View SolutionThe figure shows a velocity-time graph of a particle moving along a straight line
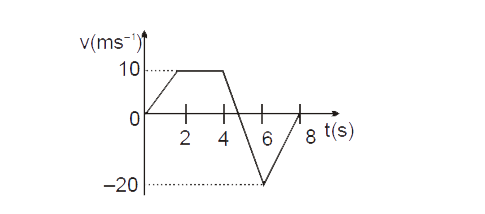
The total distance travelled by the particle is
View SolutionThe figure shows a velocity-time graph of a particle moving along a straight line
Q. The total distance travelled by the particle is
View SolutionThe figure shows a velocity-time graph of a particle moving along a straight line
The total distance4 travelled by the particel is
View SolutionThe figure shows a velocity-time graph of a particle moving along a straight line
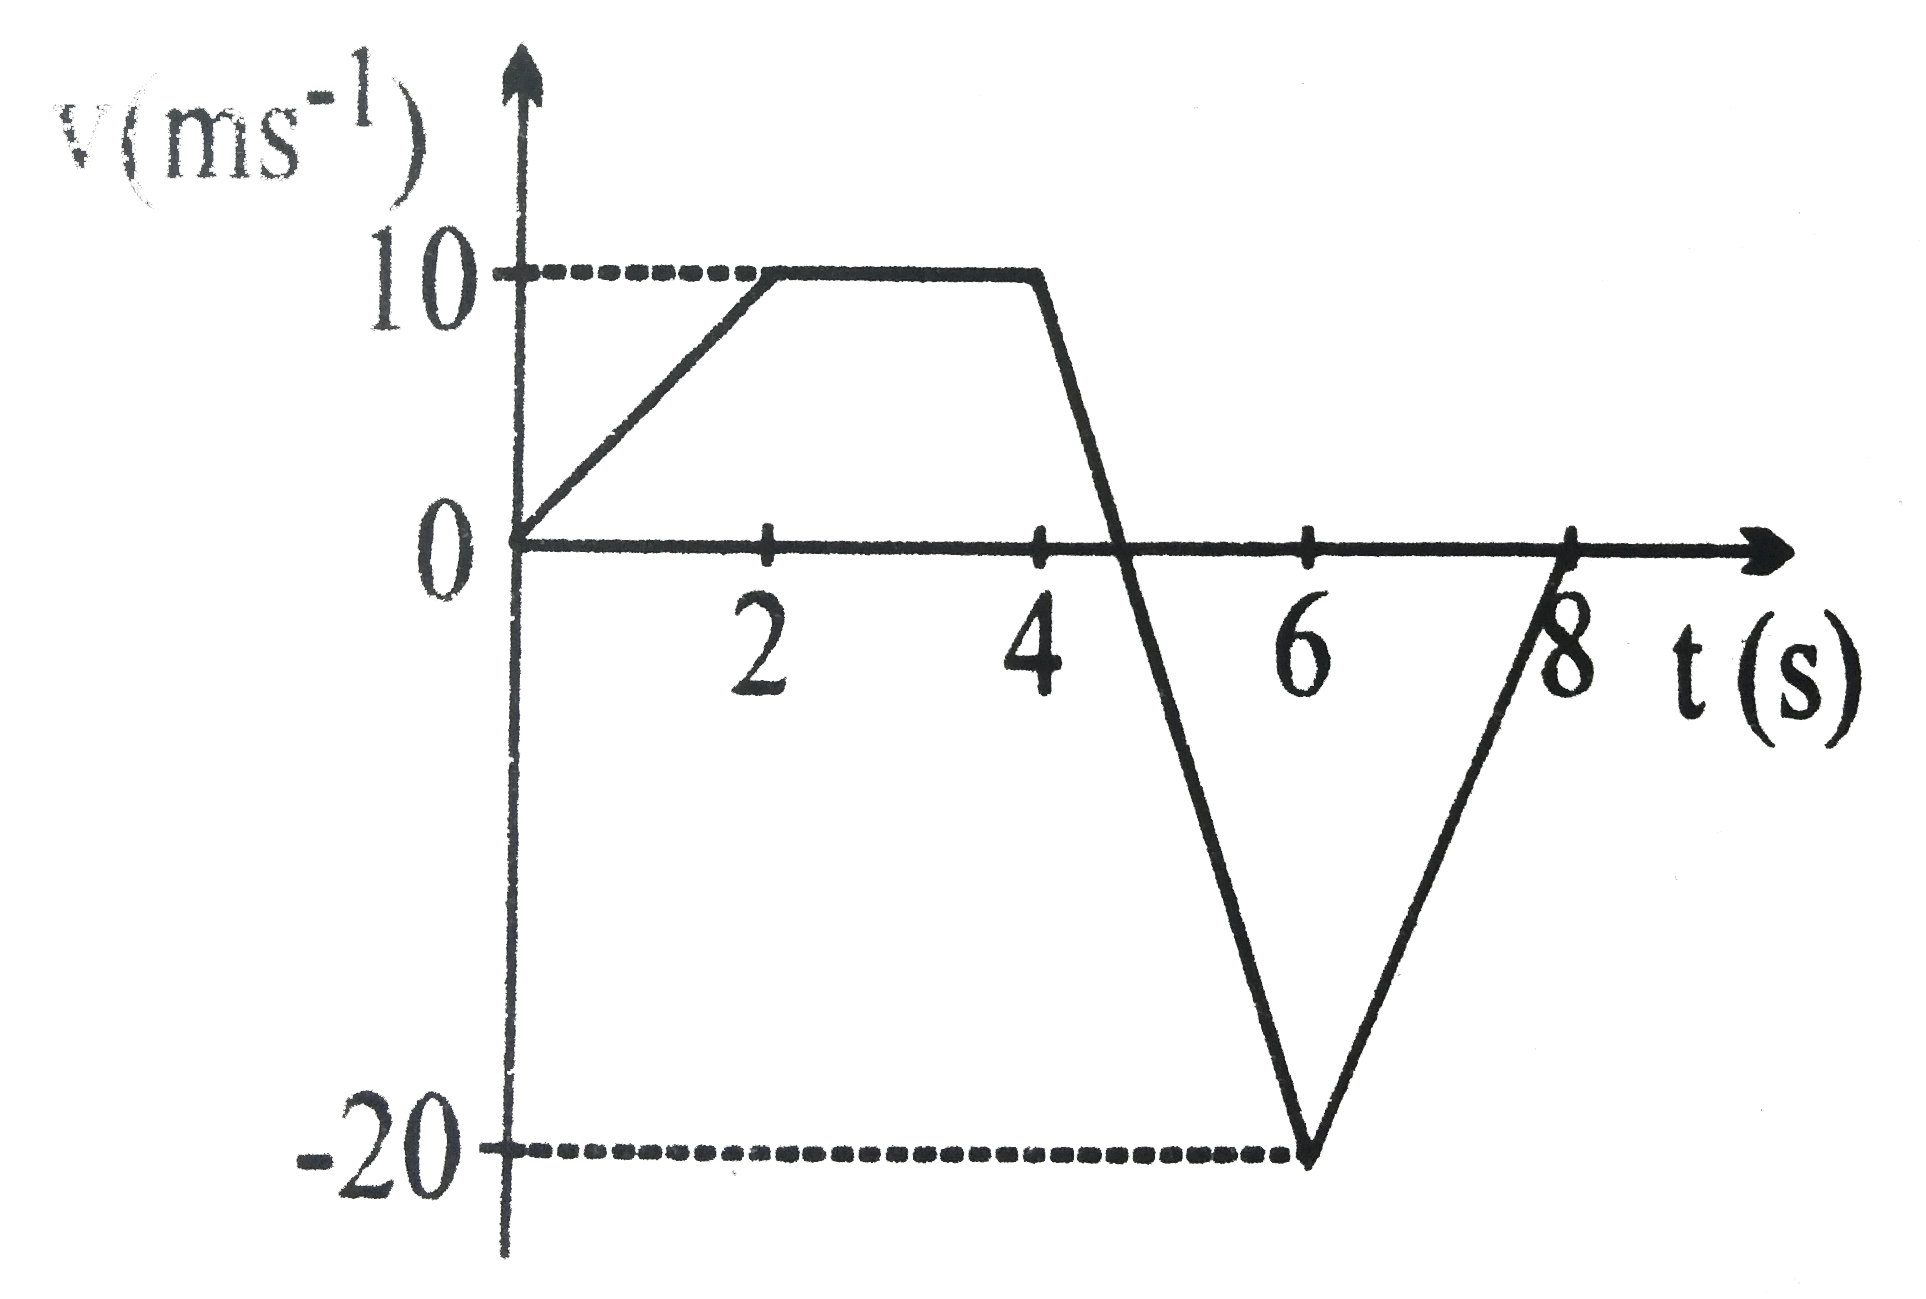
Choose the incorrect statement. The particle comes to rest at
View Solution

