(a) नीचे दी हुई सारणी को पूरा कीजिए और इस सारणी को देखकर ही समीकरण m+10=16 का हल ज्ञात कीजिए :

(b) नीचे दी हुई सारणी को पूरा कीजिए और इस सारणी को देखकर ही समीकरण 5t=35 का हल ज्ञात कीजिए :

(c ) सारणी को पूरा कीजिए और समीकरण z3=4 का हल ज्ञात कीजिए :

(d) सारणी को पूरा कीजिए और समीकरण m-7=3 का हल ज्ञात कीजिए :

Step by step video & image solution for (a) नीचे दी हुई सारणी को पूरा कीजिए और इस सारणी को देखकर ही समीकरण m+10=16 का हल ज्ञात कीजिए : (b) नीचे दी हुई सारणी को पूरा कीजिए और इस सारणी को देखकर ही समीकरण 5t=35 का हल ज्ञात कीजिए : (c ) सारणी को पूरा कीजिए और समीकरण (z)/(3)=4 का हल ज्ञात कीजिए : (d) सारणी को पूरा कीजिए और समीकरण m-7=3 का हल ज्ञात कीजिए : by Maths experts to help you in doubts & scoring excellent marks in Class 6 exams.
Updated on:21/07/2023Topper's Solved these Questions
Similar Questions
निम्नलिखित प्रश्नो के उत्तर दीजिए :
(a) सरिता की वर्तमान आयु y वर्ष लीजिए।
(i) आज से 5 वर्ष बाद उसकी आयु क्या होगी?
(ii) 3 वर्ष पहले उसकी आयु क्या थी?
(iii) सरिता के दादाजी की आयु उसकी आयु की 6 गुनी है। उसके दादाजी की क्या आयु है?
(iv) उसकी दादीजी दादाजी से 2 वर्ष छोटी है। दादाजी की आयु क्या है ?
(v) सरिता के पिता की आयु सरिता की आयु के तीन गुने से 5 वर्ष अधिक है। उसके पिता की आयु क्या है?
(b) एक आयातकार हॉल की लम्बाई उसकी चौड़ाई के तीनगुने से 4 मीटर कम है। यदि चौड़ाई b मित्रे है, तो लम्बाई क्या है?
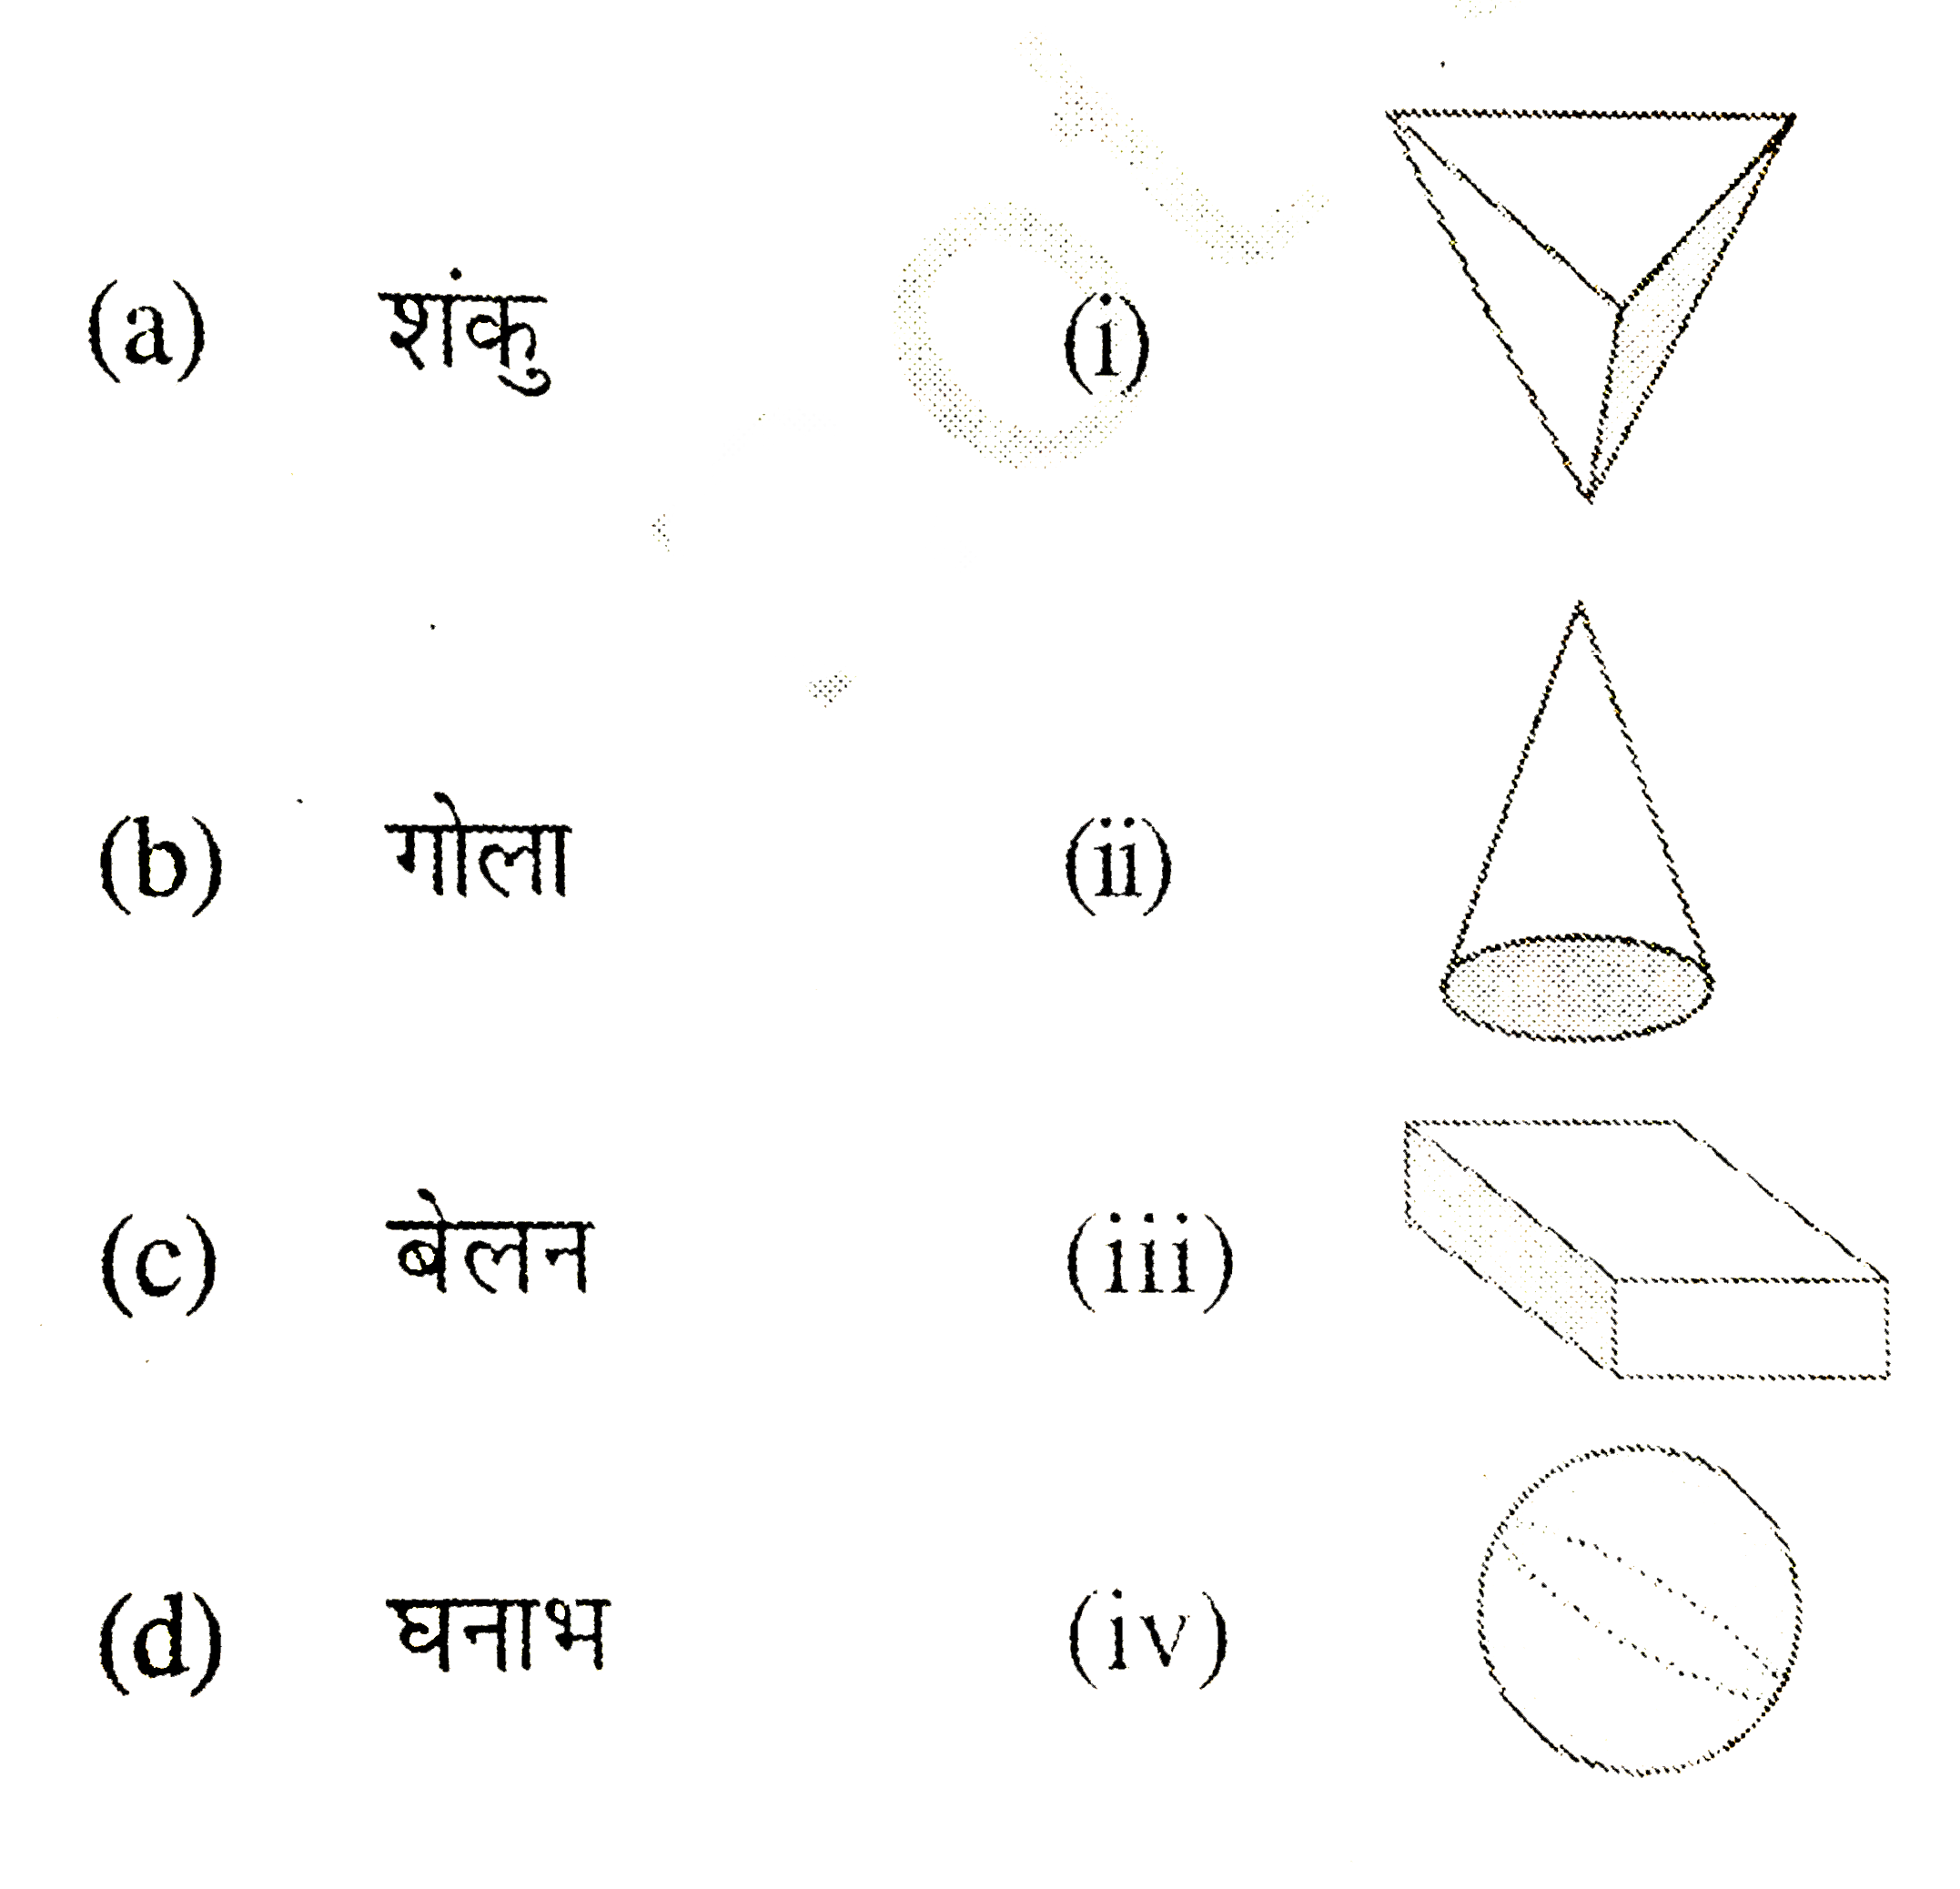
View Solutionनिम्न का सुमेलन कीजिए :


इन आकारों में से प्रत्येक के दो और उदाहरण दीजिए |
View Solutionहल कीजिएः
(a).23+17 (b).310+715 (c).49+27 (d).57+13
View SolutionHow many lines of symmetry does the above figure have ?
View SolutionWhich of the following are correct chain isomers of butane ? (i)
View SolutionDetermine the point of symmetry of a regular hexagon.
View SolutionDtermine the images of the following figure about the given line :
View SolutionMatch the following Column A to Column B

View SolutionMatch the following Column A to Column B

View SolutionMatch the following Column A to Column B

View SolutionFind the area of the figure given below.

View SolutionThe area of the shaded part in the figure given below is ______.

View SolutionThe inequation represented by the graph given below is :
View SolutionThe inequation that best describes the graph given below is _________
View SolutionThe inequation that best describes the following graph is _________
View SolutionWhich inequations represent the shaded region in the given figure
View Solution
