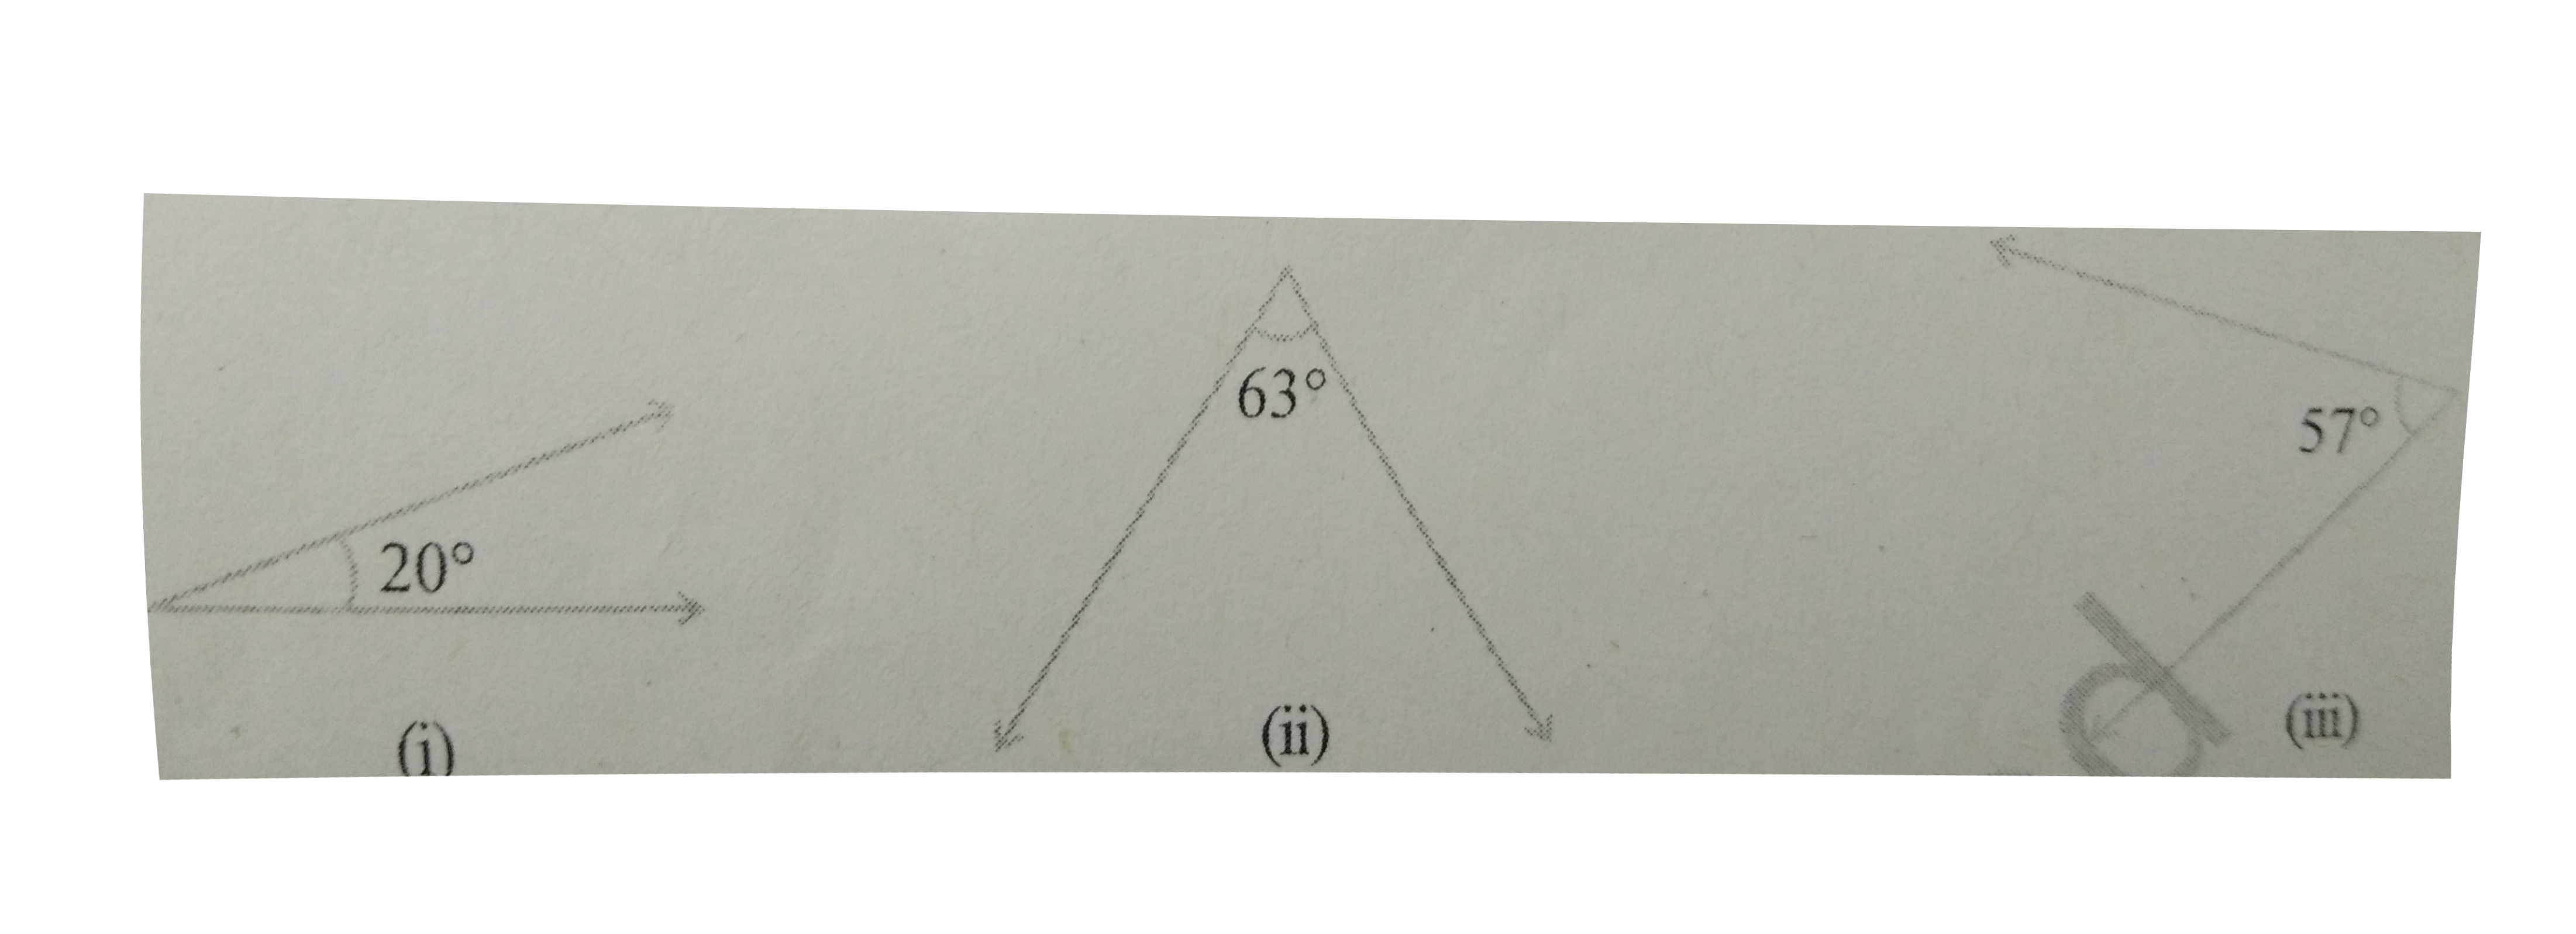
नीचे दी हुई आकृतियों में निर्णय लीजिये, क्या l,m के समांतर है ।

The correct Answer is:(i) l, m के समांतर नहीं है । (ii) l, m के समांतर नहीं है ।
(iii) l, m के समांतर है । (iv) l, m के समांतर नहीं है ।
Step by step video & image solution for नीचे दी हुई आकृतियों में निर्णय लीजिये, क्या l, m के समांतर है । by Maths experts to help you in doubts & scoring excellent marks in Class 7 exams.
Updated on:21/07/2023Topper's Solved these Questions
Similar Questions
निम्नलिखित कोणों में से प्रत्येक का पूरक ज्ञात कीजिए ।

View Solutionक्रय -विक्रय के निम्न सौदों में हानि या लाभ ज्ञात कीजिए । प्रत्येक दशा में प्रतिशत हानि या प्रतिशत लाभ भी ज्ञात कीजिए ।
(a) बगीचे में काम आने वाली कैंची ₹250 में खरीदी गई तथा ₹325 में बेचीं गई ।
(b) एक रेफ्रिजरेटर ₹12000 में खरीदा गया और ₹13500 में बेचा गया ।
(c )एक अलमारी ₹2500 में खरीदी गई और ₹3000 में बेचीं गई ।
(d )एक स्कर्ट ₹250 में खरीद कर ₹150 में बेचीं गई ।
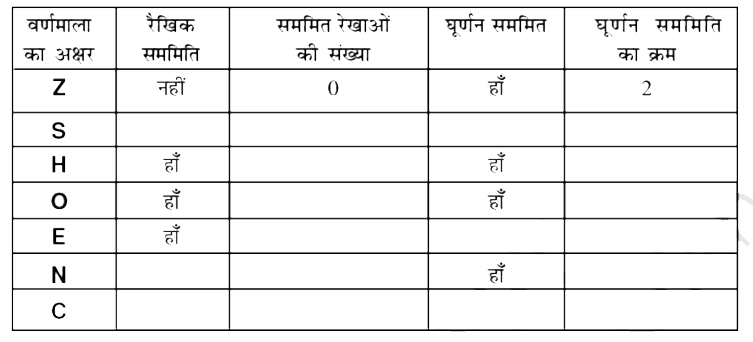
View Solutionअंग्रेजी वर्णमाला के कुछ अक्षरों में अद्भुत एवं आकर्षक सममितीय संरचनाएं है। किन बड़े अक्षरों में केवल एक ही सममित रेखा है किन बड़े अक्षरों में क्रम 2 की घूर्णन सममिति हैं
उपरोक्त प्रकार से सोचते हुए आप निम्नलिखित सारणी की भरने में समर्थ हो पाएंगें:

View SolutionIdentify the cell organelle 'A' :-
ltimg src="https://d10lpgp6xz60nq.cloudfront.net/physics_images/ALN_BIO_C10_E08_018_Q01.png" width="80%"gt
View SolutionHow many lines of symmetry does the above figure have ?
View SolutionWhich of the following are correct chain isomers of butane ? (i)
View SolutionDetermine the point of symmetry of a regular hexagon.
View SolutionDtermine the images of the following figure about the given line :
View SolutionMatch the following Column A to Column B

View SolutionMatch the following Column A to Column B

View SolutionMatch the following Column A to Column B

View SolutionFind the area of the figure given below.

View SolutionThe area of the shaded part in the figure given below is ______.

View SolutionThe inequation represented by the graph given below is :
View SolutionThe inequation that best describes the graph given below is _________
View SolutionThe inequation that best describes the following graph is _________
View Solution
