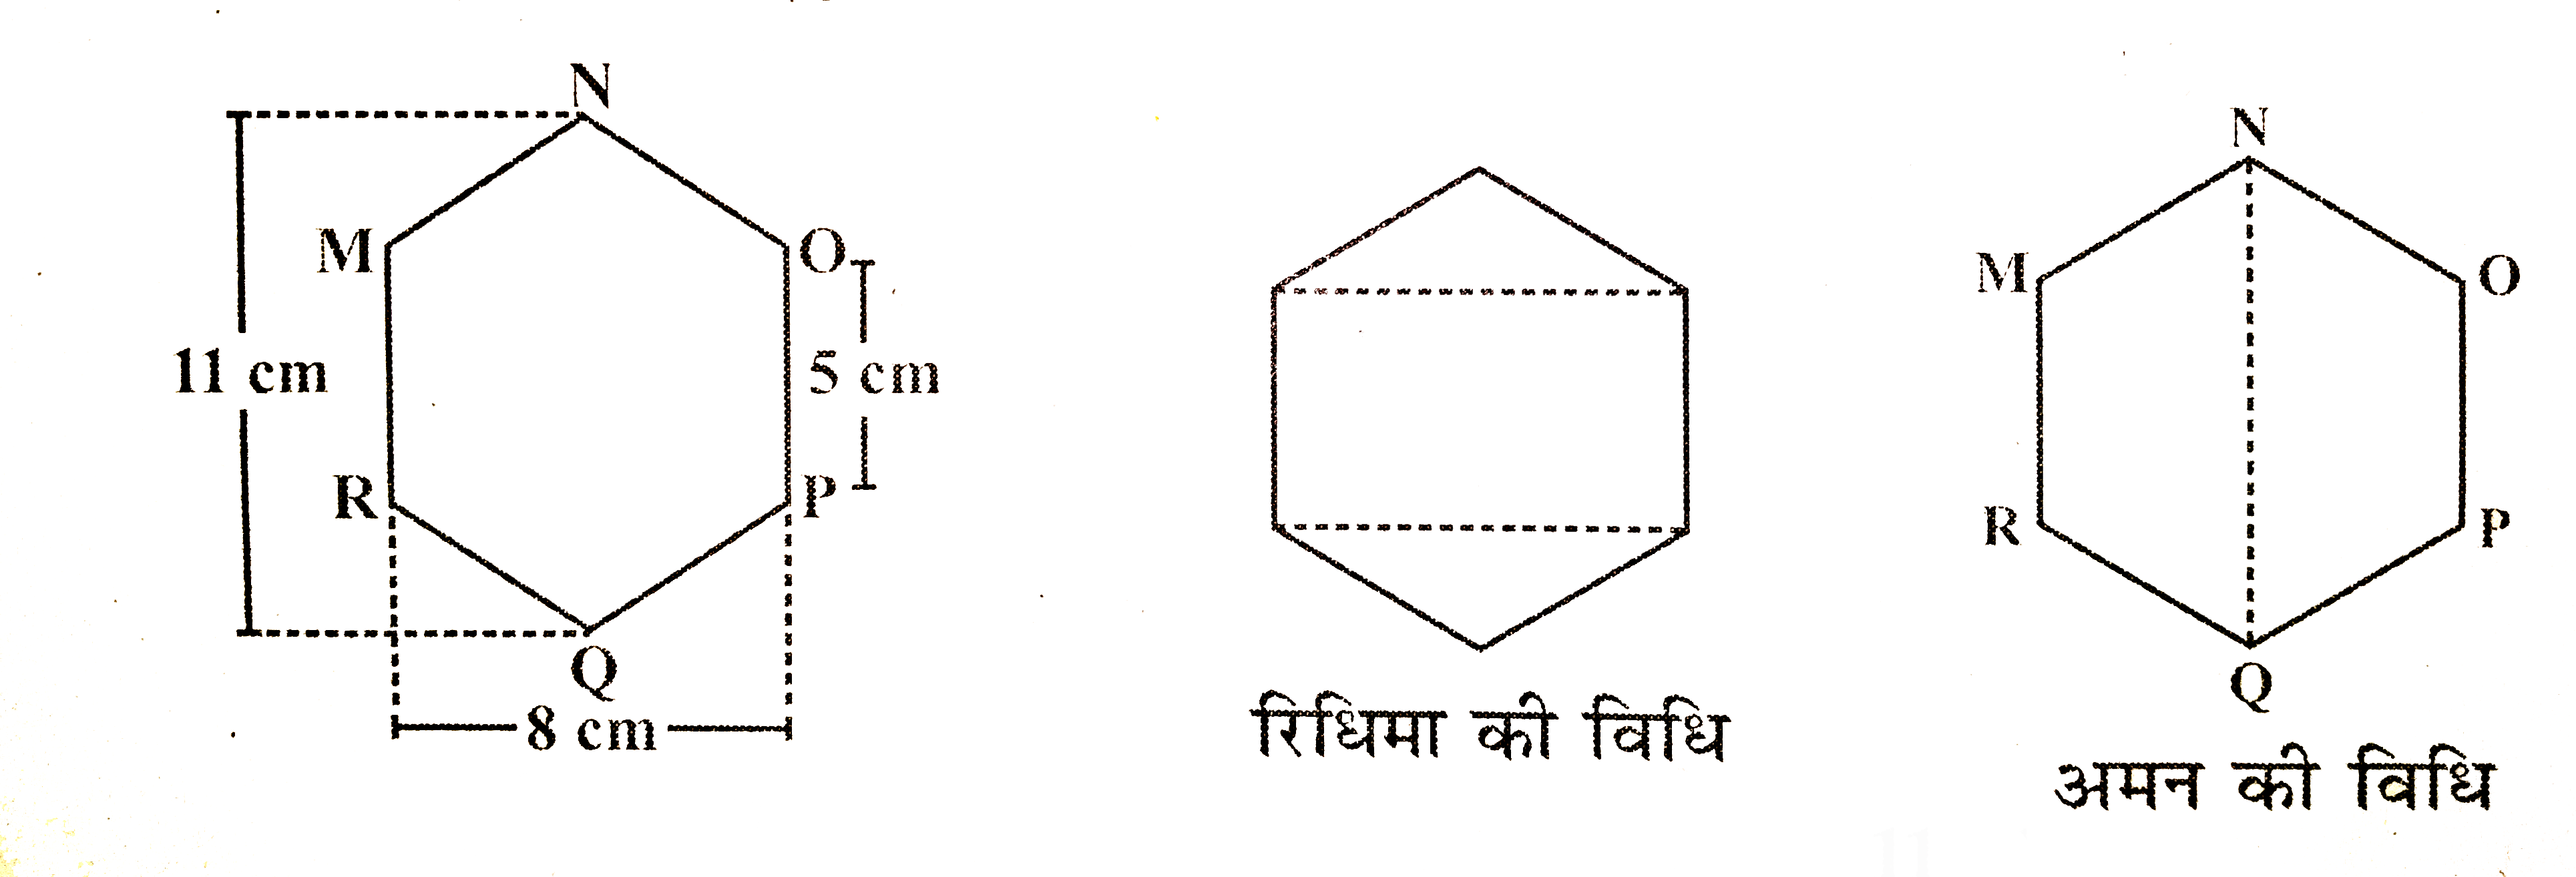
MNOPQR (आकृति 11.20 ) एक षड्भुज है जिसकी प्रत्येक भुजा 5cm है | अमन और रिधिमा ने इसे दो विभिन्न प्रकार से विभाजित किया (आकृति 11.21 ) दोनों प्रकार का उपयोग करते हुए इस षंड्भुज का क्षेत्रफल ज्ञात कीजिए |

Step by step video & image solution for MNOPQR (आकृति 11.20 ) एक षड्भुज है जिसकी प्रत्येक भुजा 5cm है | अमन और रिधिमा ने इसे दो विभिन्न प्रकार से विभाजित किया (आकृति 11.21 ) दोनों प्रकार का उपयोग करते हुए इस षंड्भुज का क्षेत्रफल ज्ञात कीजिए | by Maths experts to help you in doubts & scoring excellent marks in Class 8 exams.
Updated on:21/07/2023Topper's Solved these Questions
- क्षेत्रमिति BOOK - NCERT HINDICHAPTER - क्षेत्रमिति EXERCISE - प्रयास कीजिए
13 Videos
- क्षेत्रमिति BOOK - NCERT HINDICHAPTER - क्षेत्रमिति EXERCISE - प्रश्नावली 11.1
5 Videos
- एक चर वाले रैखिक समीकरणBOOK - NCERT HINDICHAPTER - एक चर वाले रैखिक समीकरणEXERCISE - प्रश्नावली 2.6
7 Videos
- गुणनखंडBOOK - NCERT HINDICHAPTER - गुणनखंडEXERCISE - प्रयास कीजिए
2 Videos
Similar Questions
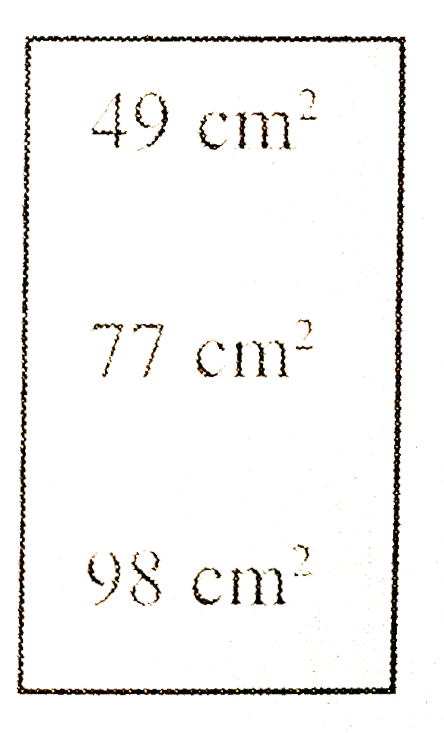
(a) निम्नलिखत आकृतियों का उनके क्षेत्रफलों से मिलान कीजिए:

(b) प्रत्येक आकार का परिमाप लिखिए |


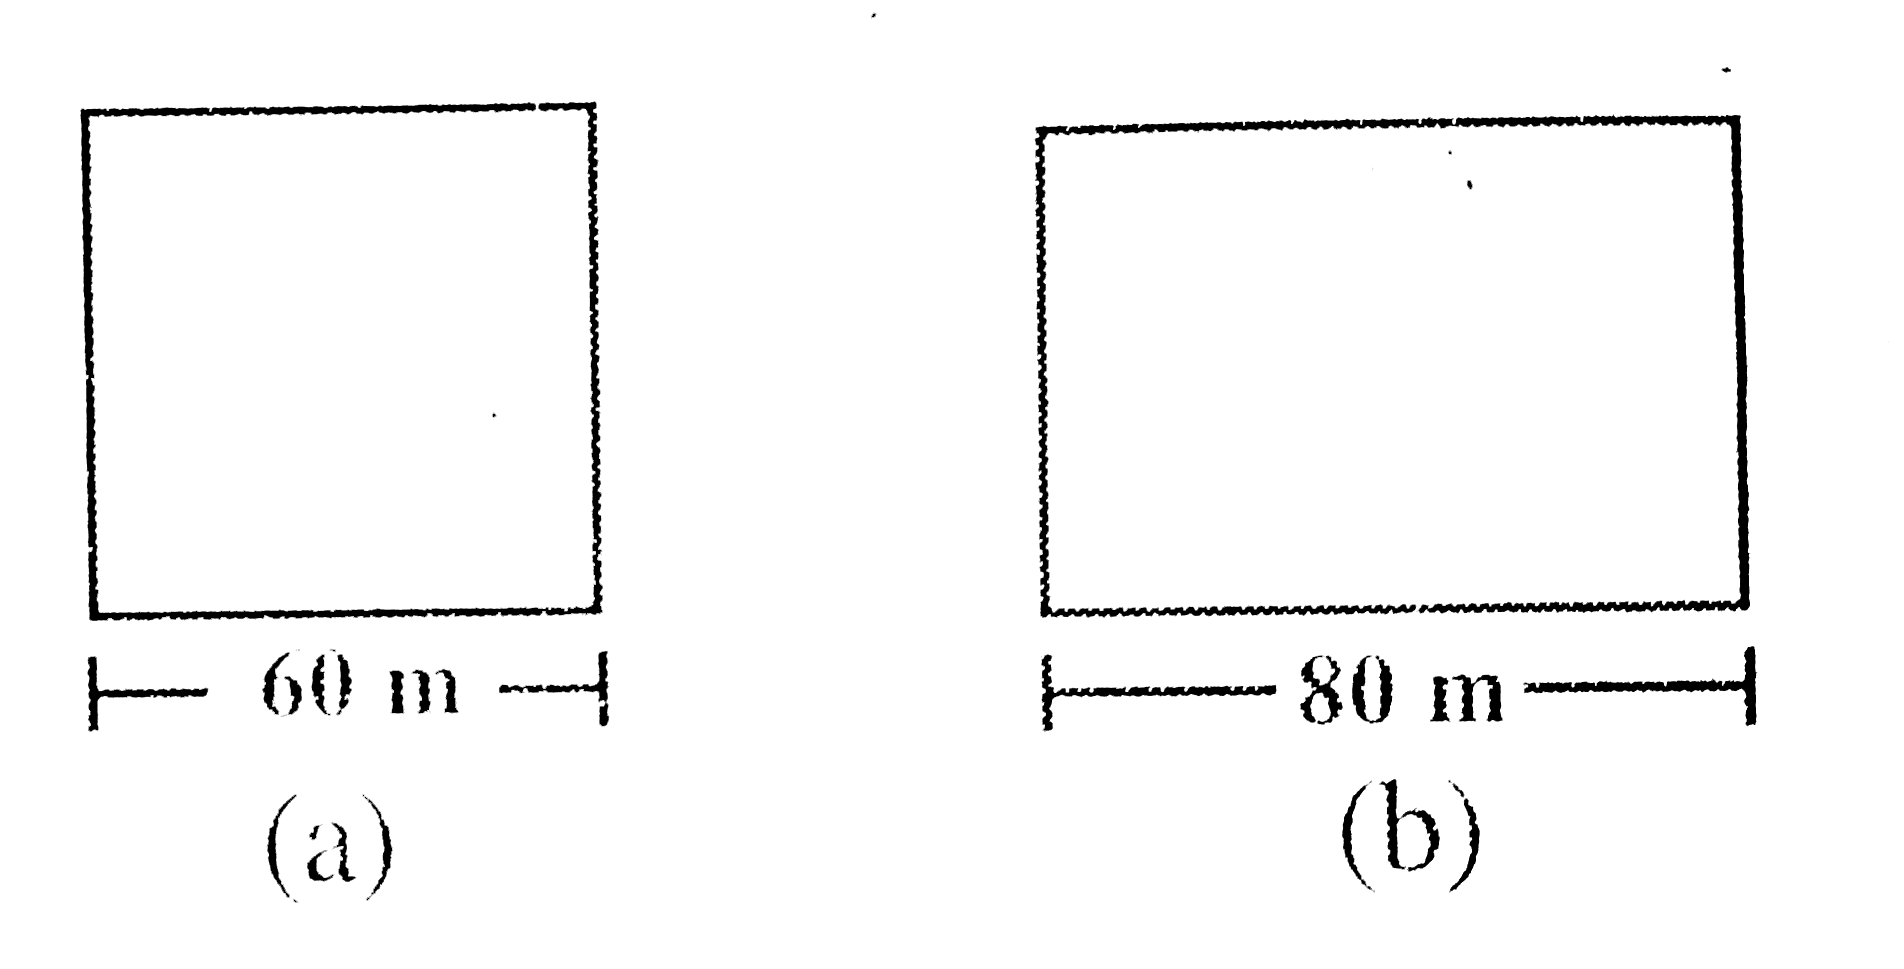
View Solutionजैसा कि संलग्न में दर्शाया गया है, एक आयातकार और एक वर्गाकार खेत के माप दिए हुए है | यदि इनके परिमाप समान है, तो किस खेत का क्षेत्रफल अधिक होगा ?

View Solution8x−33x=2
View Solutionगुणनखंड कीजिएः
(i) 12x+36 (ii) 22y−33z (iii) 14pq+35pqr
View SolutionHow many lines of symmetry does the above figure have ?
View SolutionWhich of the following are correct chain isomers of butane ? (i)
View SolutionDetermine the point of symmetry of a regular hexagon.
View SolutionDtermine the images of the following figure about the given line :
View SolutionMatch the following Column A to Column B

View SolutionMatch the following Column A to Column B

View SolutionMatch the following Column A to Column B

View SolutionFind the area of the figure given below.

View SolutionThe area of the shaded part in the figure given below is ______.

View SolutionThe inequation represented by the graph given below is :
View SolutionThe inequation that best describes the graph given below is _________
View SolutionThe inequation that best describes the following graph is _________
View Solution
