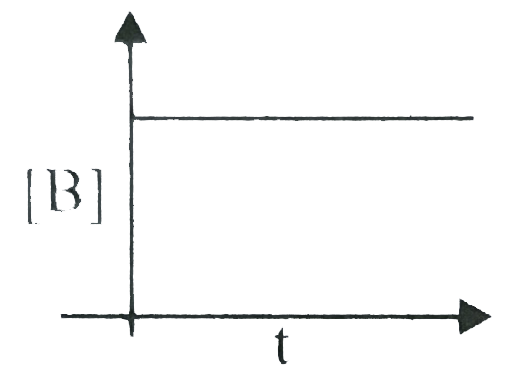
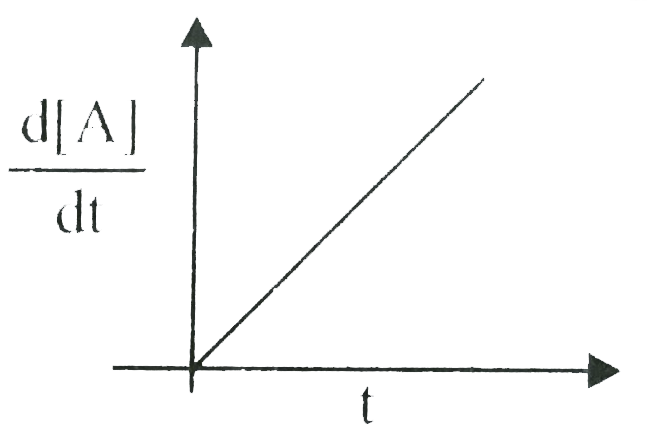
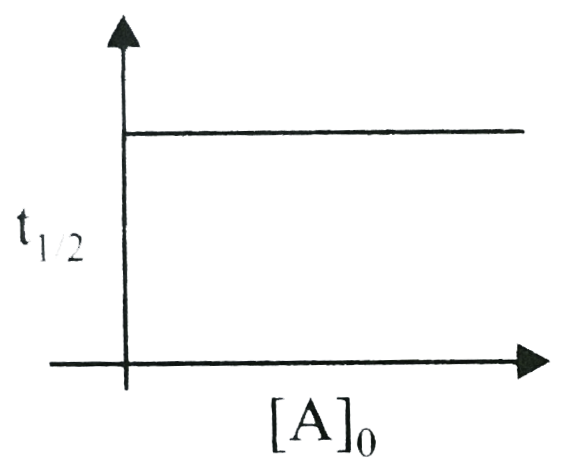
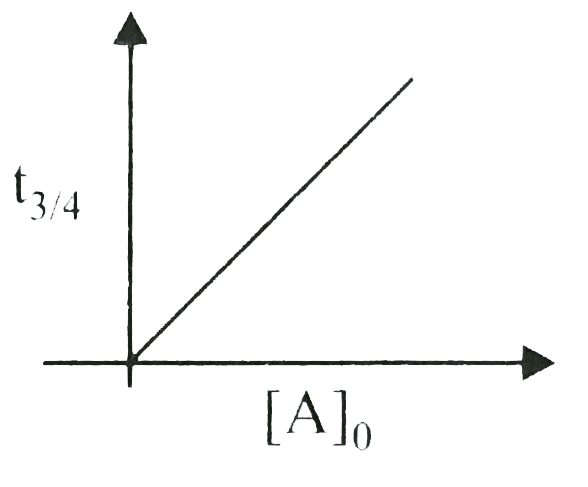
Which graph represents zero-order reaction [A(g)→B(g)] ?
The correct Answer is:D
To determine which graph represents a zero-order reaction for the equation (A(g)→B(g)), we can follow these steps:
Step 1: Understand the Zero-Order Reaction
In a zero-order reaction, the rate of reaction is constant and does not depend on the concentration of the reactants. The rate law can be expressed as:
−d(A)dt=k
where k is the rate constant.
Step 2: Derive the Concentration Equation
For a zero-order reaction, the concentration of reactant A changes linearly over time. The integrated rate law for a zero-order reaction is given by:
(A)=(A0)−kt
where (A0) is the initial concentration of A and t is time.
Step 3: Analyze the Graphs
From the equation (A)=(A0)−kt, we can infer that:
- The graph of (A) versus time t will be a straight line with a negative slope (since k is positive).
- The y-intercept of this graph will be (A0).
- As time increases, the concentration of A decreases linearly until it reaches zero.
Step 4: Identify the Correct Graph
Now, we need to look at the provided graphs and identify which one shows a straight line with a negative slope. The graph should start at (A0) and decrease linearly over time.
Step 5: Conclusion
After analyzing all the graphs, the correct graph that represents a zero-order reaction will be the one that shows a linear decrease in concentration of A over time.
Final Answer
The graph that represents a zero-order reaction is the one that shows a straight line with a negative slope.
---
In a zero-order reaction, the rate of reaction is constant and does not depend on the concentration of the reactants. The rate law can be expressed as:
−d(A)dt=k
where k is the rate constant.
For a zero-order reaction, the concentration of reactant A changes linearly over time. The integrated rate law for a zero-order reaction is given by:
(A)=(A0)−kt
where (A0) is the initial concentration of A and t is time.
From the equation (A)=(A0)−kt, we can infer that:
- The graph of (A) versus time t will be a straight line with a negative slope (since k is positive).
- The y-intercept of this graph will be (A0).
- As time increases, the concentration of A decreases linearly until it reaches zero.
Now, we need to look at the provided graphs and identify which one shows a straight line with a negative slope. The graph should start at (A0) and decrease linearly over time.
After analyzing all the graphs, the correct graph that represents a zero-order reaction will be the one that shows a linear decrease in concentration of A over time.
The graph that represents a zero-order reaction is the one that shows a straight line with a negative slope.
Topper's Solved these Questions
- CHEMICAL KINETICSBOOK - A2ZCHAPTER - CHEMICAL KINETICSEXERCISE - Initial Rate Method And Ostwaid Method
18 Videos
- CHEMICAL KINETICSBOOK - A2ZCHAPTER - CHEMICAL KINETICSEXERCISE - Arrhenius Equation, Effect Of Temprature And Effect Of Catalysts
35 Videos
- CHEMICAL KINETICSBOOK - A2ZCHAPTER - CHEMICAL KINETICSEXERCISE - Rate Law, Law Of Mass Action, Order Of The Reaction, And Molecularity
48 Videos
- BIOMOLECULESBOOK - A2ZCHAPTER - BIOMOLECULESEXERCISE - Section D - Chapter End Test
30 Videos
- COORDINATION COMPOUNDSBOOK - A2ZCHAPTER - COORDINATION COMPOUNDSEXERCISE - Section D - Chapter End Test
30 Videos
Similar Questions
Knowledge Check
Which of the following represents zero order reaction ?
A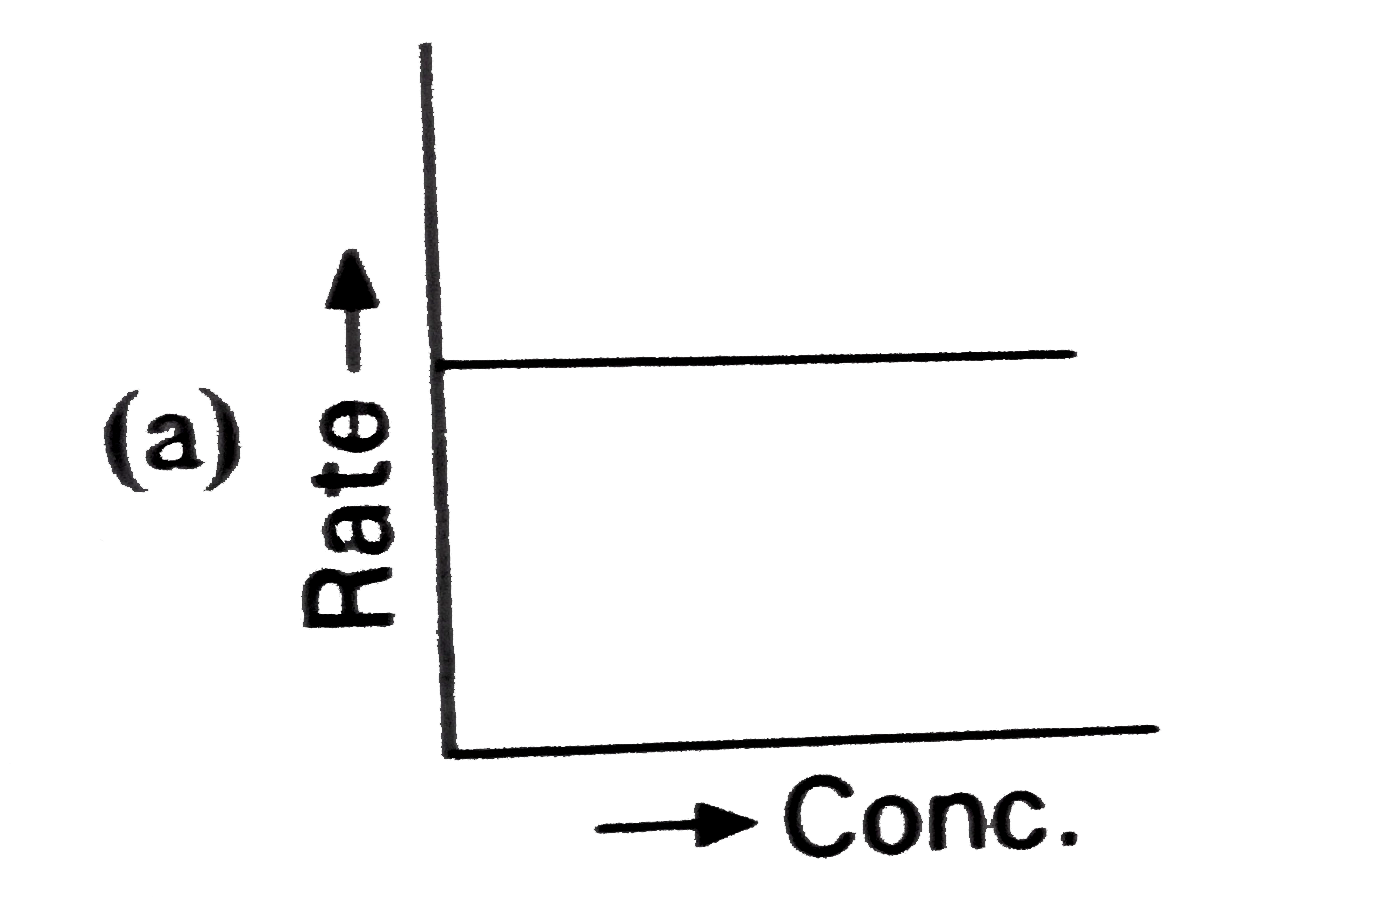 B
B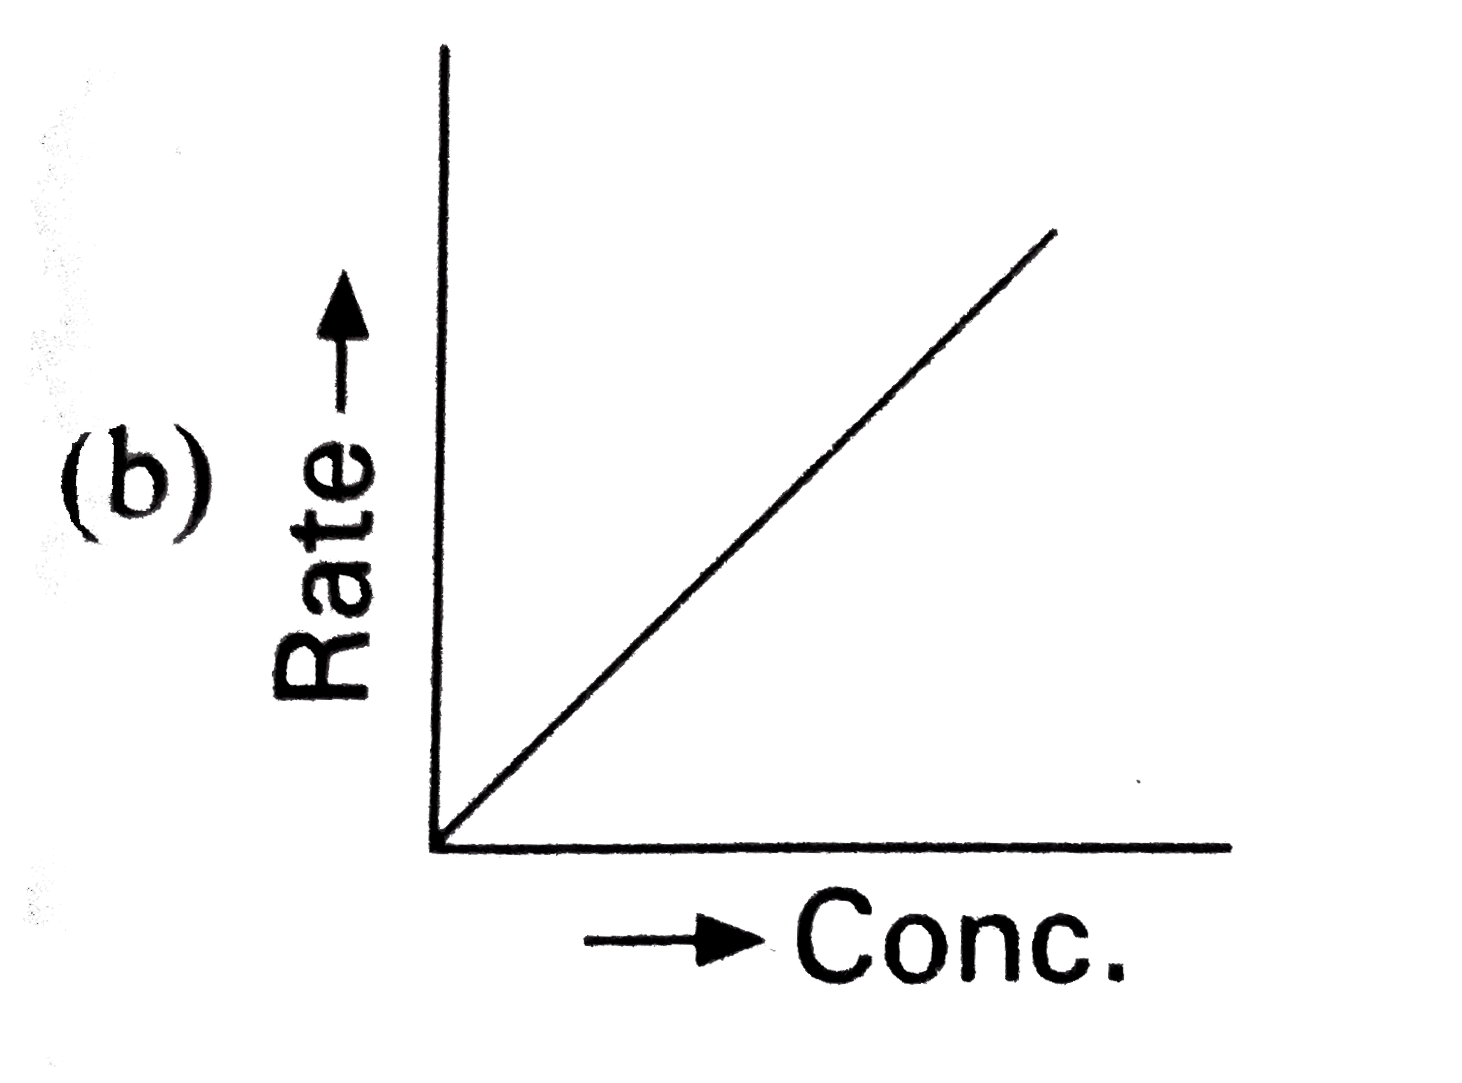 C
C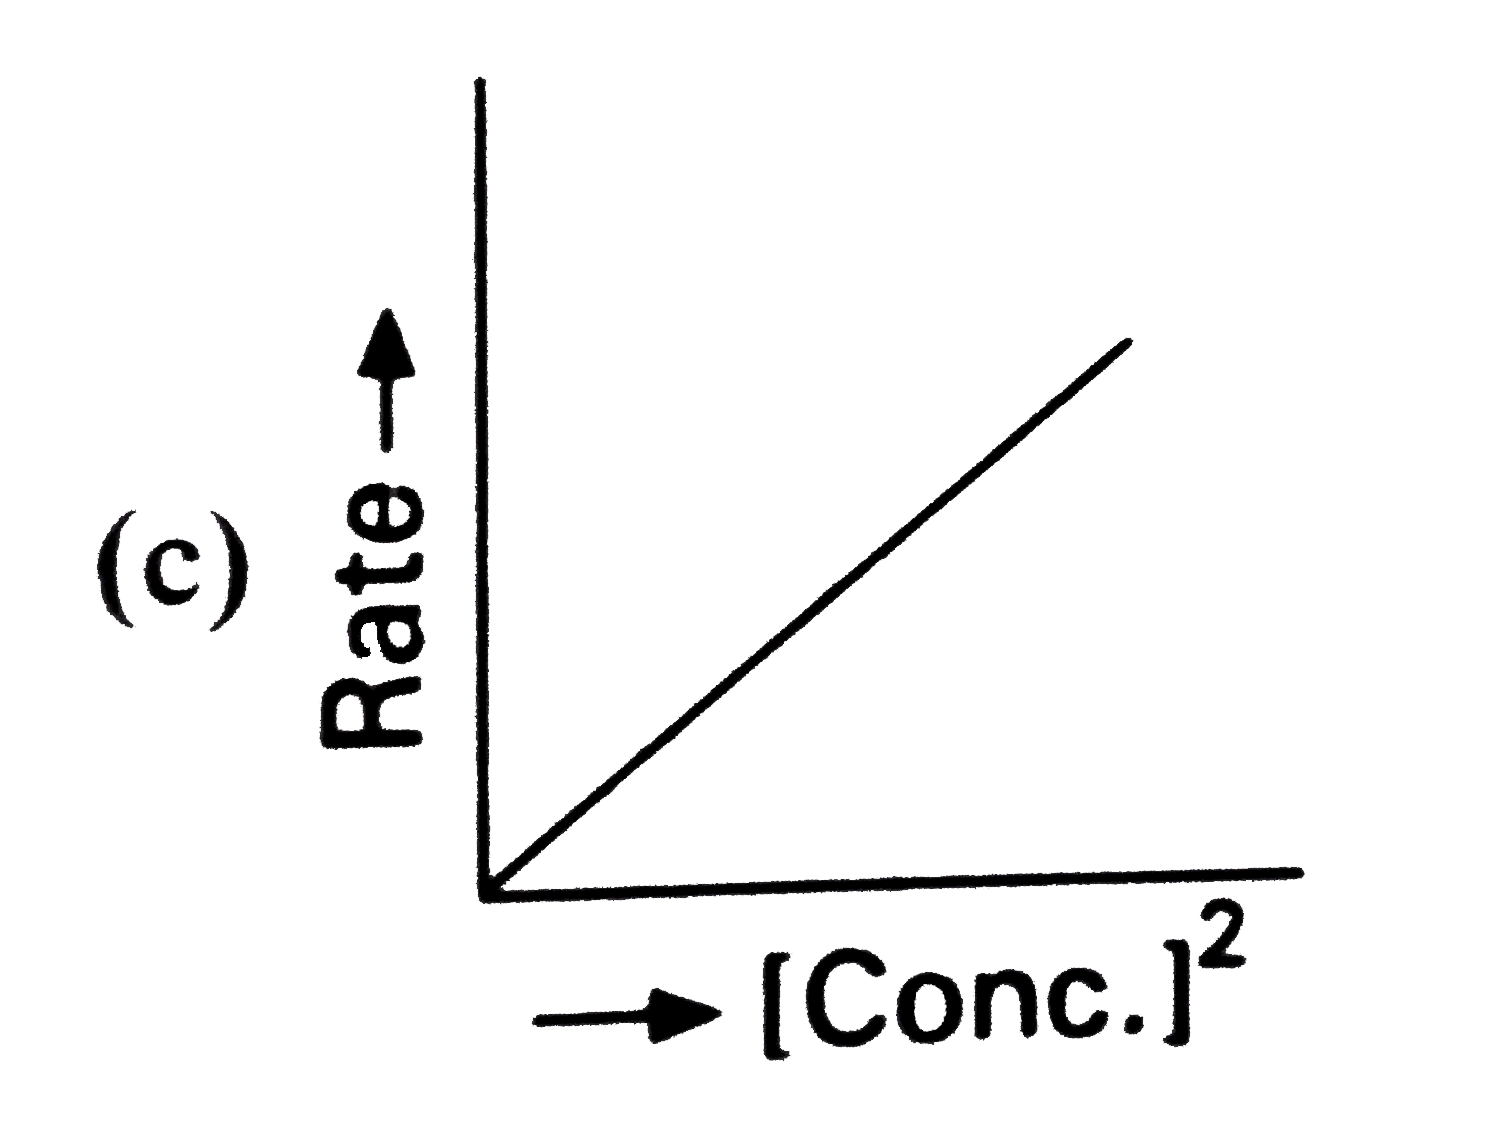 D
D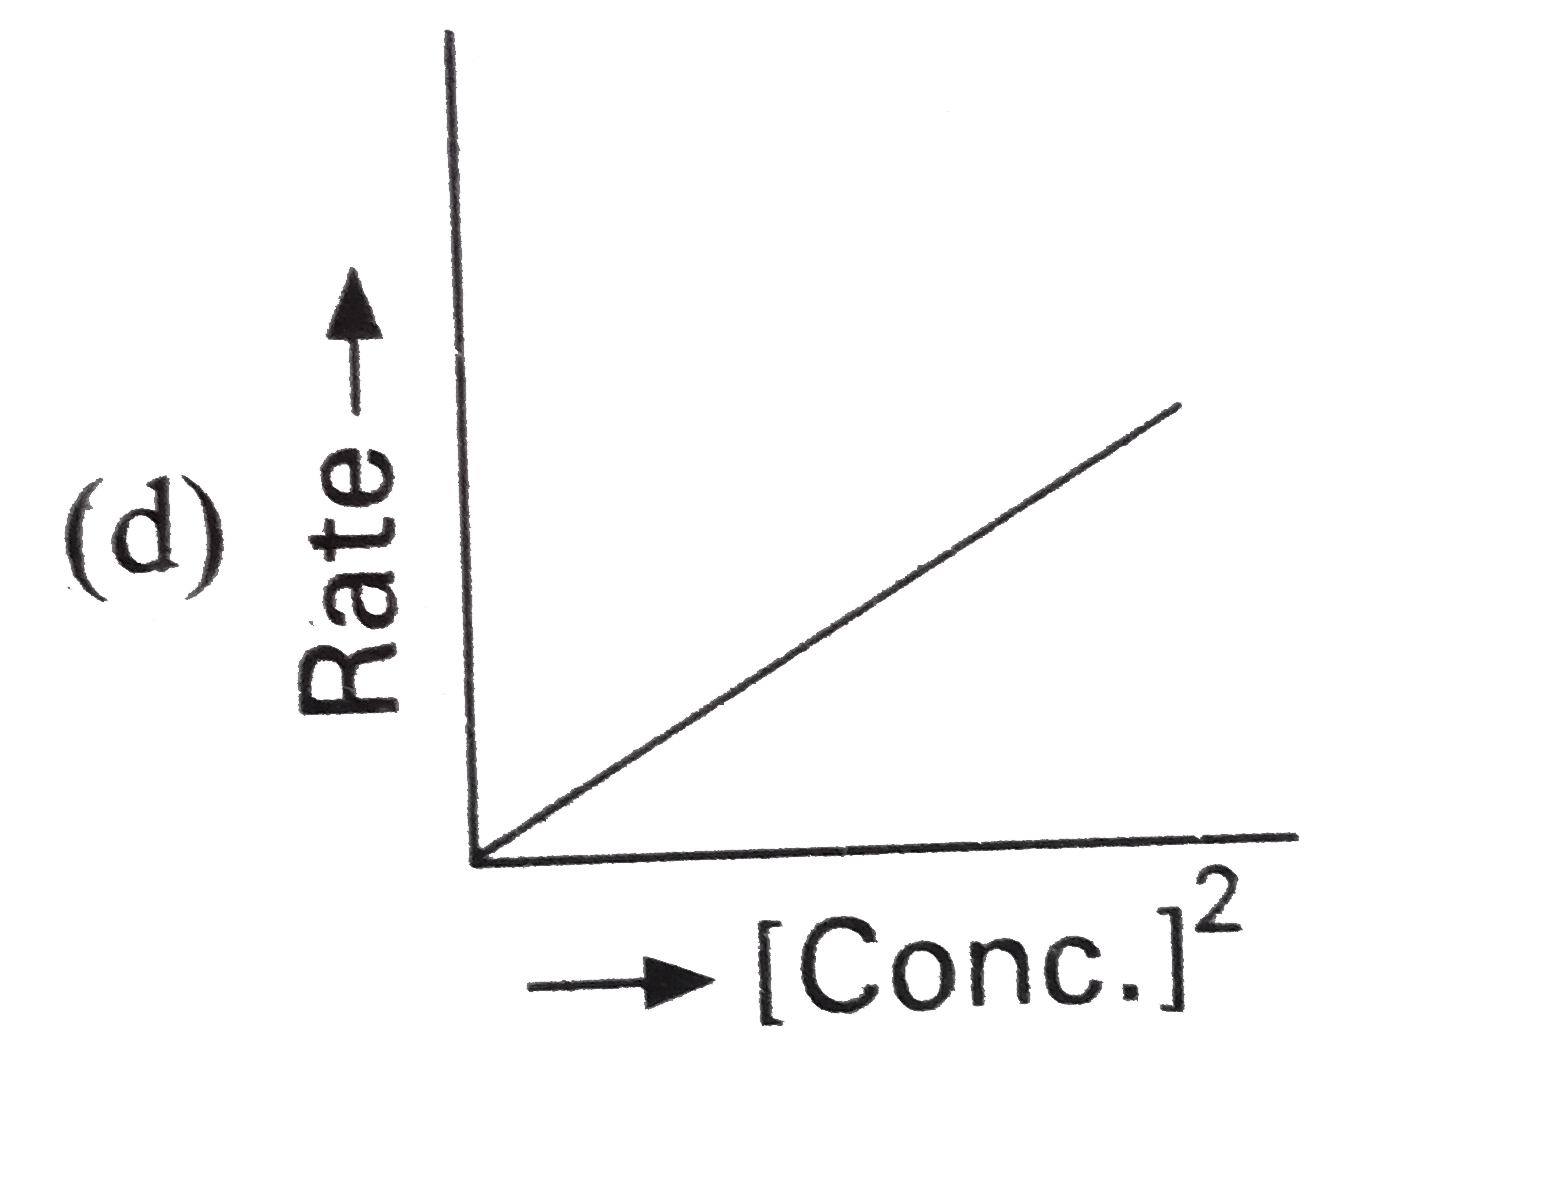
Which of the following graphs represents zero order if
A→P
At t=0⇒[A]0
At t=t⇒[A]tA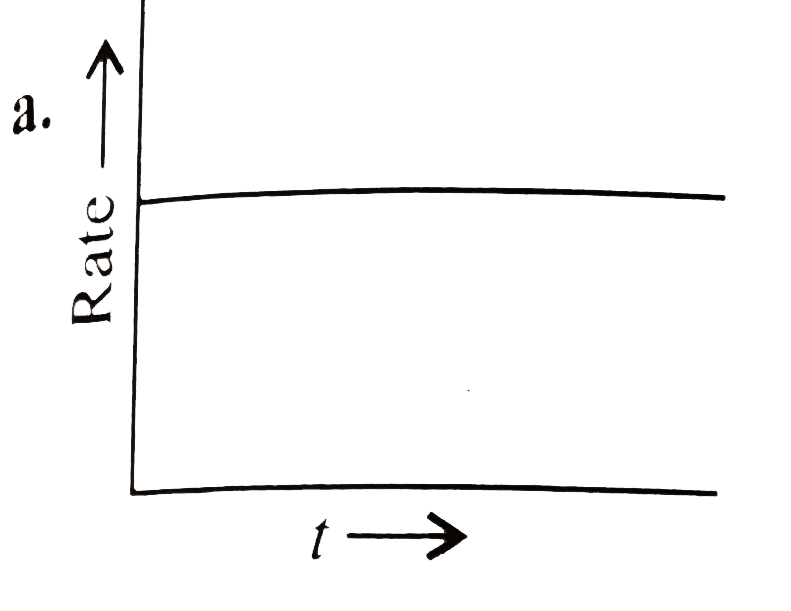 B
B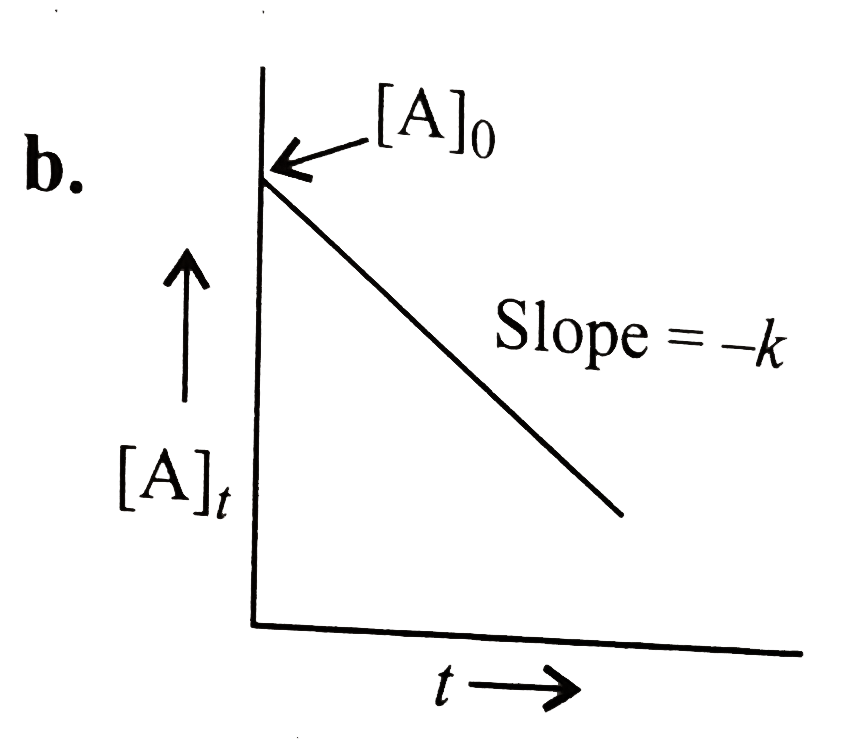 C
C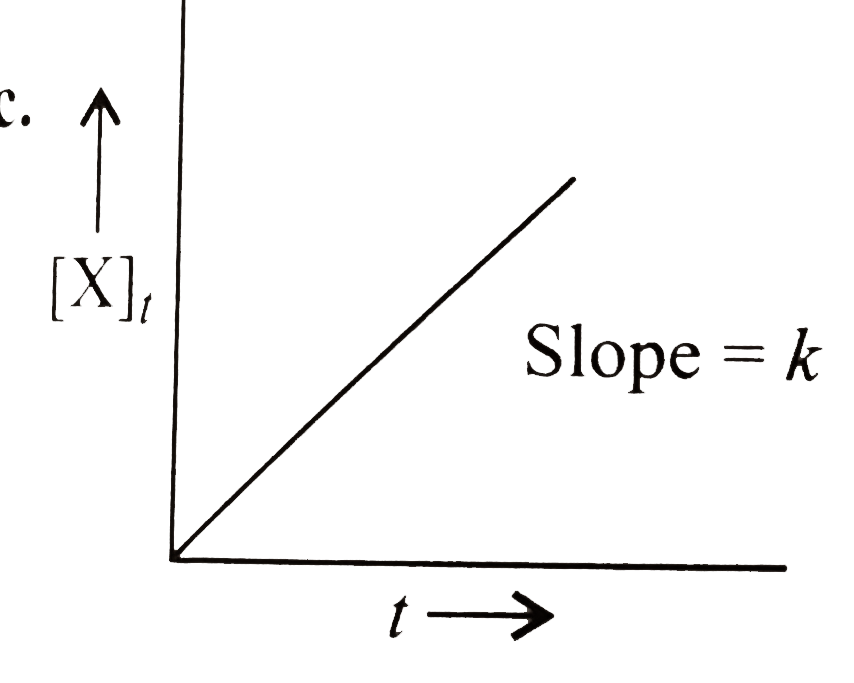 D
D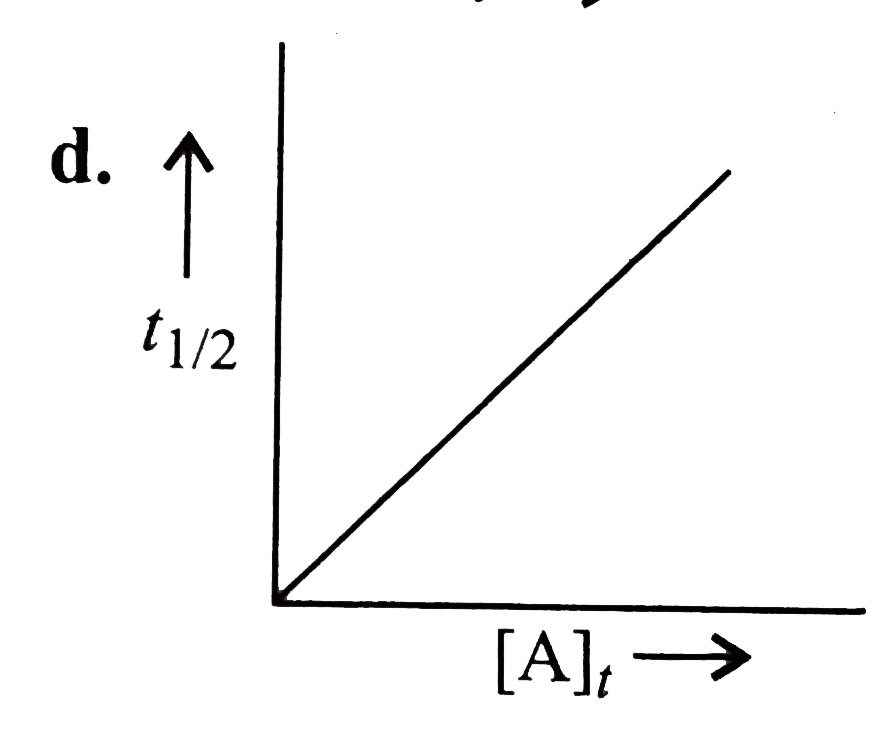
Which of the following curve represent zero order reaction of A→ products ?
A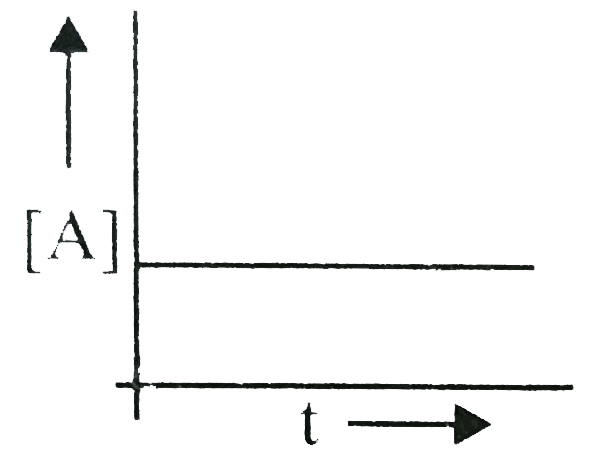 B
B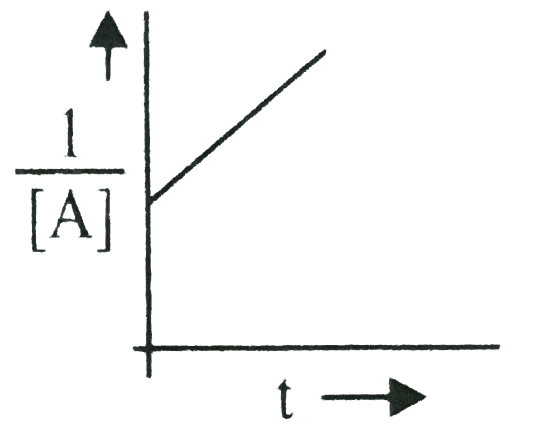 C
C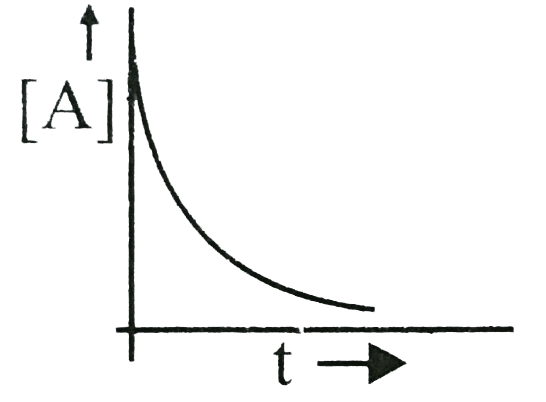 D
D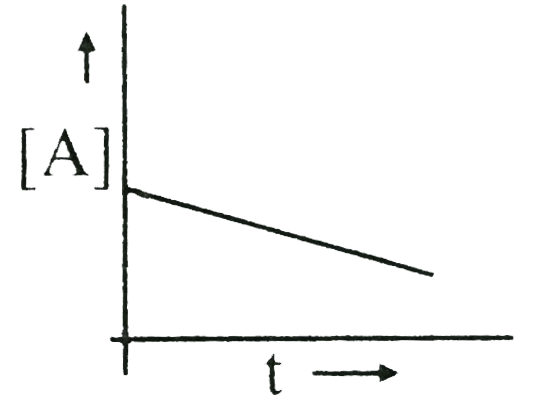
Which of the following graphs represents a first order reaction ?
View SolutionWhich graph is diagnostic of an irreversible second order reaction A→B?
View SolutionWhich of the following curves represent(s) a zero-order reaction?
View SolutionIn the following gaseous phase first order reaction
A(g)→2B(g)+C(g)
initial pressure was found to be 400 mm of Hg and it changed to 1000 mm of Hg after 20min. Then
View SolutionWhich of the following curves represents a zero order reaction ? [(a−x) =reactant concn.]
View Solution
