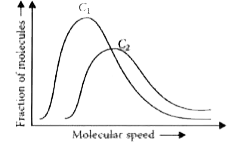
The distribution of molecular kinetic energy at two temperature is as shown in the following graph:

Which is the following concluison is/are correct?
The number of molecules with energy E or greater is proportional to the shaded area for each temperature
The number of molecules with energy Ea or less is proportional to the shaded area for each temperatures
The number of molecules with energy Ea is the mean of all temperatures
The graph is not according to the Maxwell-Boltzmann energy distribution law
The correct Answer is:A
It is fact
Topper's Solved these Questions
- CHEMICAL KINETICSBOOK - A2ZCHAPTER - CHEMICAL KINETICSEXERCISE - Parallel Reaction, Consecutive Reaction, Special Cases Of First-Order Reactions
25 Videos
- CHEMICAL KINETICSBOOK - A2ZCHAPTER - CHEMICAL KINETICSEXERCISE - Section B - Assertion Reasoning
21 Videos
- CHEMICAL KINETICSBOOK - A2ZCHAPTER - CHEMICAL KINETICSEXERCISE - Initial Rate Method And Ostwaid Method
18 Videos
- BIOMOLECULESBOOK - A2ZCHAPTER - BIOMOLECULESEXERCISE - Section D - Chapter End Test
30 Videos
- COORDINATION COMPOUNDSBOOK - A2ZCHAPTER - COORDINATION COMPOUNDSEXERCISE - Section D - Chapter End Test
30 Videos
Similar Questions
Knowledge Check
Which of the following graphs is/are correct.
A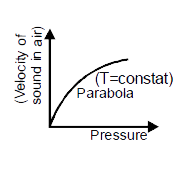 B
B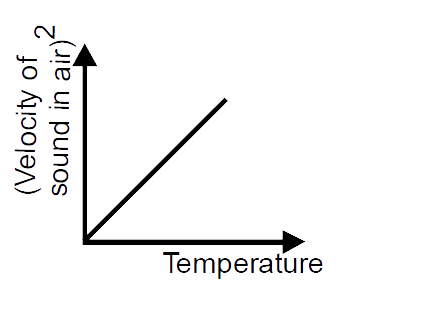 C
C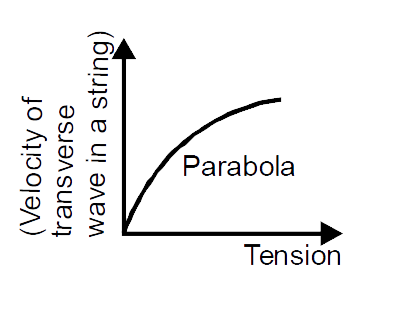 D
D
Which of the following graphs are correct ?
A B
B C
C D
D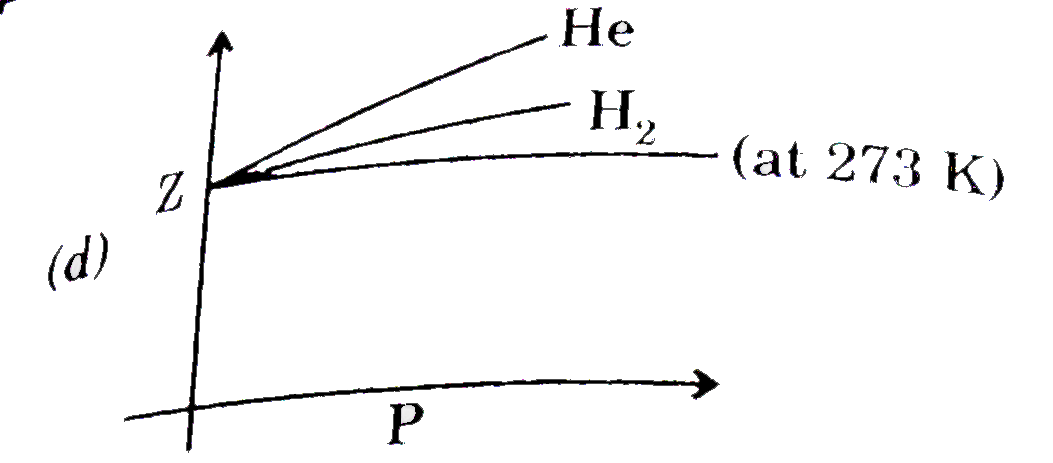
Which of the following graph is correct?
A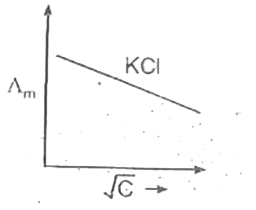 B
B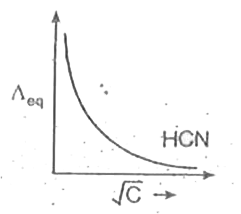 C
C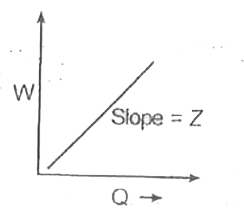 DAll of these
Which of the following graph is correct
View SolutionWhich of the following doesn't have kinetic energy?
View SolutionFor the chemical process energies are plotted in graph.
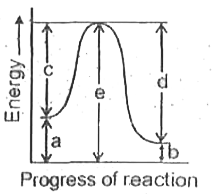
Which of the following is correct ?
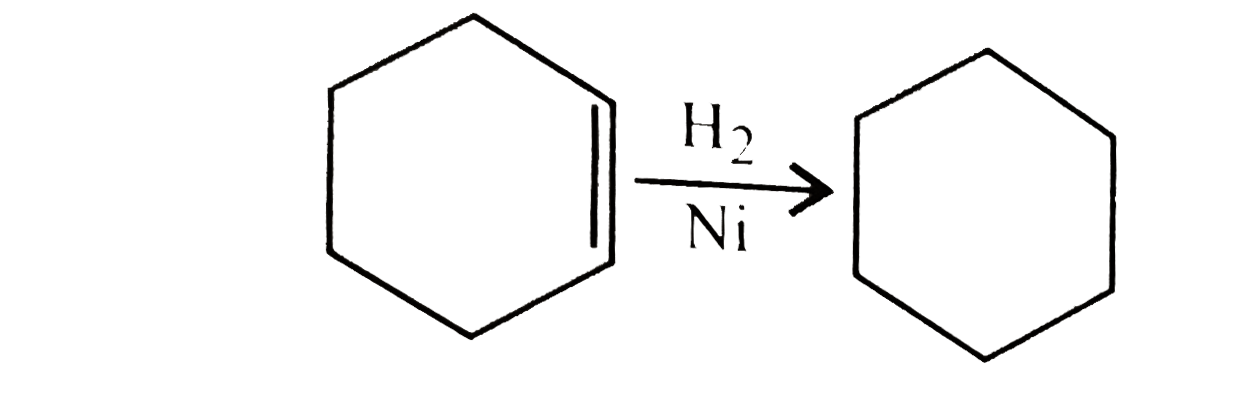
View SolutionWhich of the following is correct graph for the reaction?
View SolutionThe spatial distribution of the electric field due to charges (A,B) is shown in figure. Which of the following statements is correct?

View Solution

