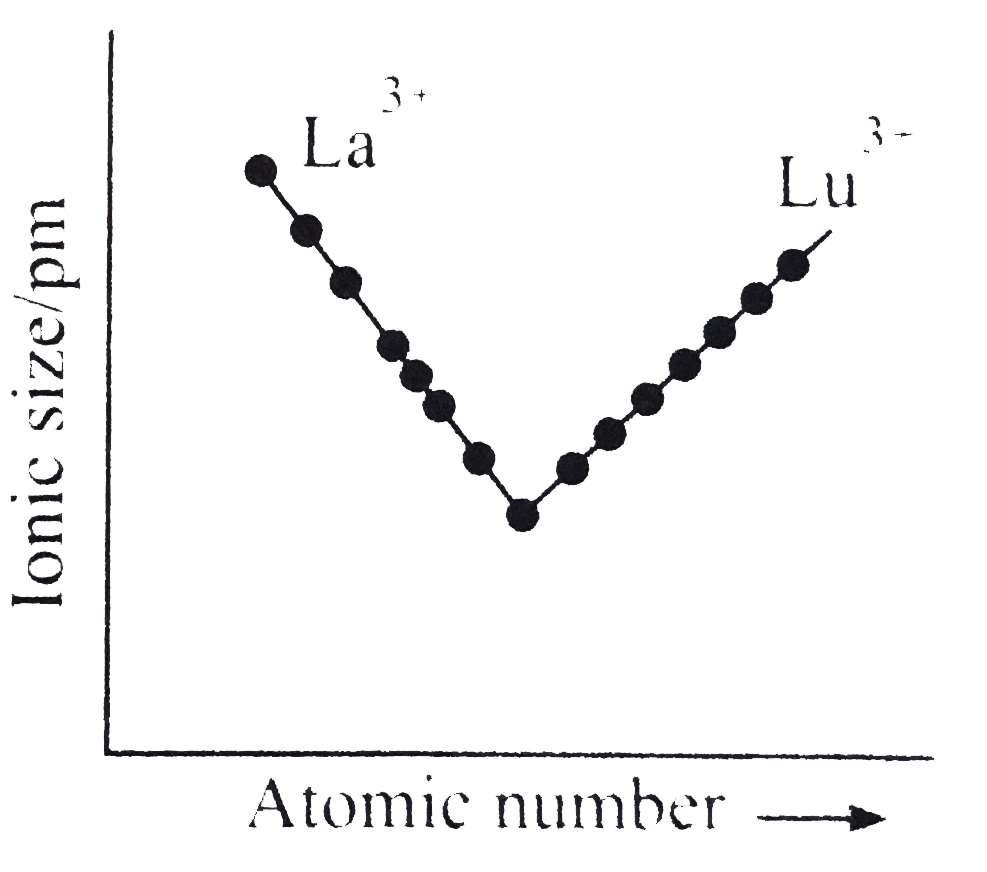
Which of the following graphs shown correct trends in the size of +3 ions of lanthanides?
A

B
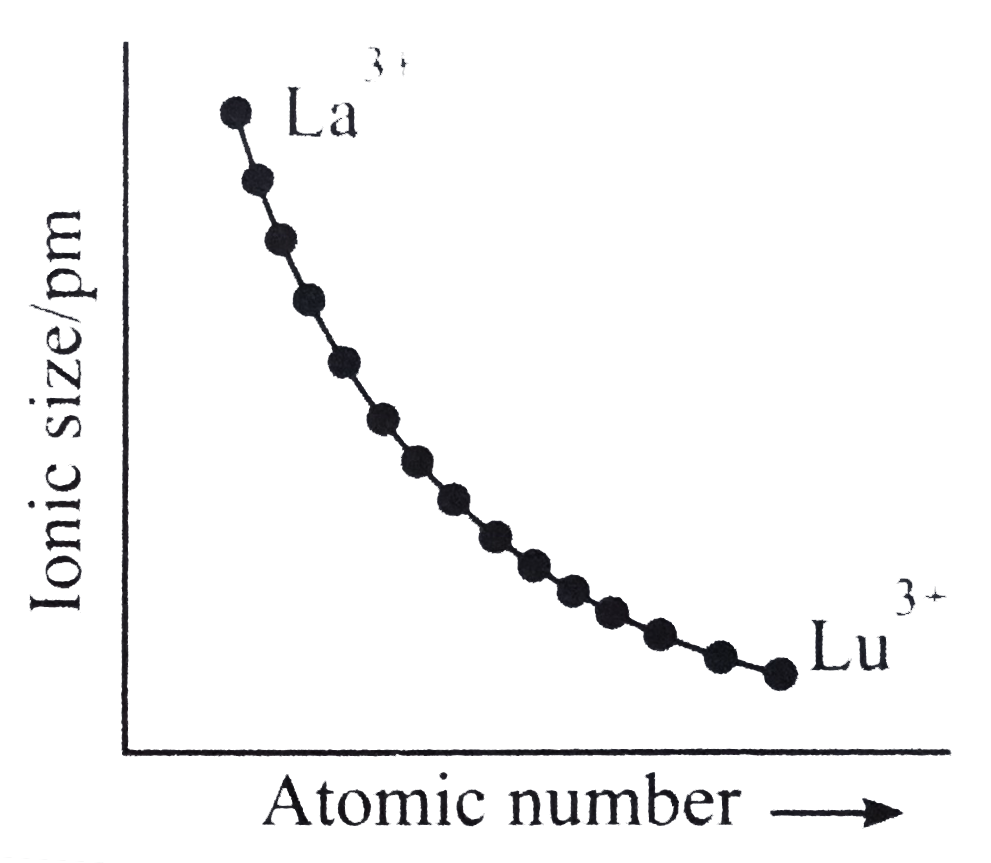
C

D
Video Solution
Text Solution
The correct Answer is:B
On increaseing to atomic number of lanthanide is regular decrease due to poor shielding of 4f electrons (lanthanide contraction).
|
Updated on:21/07/2023
Topper's Solved these Questions
- BOOK - A2ZCHAPTER - THE D AND F BLOCK ELEMENTSEXERCISE - Section B - Assertion Reasoning42videos
THE D AND F BLOCK ELEMENTS
- BOOK - A2ZCHAPTER - THE D AND F BLOCK ELEMENTSEXERCISE - AIPMT/NEET Questions31videos
THE D AND F BLOCK ELEMENTS
- BOOK - A2ZCHAPTER - THE D AND F BLOCK ELEMENTSEXERCISE - KMnO_4 And K_2Cr_2O_551videos
THE D AND F BLOCK ELEMENTS
- BOOK - A2ZCHAPTER - SURFACE CHEMISTRYEXERCISE - Section D - Chapter End Test30videos
SURFACE CHEMISTRY
Similar Questions
Knowledge Check
- Question 1 - Select One or More
Which of the following graphs are correct ?
A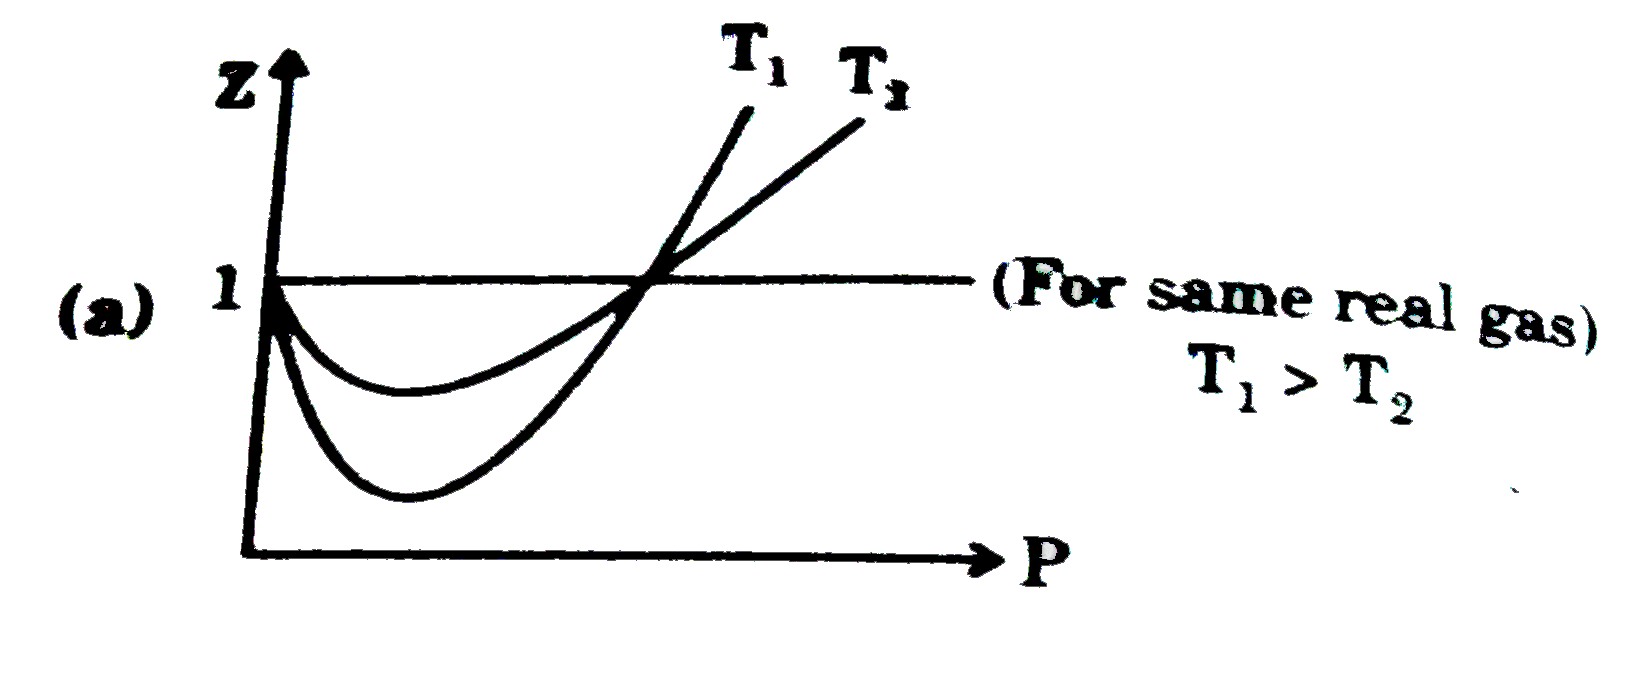 B
B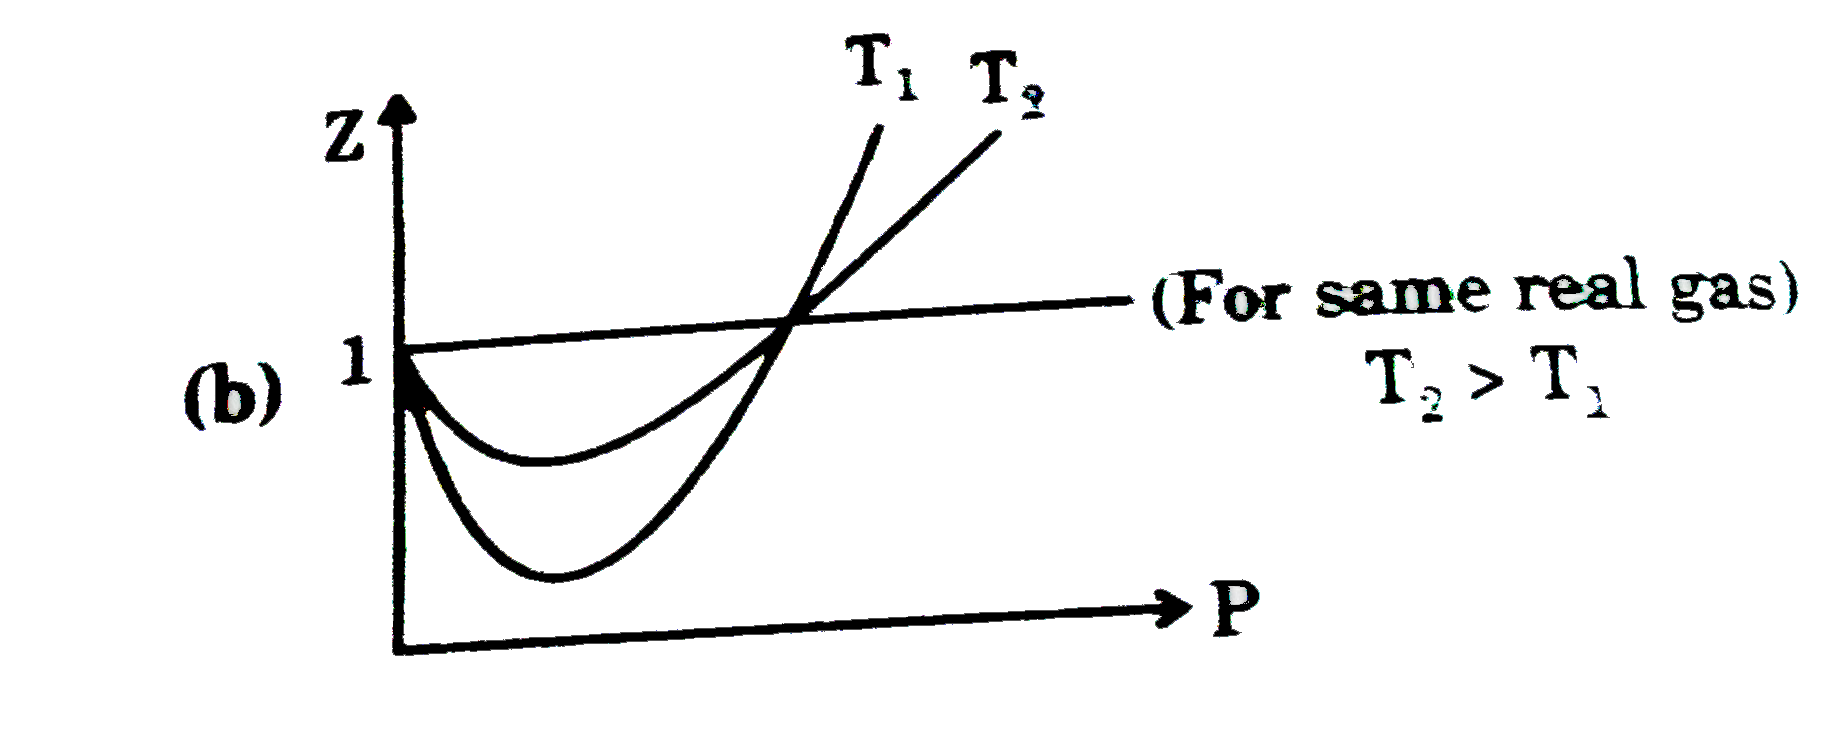 C
C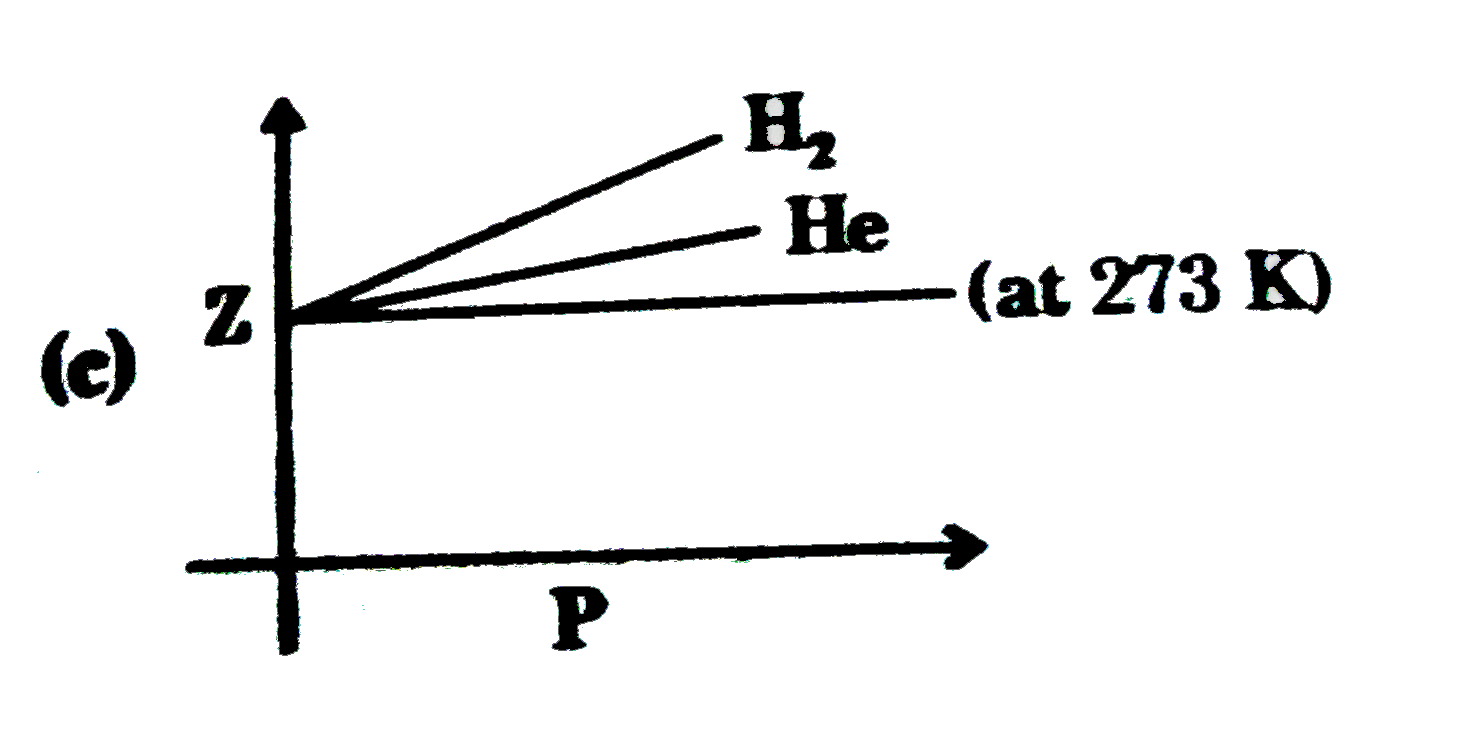 D
D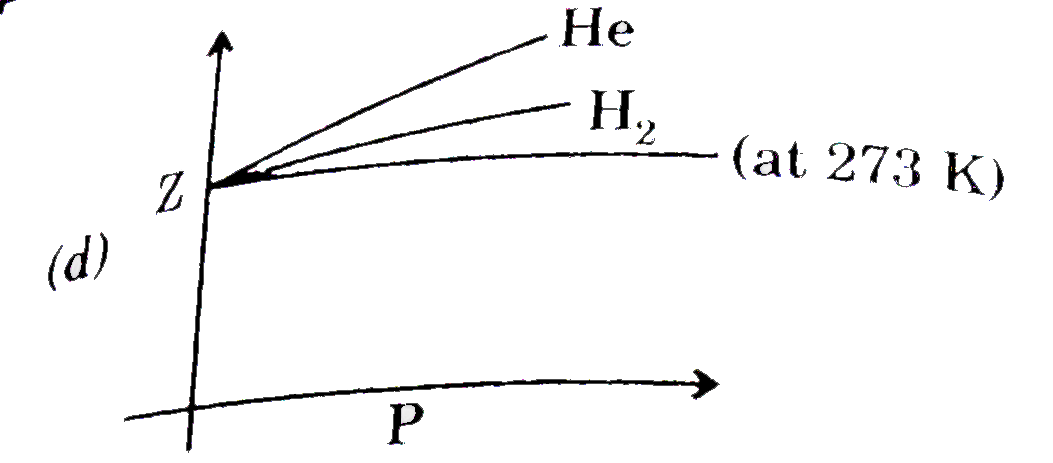
- Question 2 - Select One
Which of the following graph is correct?
A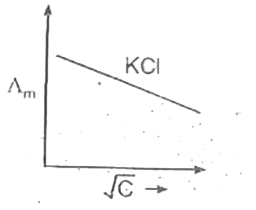 B
B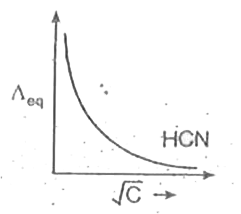 C
C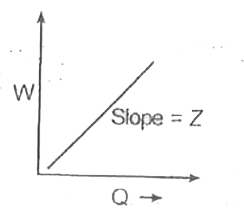 DAll of these
 - Question 3 - Select One
Which of the following graph is correct
A_2019_CBT6_E01_019_O01.png) B
B_2019_CBT6_E01_019_O02.png) C
C_2019_CBT6_E01_019_O03.png) D
D_2019_CBT6_E01_019_O04.png)
Which of the following trend is/are correct?
View SolutionWhich of the following orders is correct for the size ?
View SolutionWhich of the following are shown on the globe in their true size?
View SolutionWhich one of the following is correct increasing order of size ?
View SolutionWhich of the following is not correct in the context of the NO−3 ions?
View Solution

