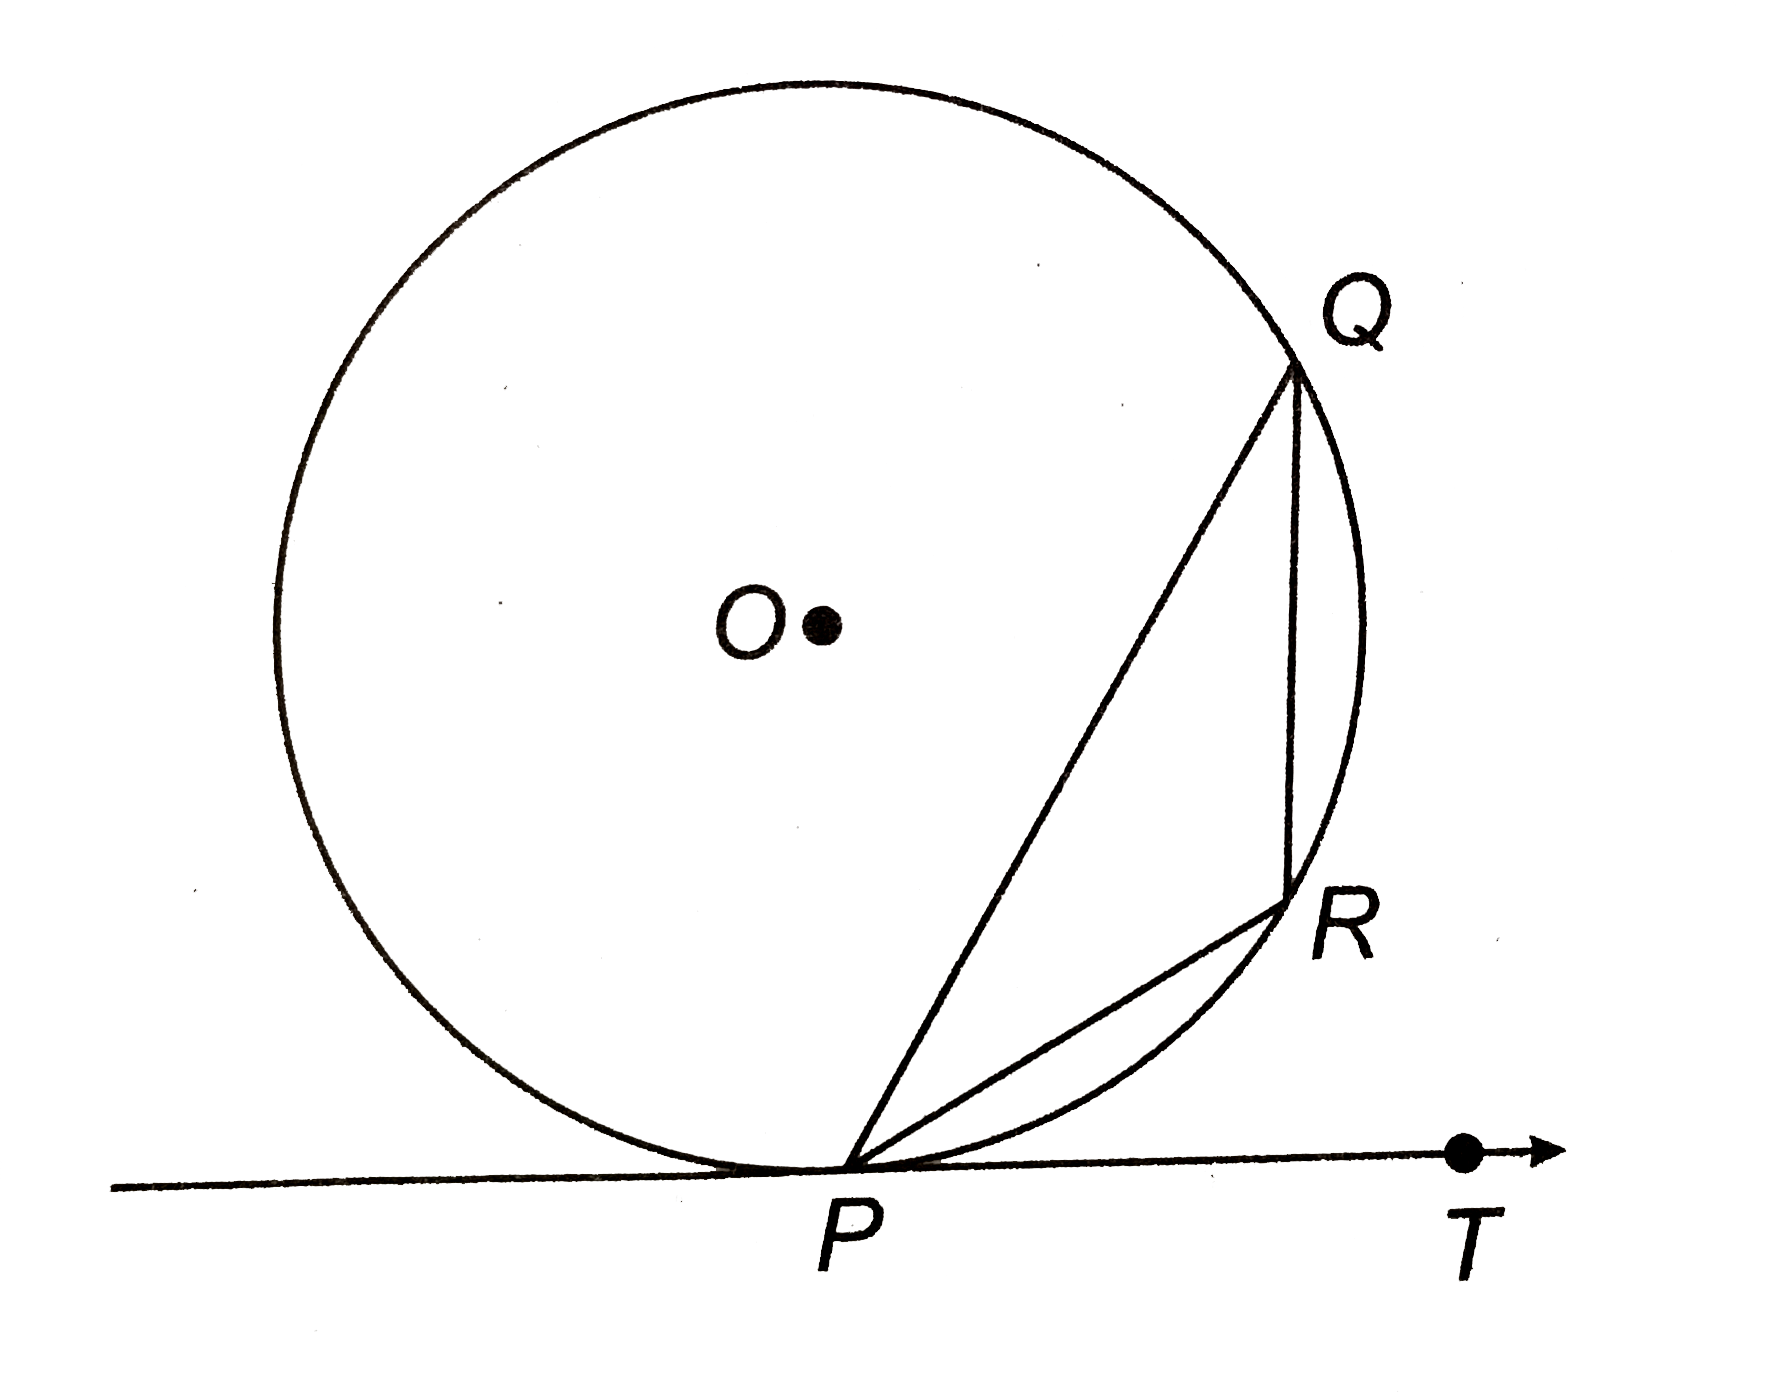
संलग्न चित्र में, PQ वृत्त की जीवा और PT बिन्दु P पर स्पर्श रेखा इस प्रकार है कि ∠QPT=60∘ है। ∠PRQ ज्ञात कीजिए।

20∘
12∘
120∘
10∘
The correct Answer is:C
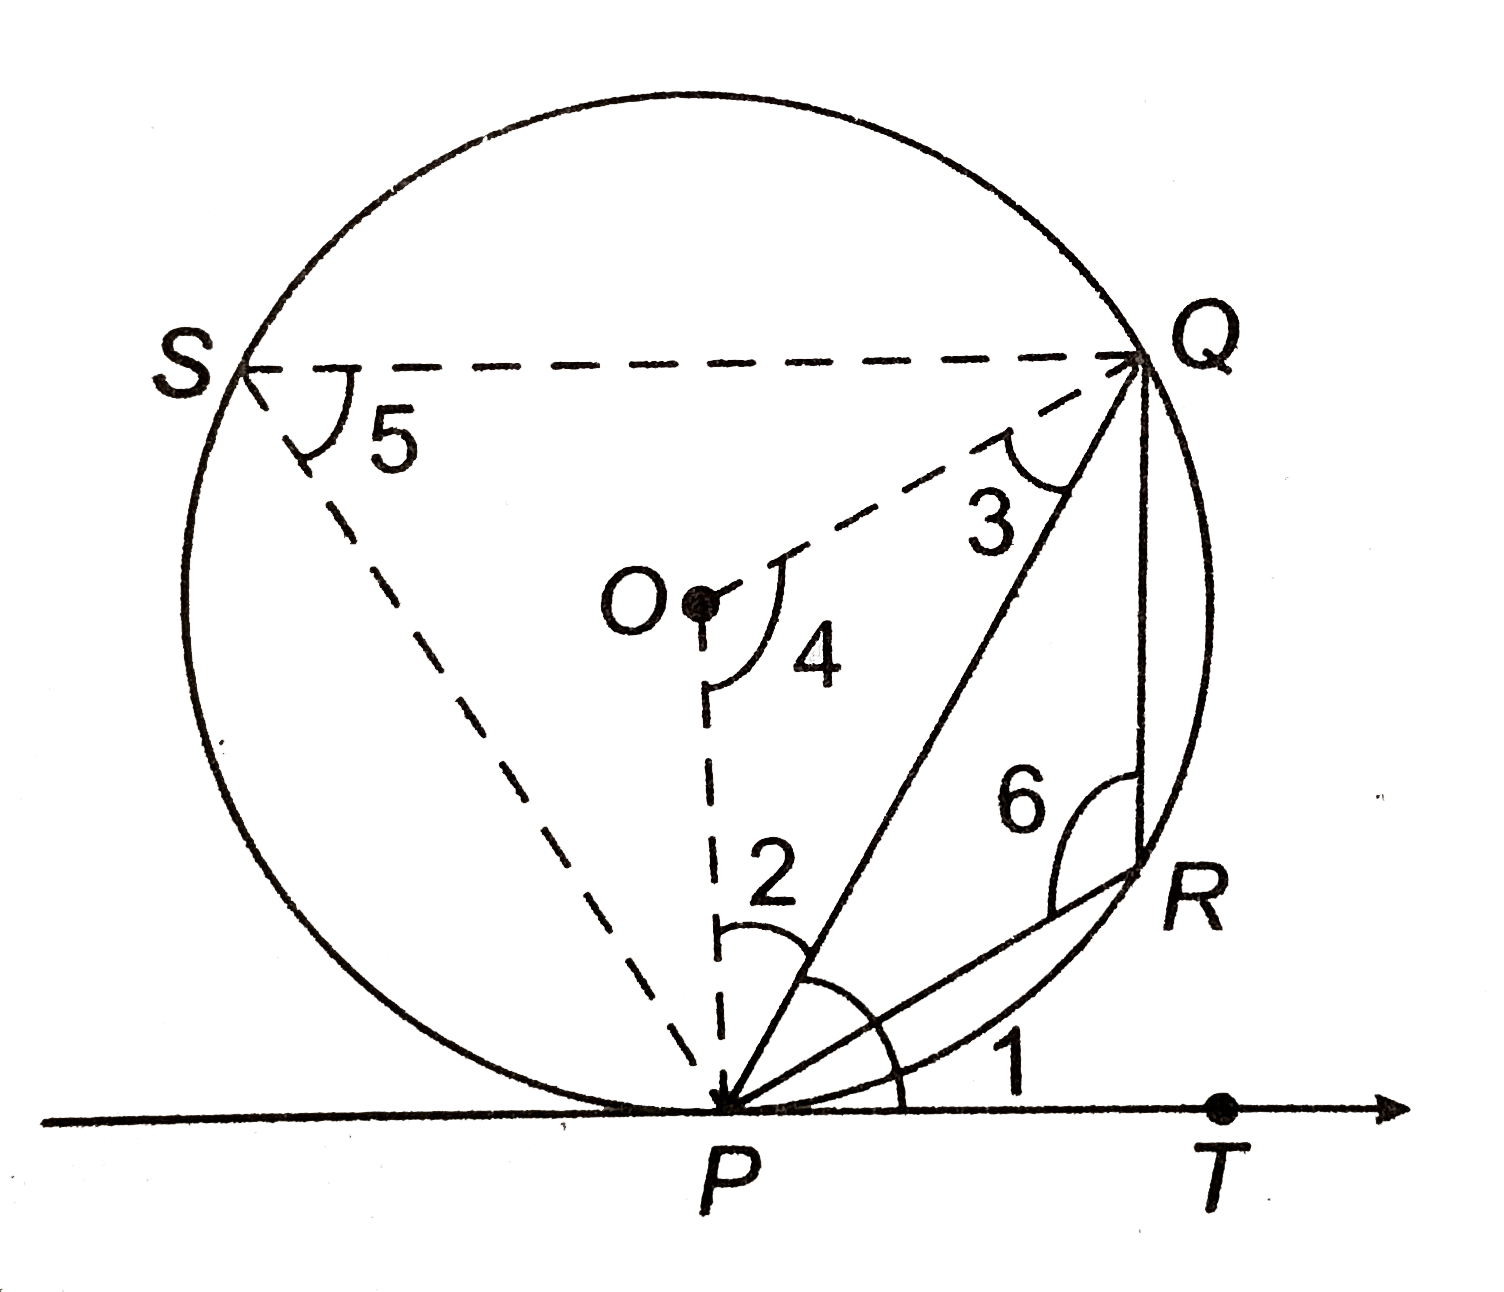
OP और OQ को मिलाया। संगत वृत्तखण्ड में परिधि पर कोई बिन्दु S लिया। SP और SQ को मिलाया।
∵OP⊥PT
(स्पर्श बिन्दु से जाने वाली त्रिज्या स्पर्श रेखा पर लम्ब होती है)

∴∠2+∠1=90∘
⇒∠2+60∘=90∘ (दिया है)
⇒∠2=90∘−60∘=30∘ ....(1)
परन्तु OP=OQ (प्रत्येक त्रिज्या है)
∴∠2=∠3 (समान भुजाओं के सम्मुख कोण बराबर होते है)
अब ΔPOQ,
∠2+∠3+∠4=180∘ (कोण योग गुण) ⇒30∘+30∘+∠4=180∘ [समीकरण (1 ) और (2 ) से]
∴∠5=12×∠4 (∵ किसी चाप द्रारा केन्द्र पर बना कोण शेष परिधि पर बने कोण का दोगुना होता है)
⇒∠5=12×120
∠5=60∘
और ∠5+∠6=180∘ (चक्रीय चतुर्भुज के सम्मुख कोणों का योग)
⇒60∘+∠6=180∘
⇒∠6=∠PRQ=120∘

Topper's Solved these Questions
- BOOK - NOOTAN HINDICHAPTER - वृत्त EXERCISE - प्रश्नावली29videos
वृत्त
- BOOK - NOOTAN HINDICHAPTER - वृत्त EXERCISE - प्रश्नावली 10.14videos
वृत्त
- BOOK - NOOTAN HINDICHAPTER - वास्तविक संख्याएँEXERCISE - विविध प्रश्नावली30videos
वास्तविक संख्याएँ
- BOOK - NOOTAN HINDICHAPTER - वृत्तों से समबन्धित क्षेत्रफल EXERCISE - विविध प्रश्नावली ( बहुविकल्पीय प्रश्न )14videos
वृत्तों से समबन्धित क्षेत्रफल
Similar Questions
एक वृत्त की त्रिज्या 8 सेमी है। इसके केन्द्र से 10 सेमी की दुरी पर स्थित बिन्दु से वृत्त पर खींची स्पर्श रेखा की लम्बाई ज्ञात कीजिए।
01:37View Solutionएक वृत्त की कितनी स्पर्श रेखाएँ हो सकती है?
06:07View Solutionयूक्लिड विभाजन प्रमेयिका बताइए।
02:11View Solutionयदि R1 और R2 त्रिज्याओं वाले दो वृत्तों की परिधियों का योग R त्रिज्या के वृत्त की परिधि के बराबर है , तो :
01:31View SolutionHow many lines of symmetry does the above figure have ?
02:45View SolutionWhich of the following are correct chain isomers of butane ? (i)
02:17View SolutionDetermine the point of symmetry of a regular hexagon.
05:41View SolutionDtermine the images of the following figure about the given line :
02:21View SolutionMatch the following Column A to Column B
 02:10View Solution
Match the following Column A to Column B
 02:17View Solution
Match the following Column A to Column B
 02:10View Solution
Find the area of the figure given below.
 04:23View Solution
The inequation represented by the graph given below is :
03:02View SolutionThe inequation that best describes the graph given below is _________
01:49View SolutionThe inequation that best describes the following graph is _________
05:04View SolutionWhich inequations represent the shaded region in the given figure
01:44View Solution

