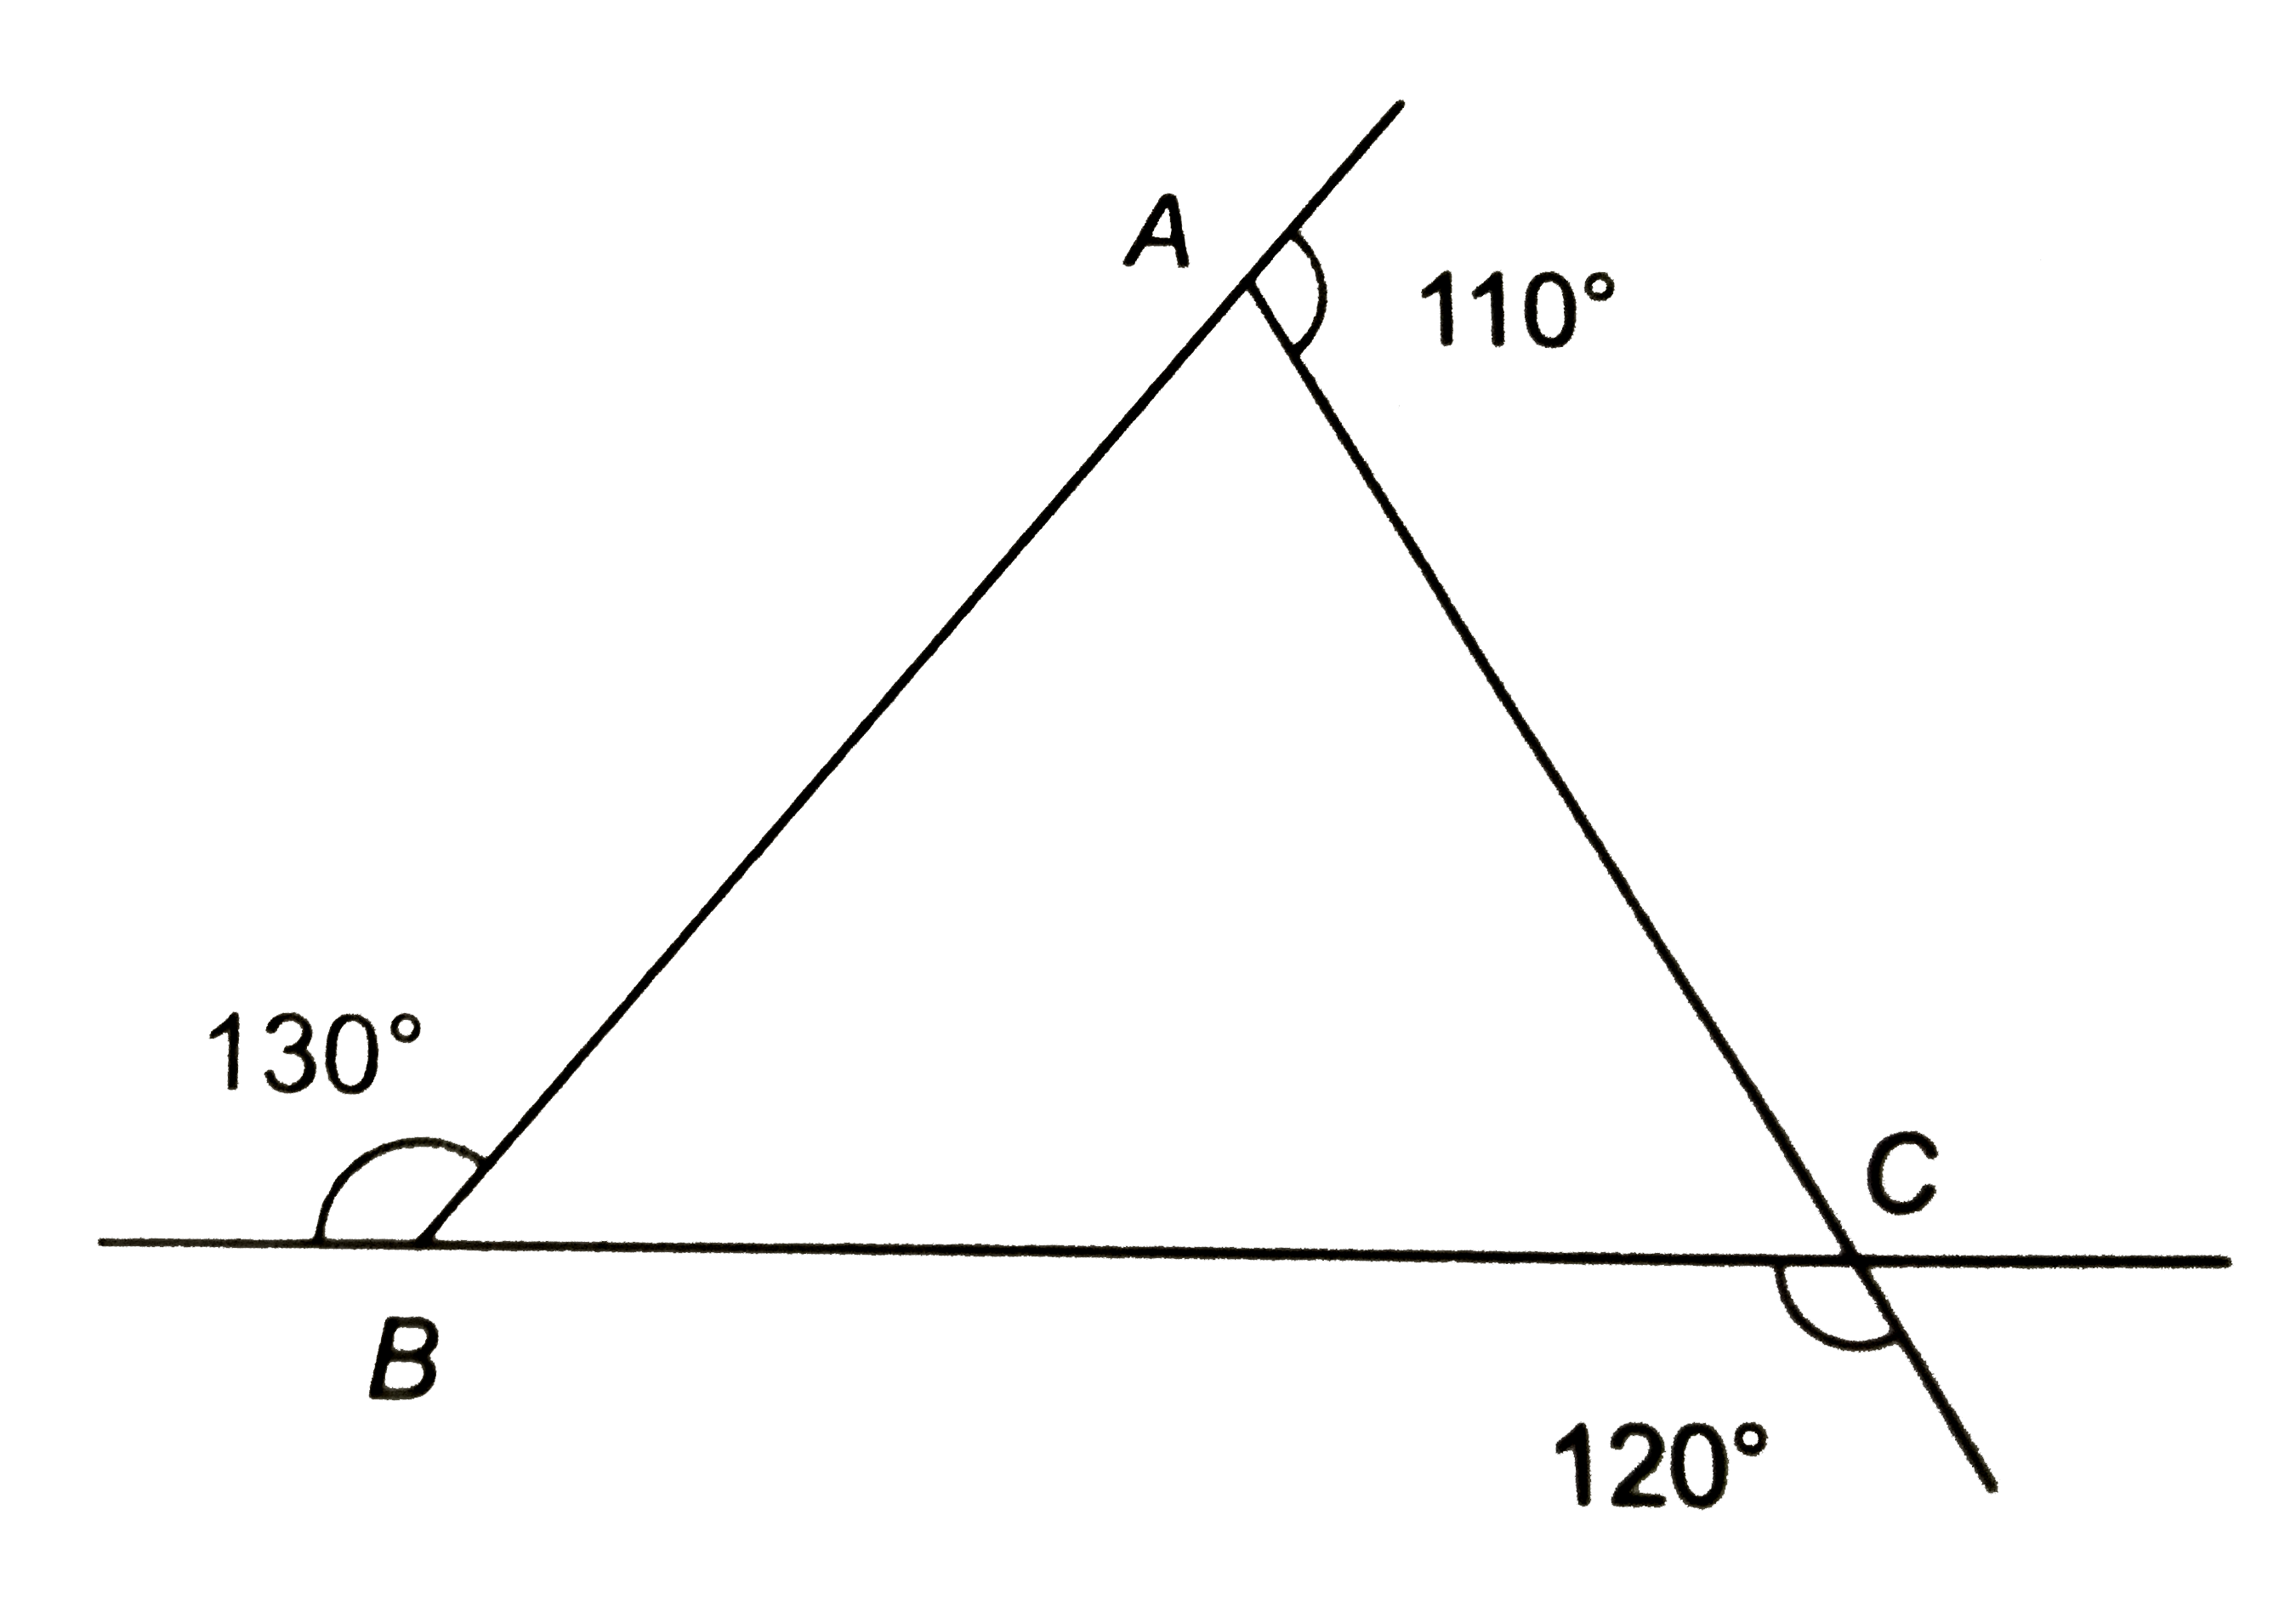
संलग्न चित्र में, ΔABC की भुजाओं को उनकी लम्बाइयों को घटते क्रम में लिखिये। 
The correct Answer is:BC, AB, AC
Step by step video & image solution for संलग्न चित्र में, DeltaABC की भुजाओं को उनकी लम्बाइयों को घटते क्रम में लिखिये। by Maths experts to help you in doubts & scoring excellent marks in Class 9 exams.
Updated on:21/07/2023Topper's Solved these Questions
- त्रिभुज BOOK - NOOTAN HINDICHAPTER - त्रिभुज EXERCISE - प्रश्नावली 7.1
8 Videos
- त्रिभुज BOOK - NOOTAN HINDICHAPTER - त्रिभुज EXERCISE - प्रश्नावली 7.2
8 Videos
- त्रिभुज BOOK - NOOTAN HINDICHAPTER - त्रिभुज EXERCISE - प्रश्नावली 7A
30 Videos
- चतुर्भुजBOOK - NOOTAN HINDICHAPTER - चतुर्भुजEXERCISE - विविध प्रश्नावली
24 Videos
- दो चरों वाले रैखिक समीकरण BOOK - NOOTAN HINDICHAPTER - दो चरों वाले रैखिक समीकरण EXERCISE - विविध प्रश्नावली
12 Videos
Similar Questions
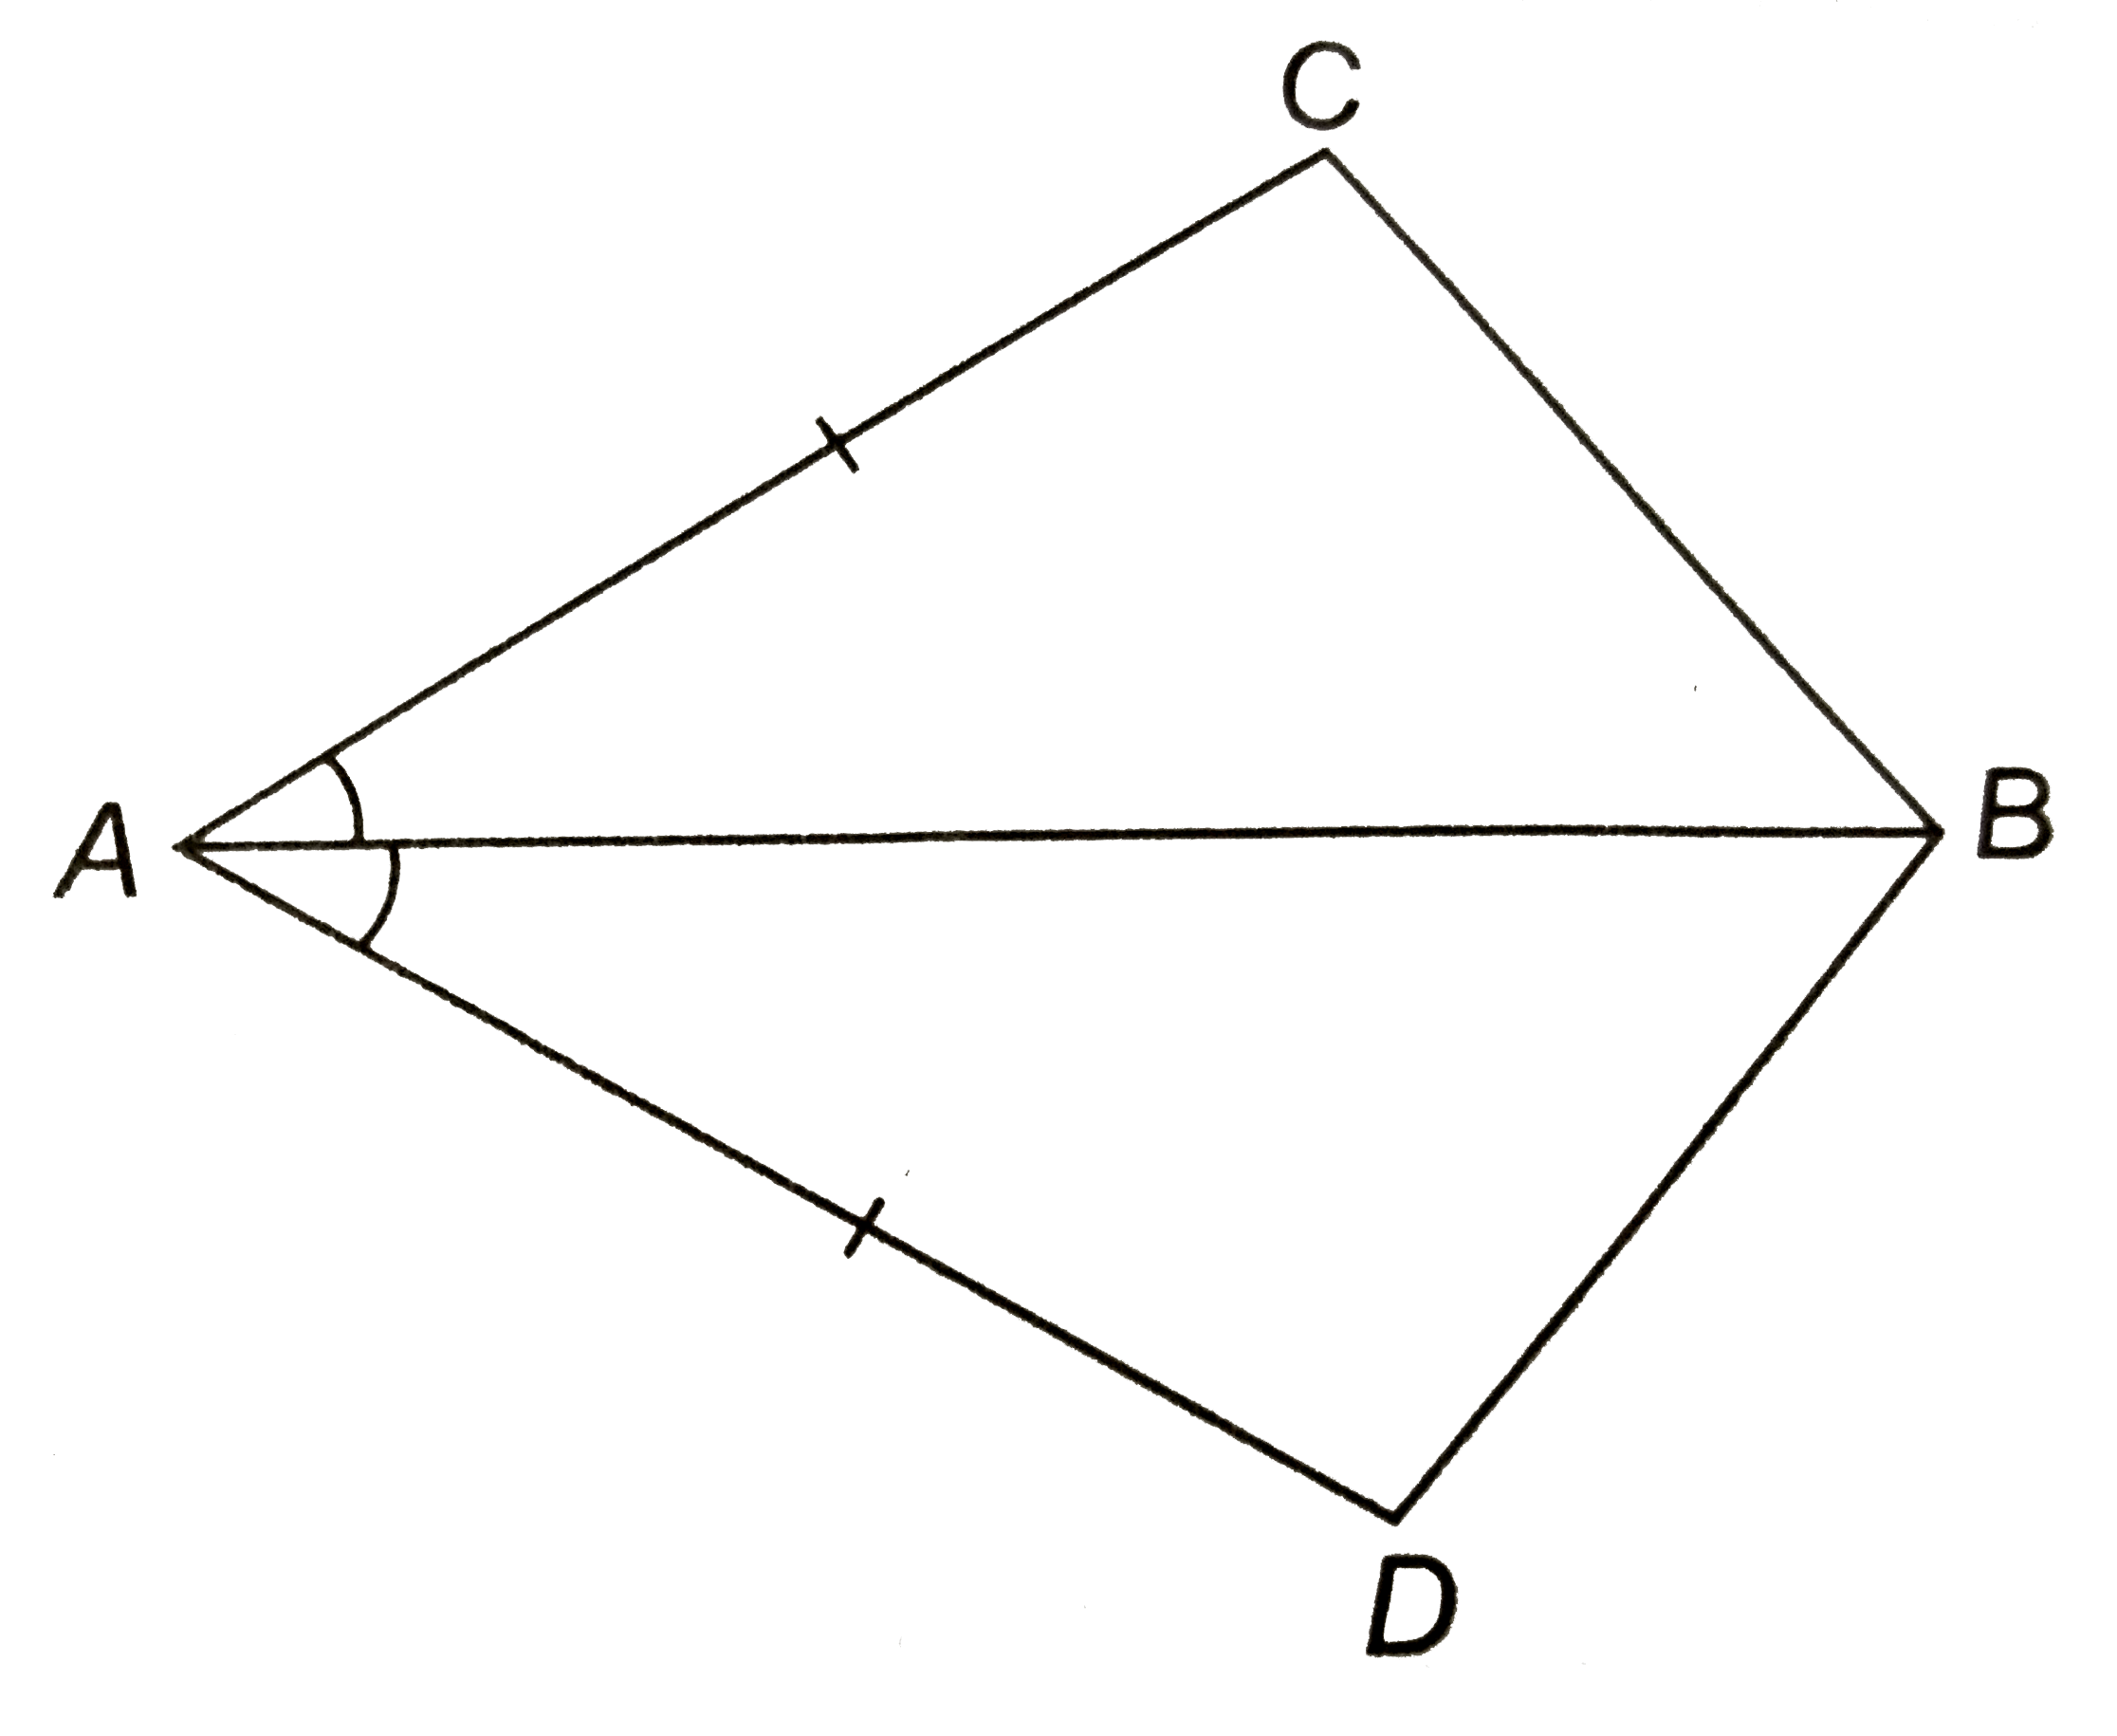
चतुर्भुज ABCD में, AC =AD है और AB कोण A को समद्विभाजित करता है (देखिये आकृति )। दर्शाइए कि ΔABC≅ΔABD है।
BC और BD के बारे में आप क्या कह सकते है ?

View Solutionएक समद्विबाहु त्रिभुज ABC में, जिसमे AB = AC है, ∠A और ∠C के समद्विभाजक परस्पर बिन्दु O पर प्रतिच्छेद करते है। A और O को जोड़िए। दर्शाइए कि
(i) OB= OC
(ii) AO कोण A को समद्विभाजित करता है।
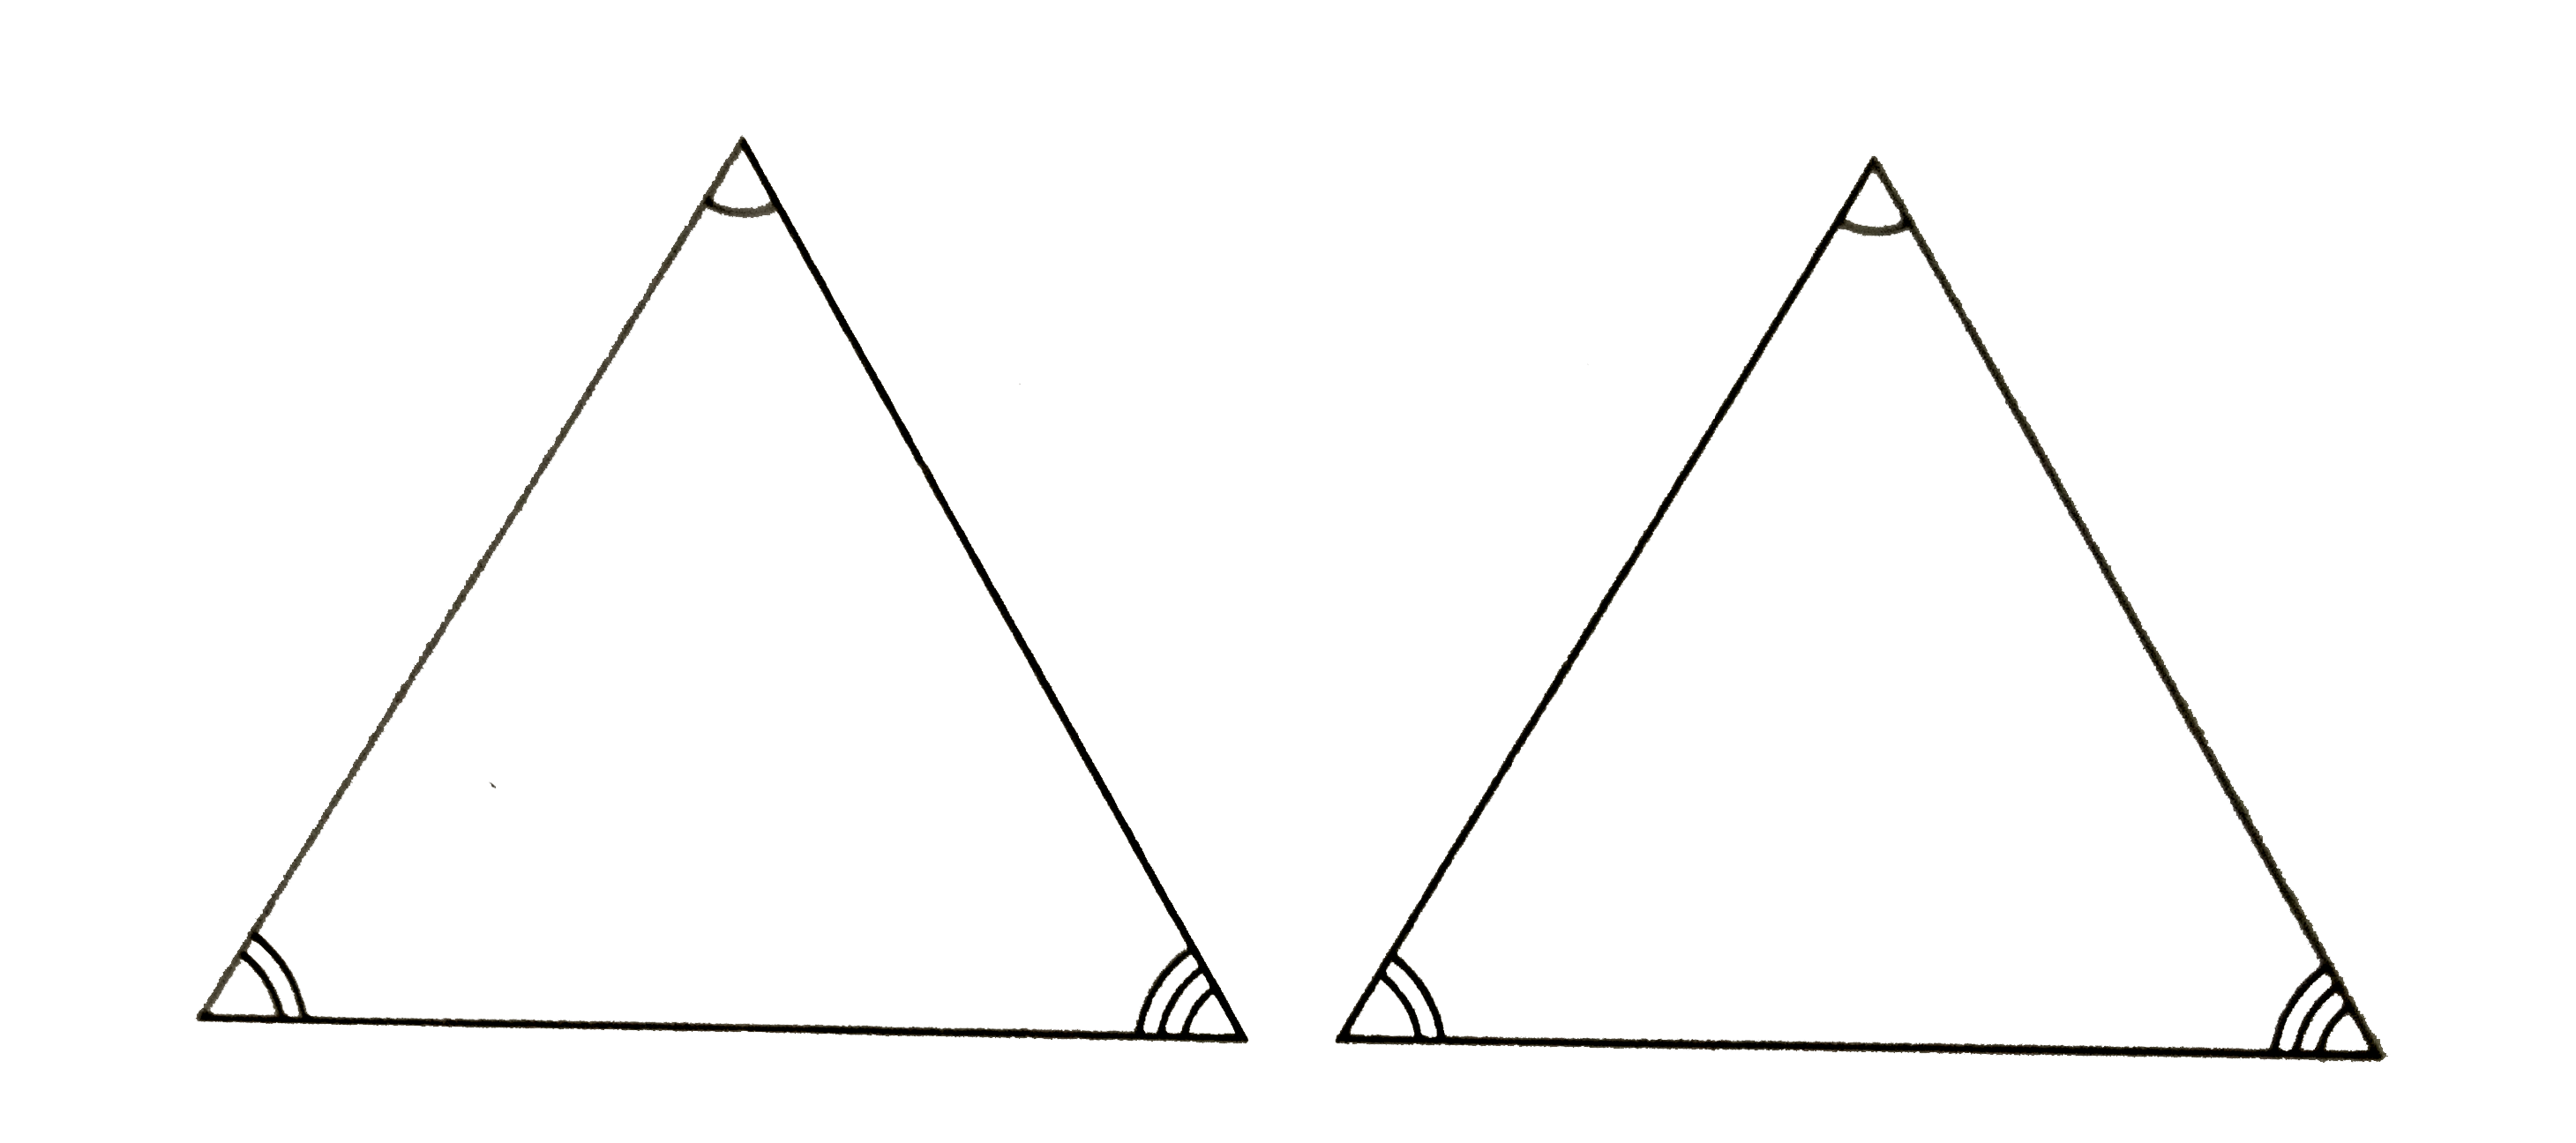
View Solutionनिम्नलिखित में से कौन-से त्रिभुजों के युग्म सर्वांगसम है ? प्रत्येक में सर्वागसमता का प्रतिबन्ध भी बताइए :


View Solutionएक चतुर्भुज के तीन कोण 100∘,98∘,92∘ है। चौथा कोण ज्ञात कीजिए।
View Solutionx अक्ष का समीकरण लिखिय|
View SolutionHow many lines of symmetry does the above figure have ?
View SolutionWhich of the following are correct chain isomers of butane ? (i)
View SolutionDetermine the point of symmetry of a regular hexagon.
View SolutionDtermine the images of the following figure about the given line :
View SolutionMatch the following Column A to Column B

View SolutionMatch the following Column A to Column B

View SolutionMatch the following Column A to Column B

View SolutionFind the area of the figure given below.

View SolutionThe area of the shaded part in the figure given below is ______.

View SolutionThe inequation represented by the graph given below is :
View SolutionThe inequation that best describes the graph given below is _________
View Solution
