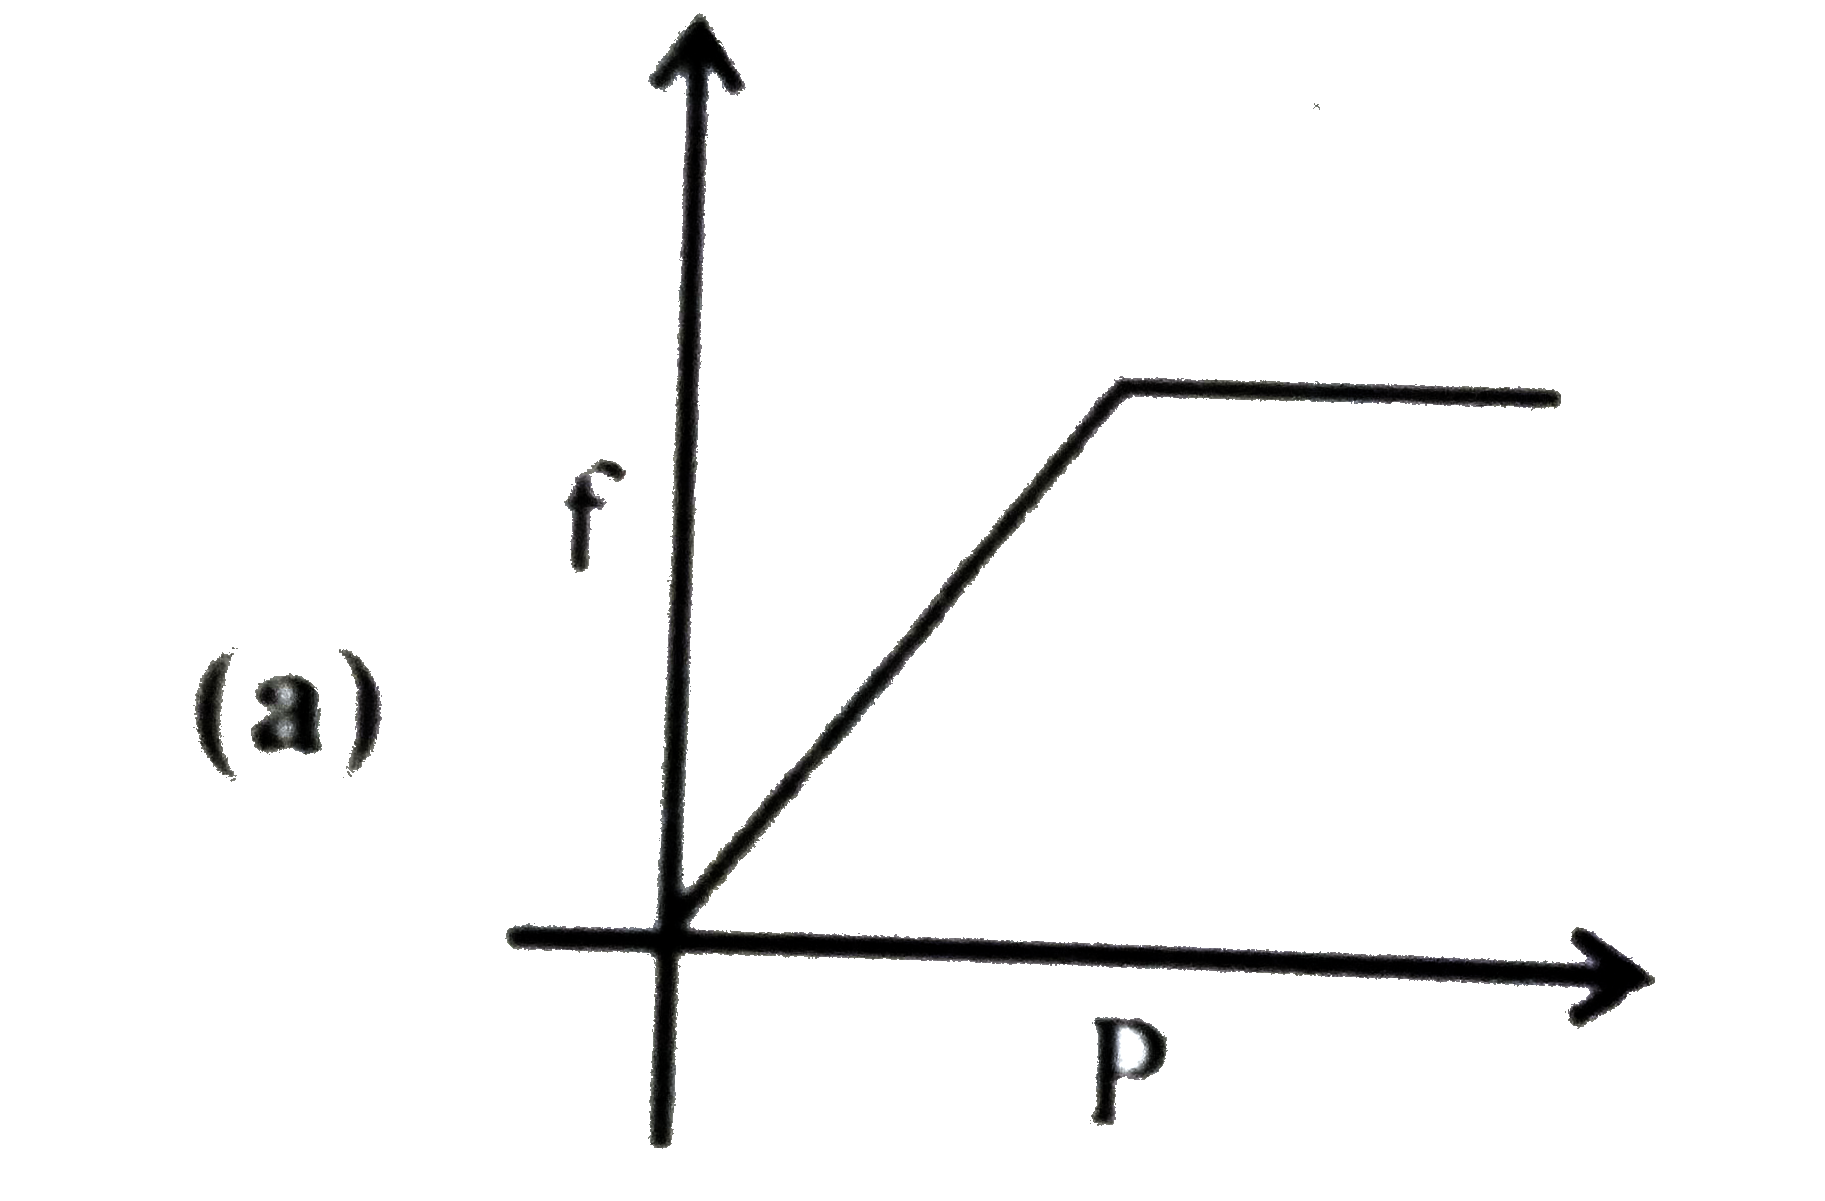
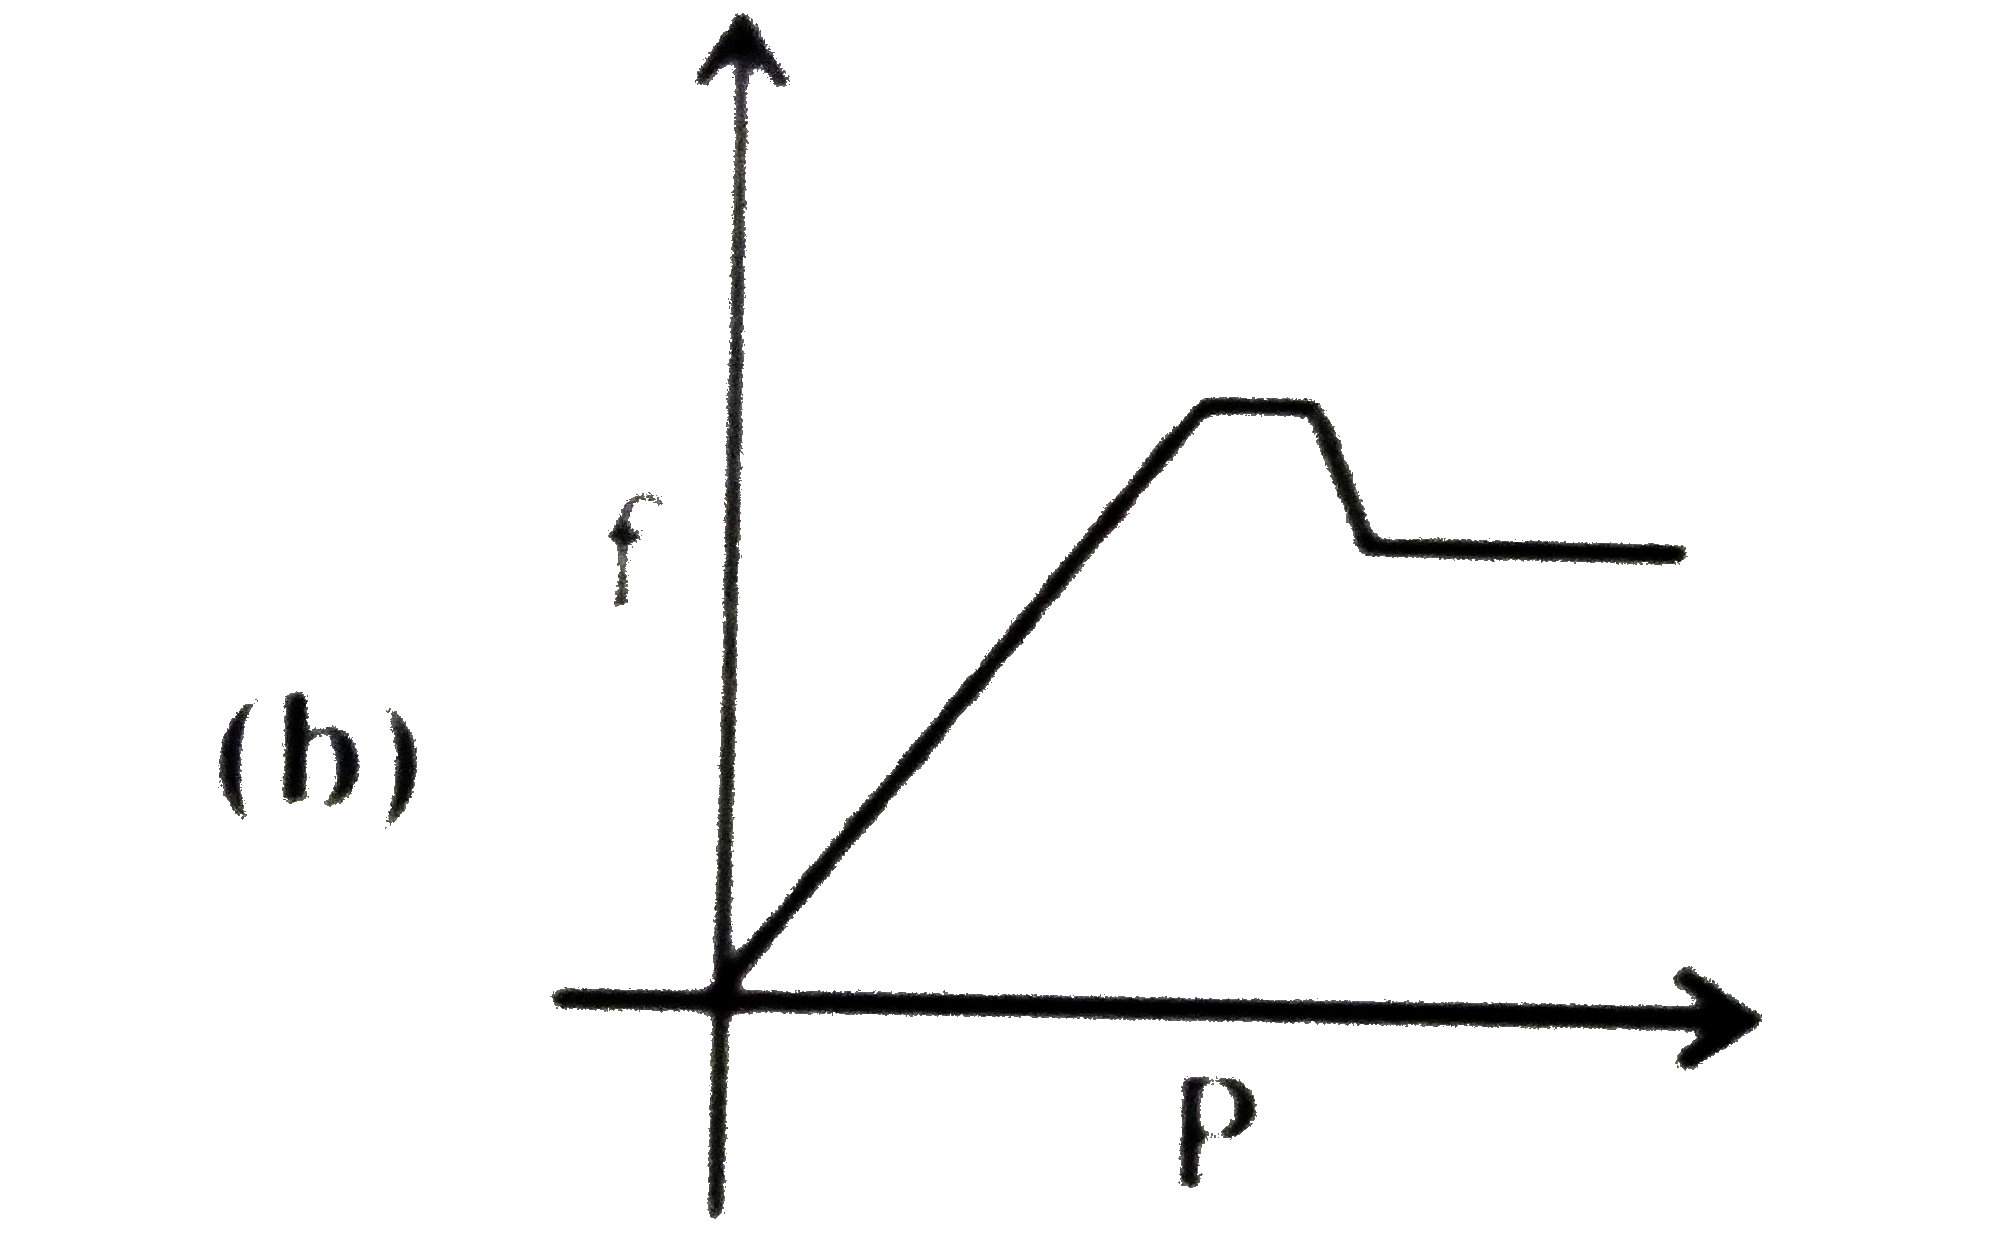
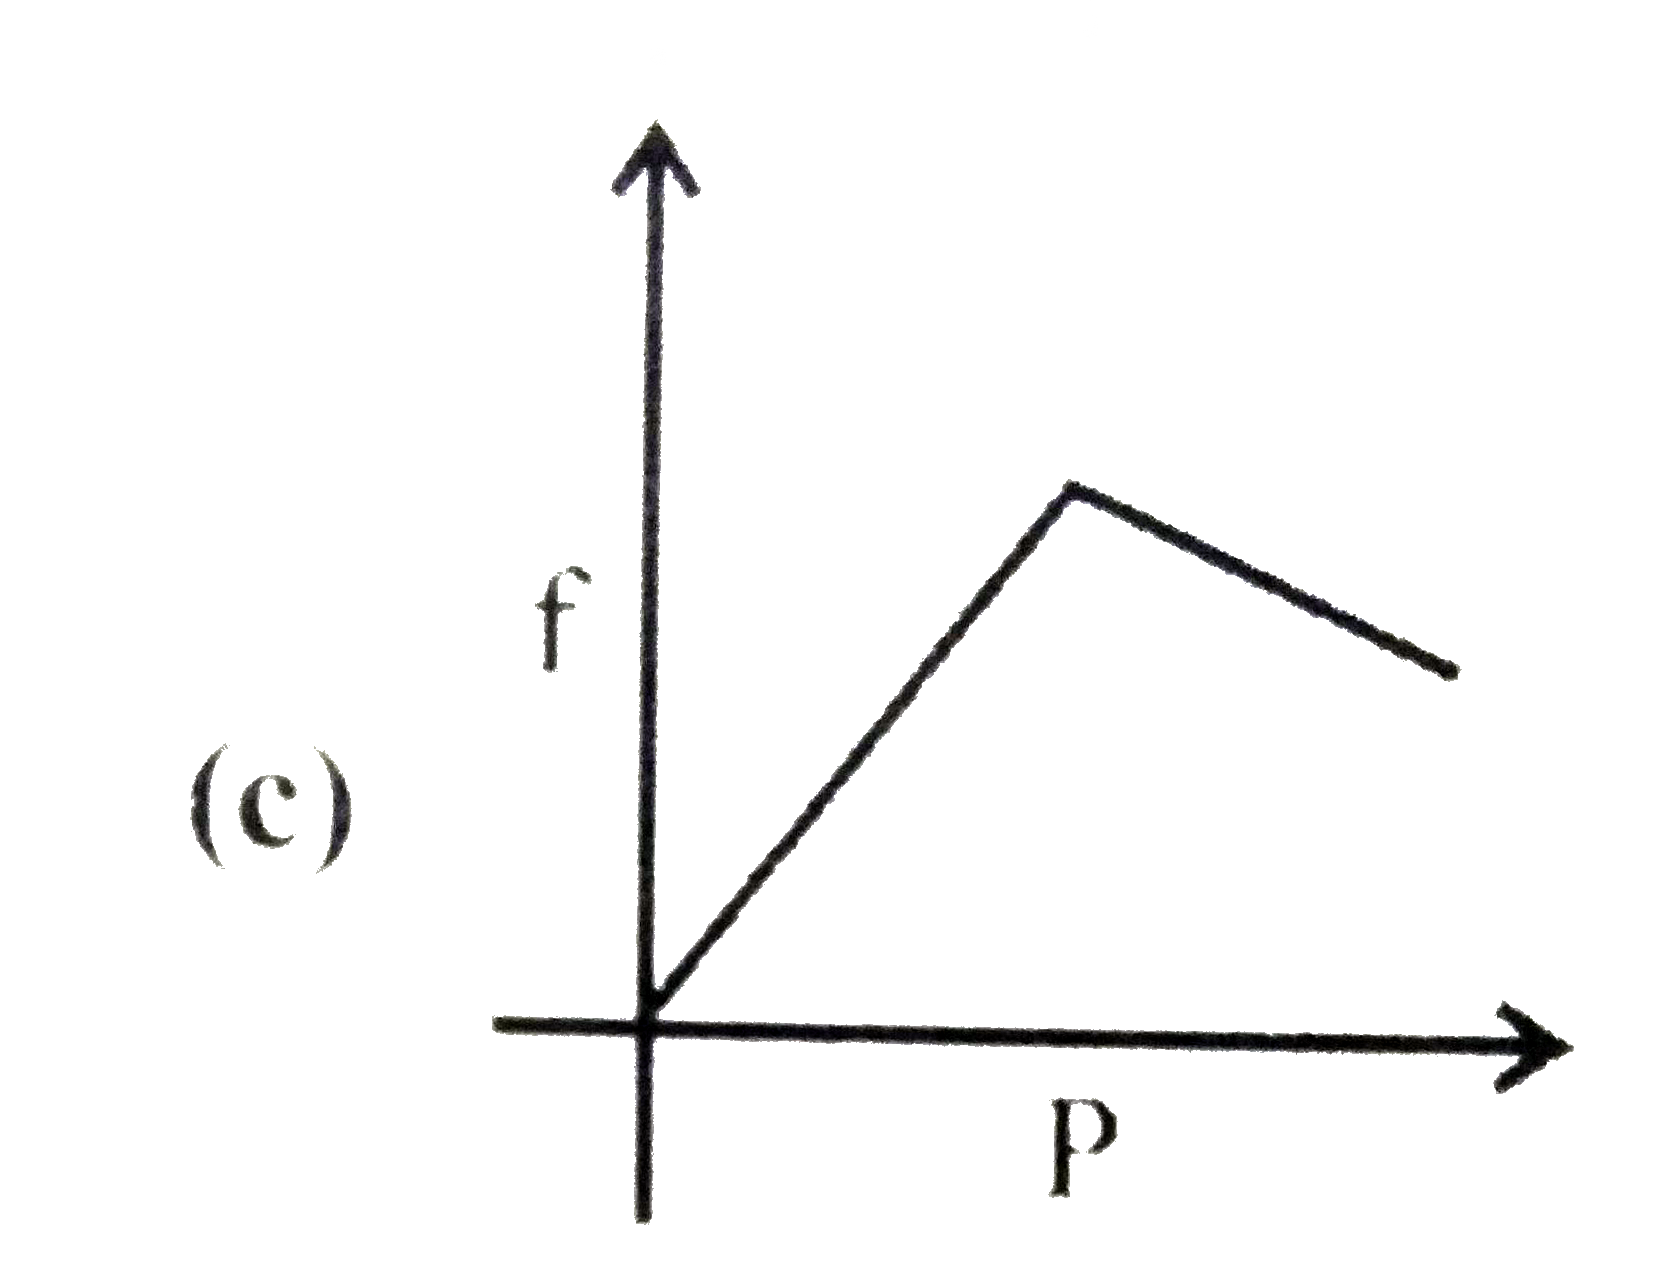
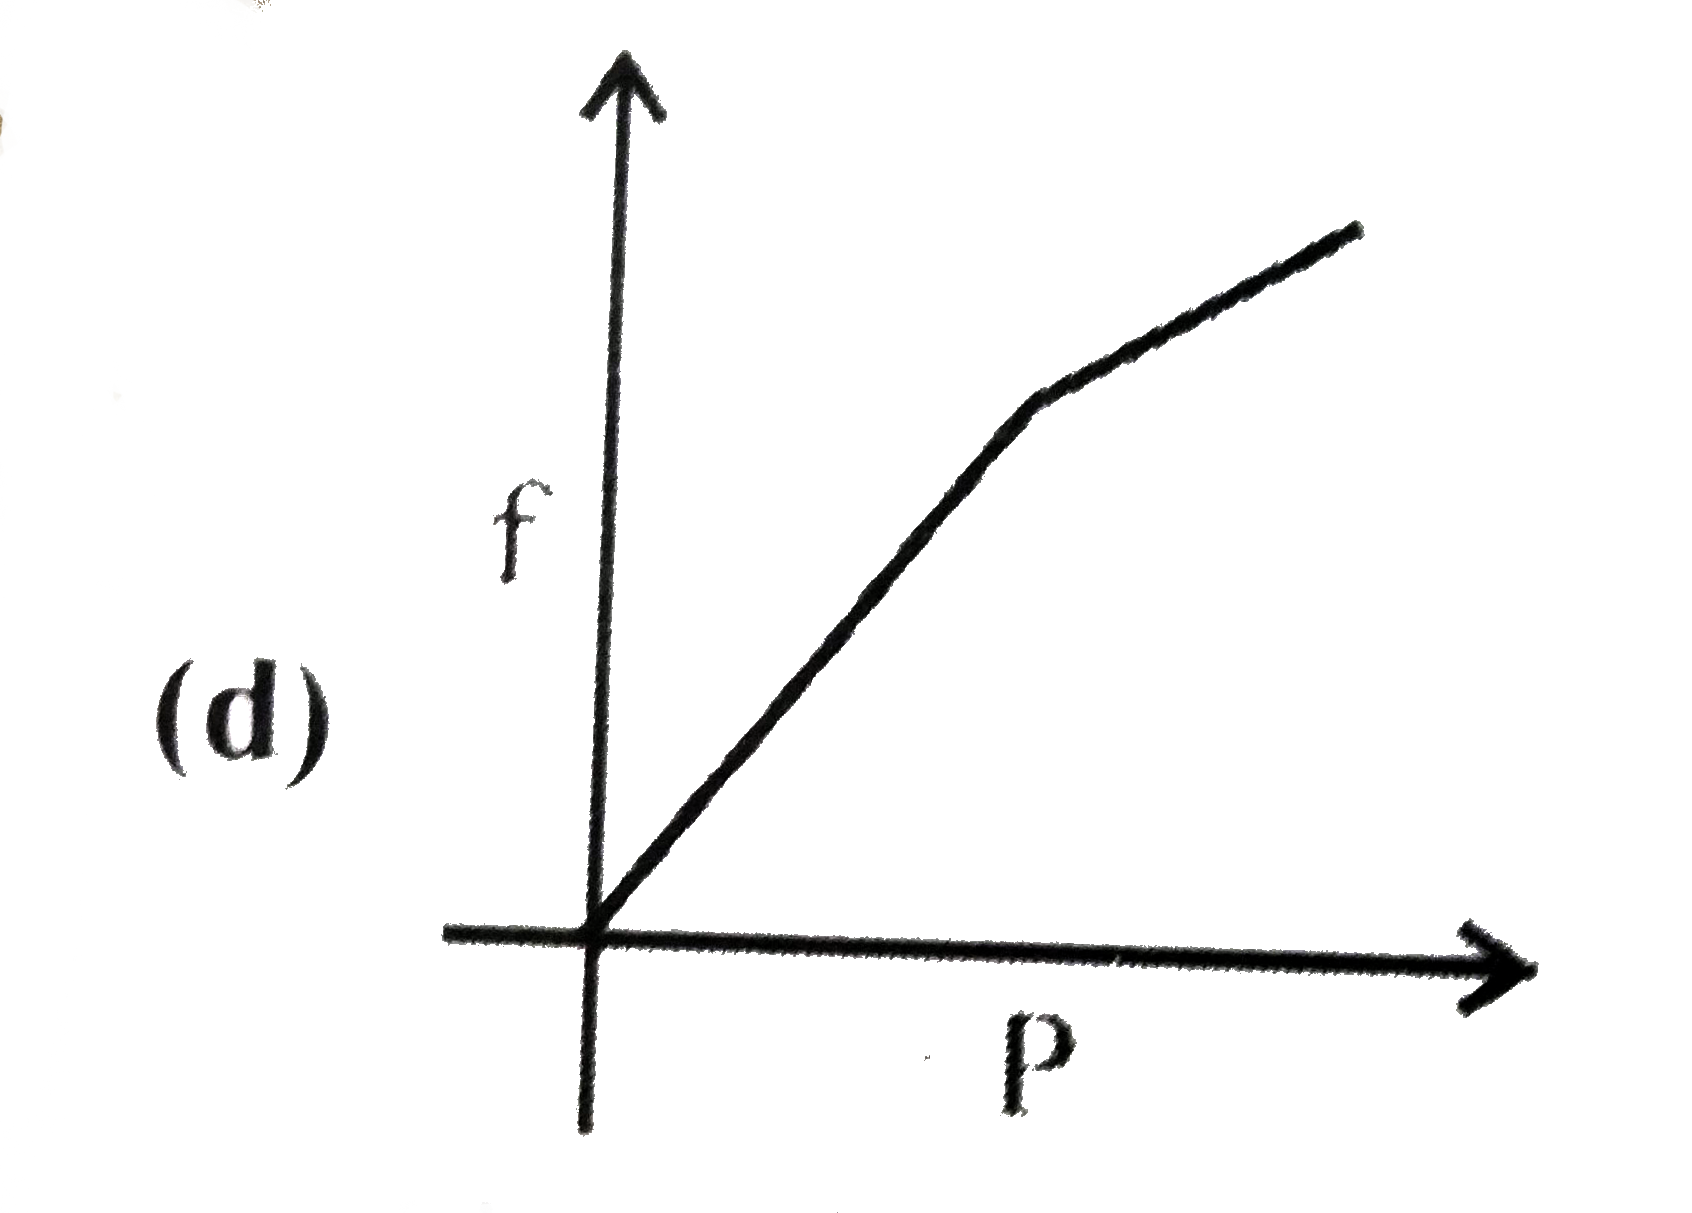
An external horizontal force P acts on a block placed on a rough horizontal surface. The force of friction (f) opposes the motion between them. Which of the following graphs represents the relation between P and f correctly?
The correct Answer is:C
When P is slowly increased, the force of friction increases, reaches it maximum value i.e. limiting force of friction and if P is increased further, the body begins to move in the direction of the applied force and in this case we consider the dynamic friction which is less than the static friction. Fig. (b) correctly represents the relation between f and P.
Topper's Solved these Questions
- FRICTIONAL IN SOLIDS AND LIQUIDS BOOK - MARVEL PUBLICATIONCHAPTER - FRICTIONAL IN SOLIDS AND LIQUIDS EXERCISE - TEST YOUR GRASP
10 Videos
- FORCE, WORK AND TORQUEBOOK - MARVEL PUBLICATIONCHAPTER - FORCE, WORK AND TORQUEEXERCISE - TEST YOUR GRASP
10 Videos
- MAGNETIC EFFECT OF ELECTRIC CURRENT BOOK - MARVEL PUBLICATIONCHAPTER - MAGNETIC EFFECT OF ELECTRIC CURRENT EXERCISE - TEST YOUR GRASP
10 Videos
Similar Questions

A force F=2t is spplied at t=0 sec to the block of mass m placed on a rough horizontal surface. The coefficient of static and kinetic friction between the block and surface are μS and μk respectively. Which of the following graphs best represents the acceleration vs time of the block(μS>μk)?
View Solution
A force F=2t is spplied at t=0 sec to the block of mass m placed on a rough horizontal surface. The coefficient of static and kinetic friction between the block and surface are μS and μk rspectively. Which of the following graphs best represents the acceleration vs time of the block(μS>μk)?
View Solution
Knowledge Check

A force F=2t is spplied at t=0 sec to the block of mass m placed on a rough horizontal surface. The coefficient of static and kinetic friction between the block and surface are μS and μk rspectively. Which of the following graphs best represents the acceleration vs time of the block(μS>μk)?A B
B C
C D
D
A force F accelerates a block of mass m on horizontal surface. The coefficient of friction between the contact surface is . The acceleration of m will be -
AF−μmgMBzeroCmay be (A) or (B)DNone of theseA metal block is resting on a rough wooden surface. A horizontal force applied to the block is increased uniformly. Which of the following curves correctly represents velocity of the block ?
A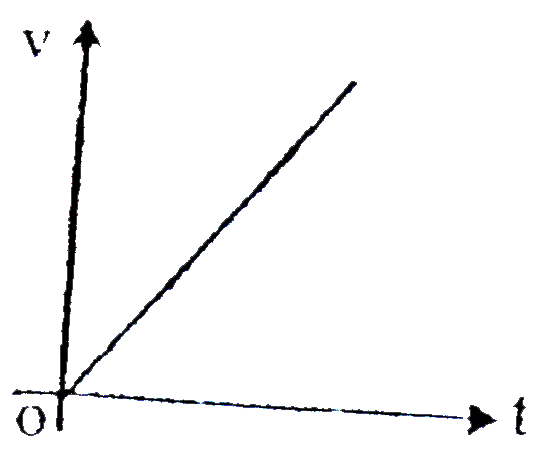 B
B C
C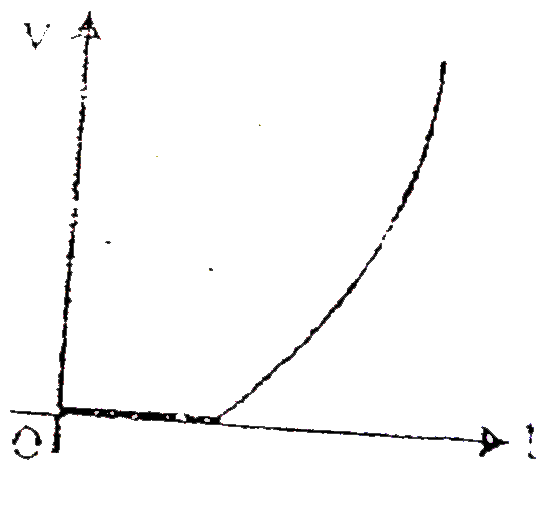 D
D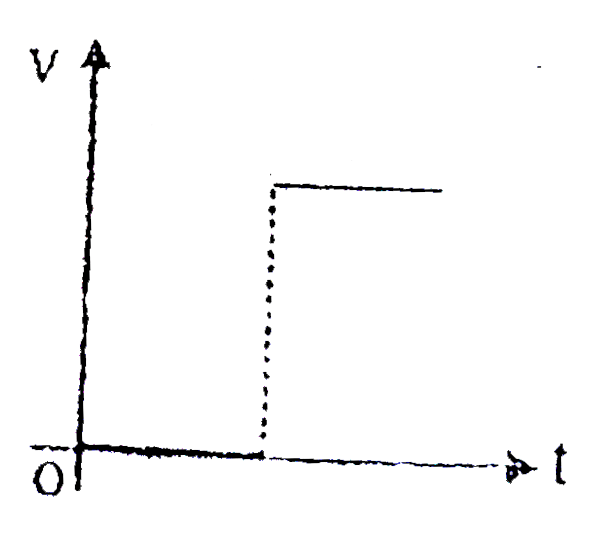
A metal block is resting on a rough wooden surface. A horizontal force applied to the block is increased uniformly. Which of the following curves correctly represents velocity of the block ?
View SolutionA block placed on a rough horizontal surface is pulled by a horizontal force F Let f be the force applied by the rough surface on the block . Plot a graph of f versus F .
View SolutionA block placed on a rough horizontal surface is pulled by a horizontal force F Let f be the force applied by the rough surface on the block . Plot a graph of f versus F .
View SolutionA block placed on a rough horizontal surface is pulled by a horizontal force F Let f be the force applied by the rough surface on the block . Plot a graph of f versus F .
View SolutionWhat is the value of applied force ‘F’ which is exerted at an angle θ with the horizontal on a block of mass ‘m’ placed on a horizontal rough surface, if the coefficient of static friction between the block and the surface is , such that the block is on the verge of moving horizontally?
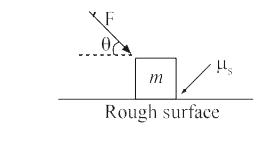
View Solution
