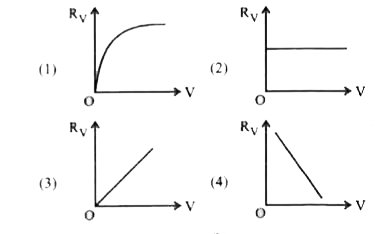
Which one of the fllowing graphs correctly represents the relation between the total effective resistance (R_v) of a multirange moving coil voltmeter (converted from a moving coil galvanometer of resistance G) and its voltage range for full scale deflection?
The correct Answer is:C
The maximum current that can pass through the galvanometer be . For converting the moving coil galvanometer of resistance G into a voltmeter R in series with the galvanometer so thst but total resistance for that range Thus the graph between R_v and V is a straight line passing through the origin as shown in the figure (3).
Topper's Solved these Questions
Similar Questions
Knowledge Check
The graph which represents the relation between the total resistance R of a multi range moving coil voltmeter and its full scale deflection
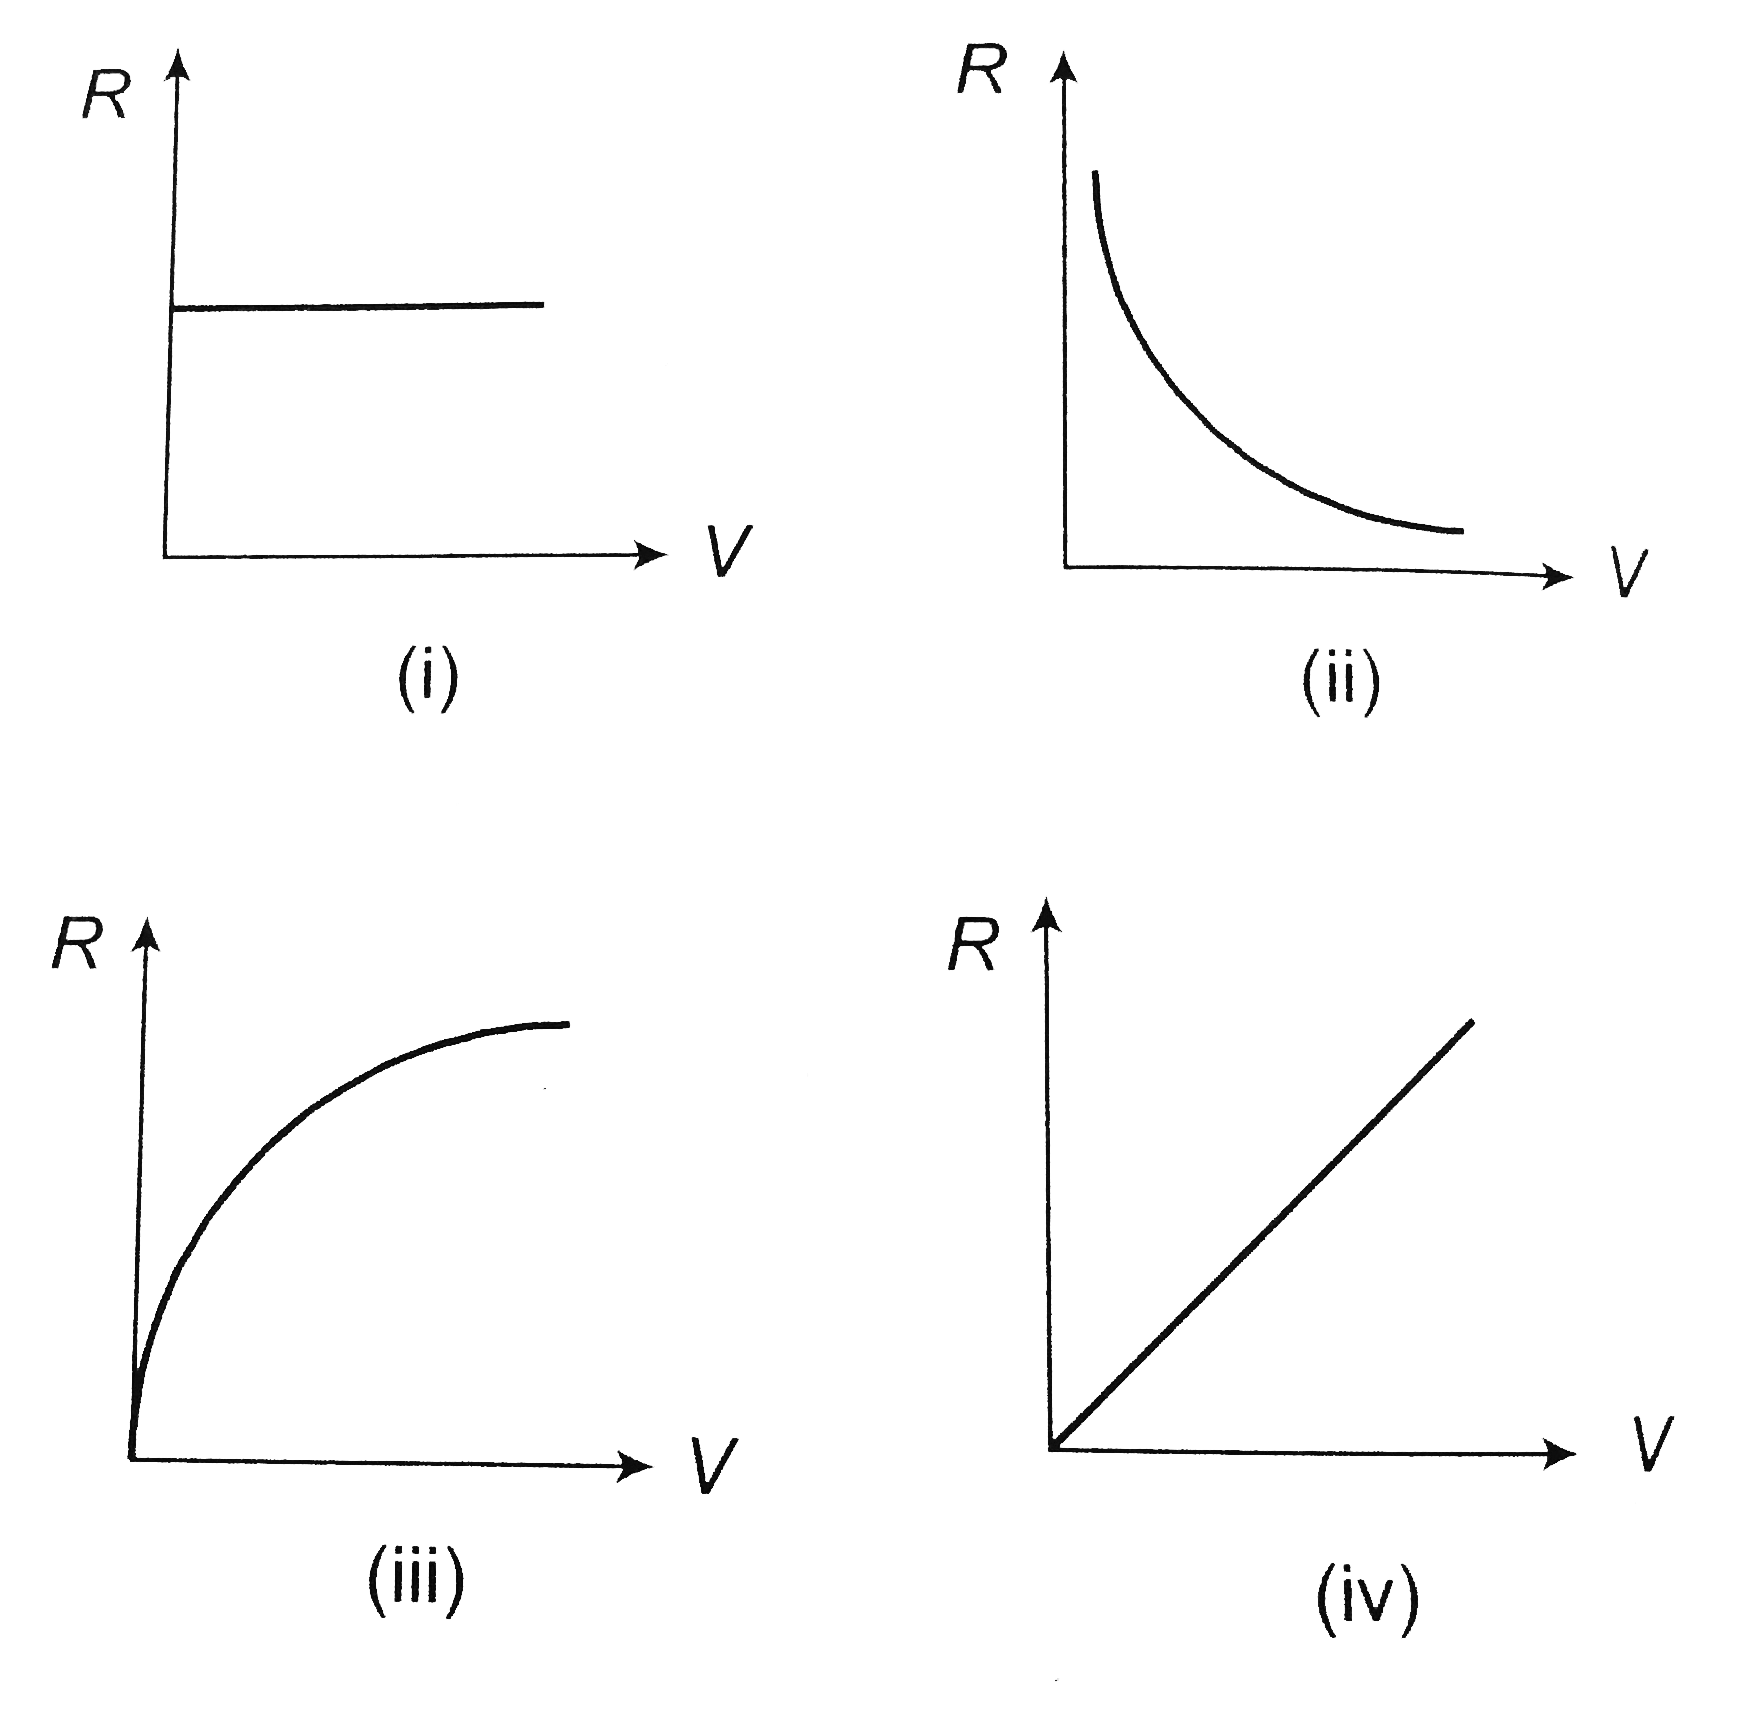 A(i)B(ii)C(iii)D(iv)
Of the following graphs , the one which shows the relationship between the resistance R of multirange moving coil ammeter and its range I is
A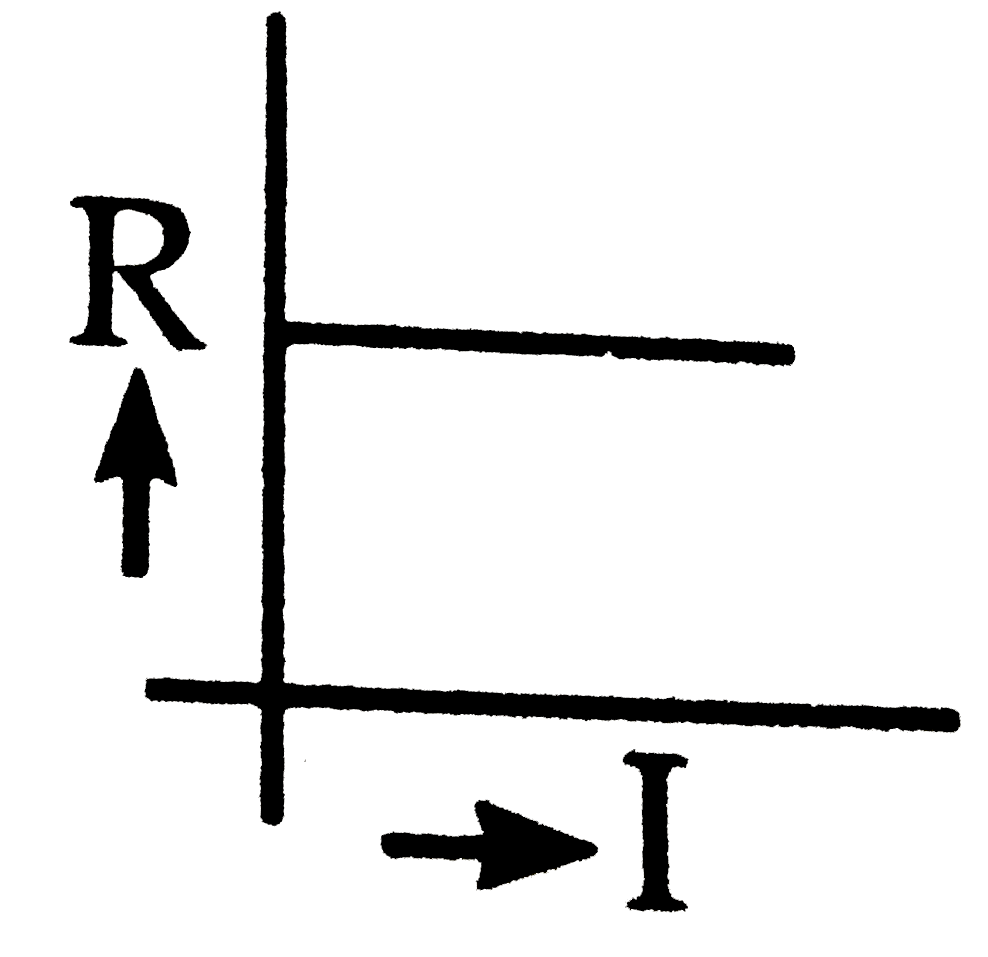 B
B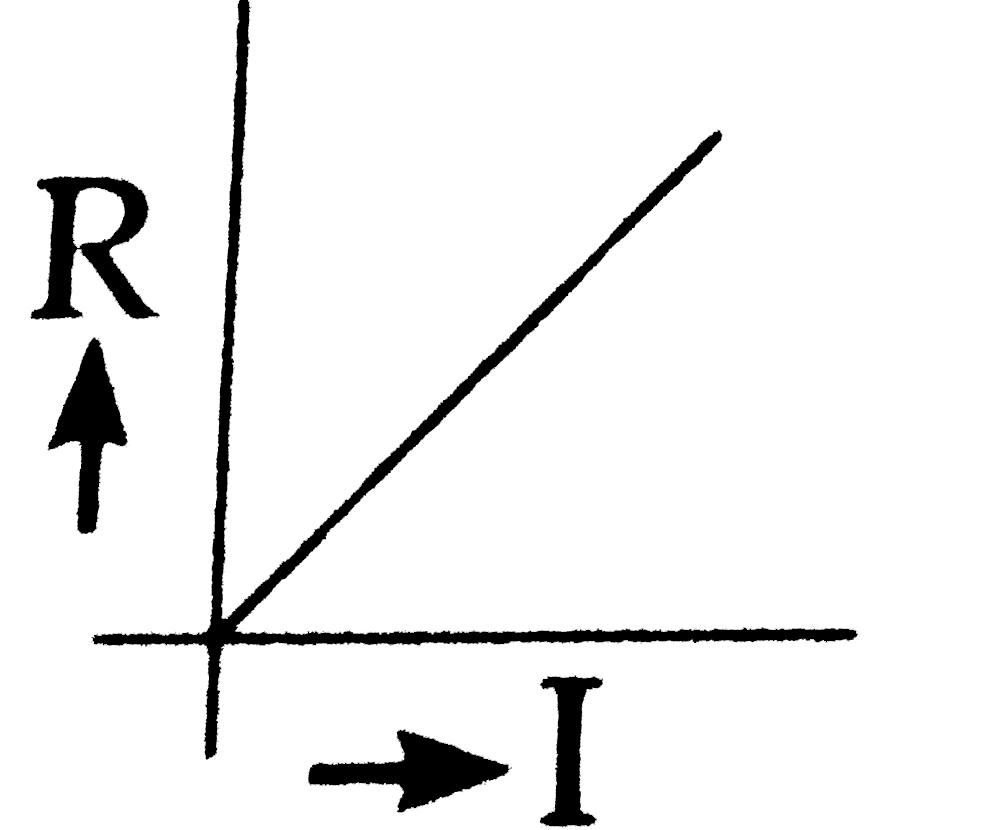 C
C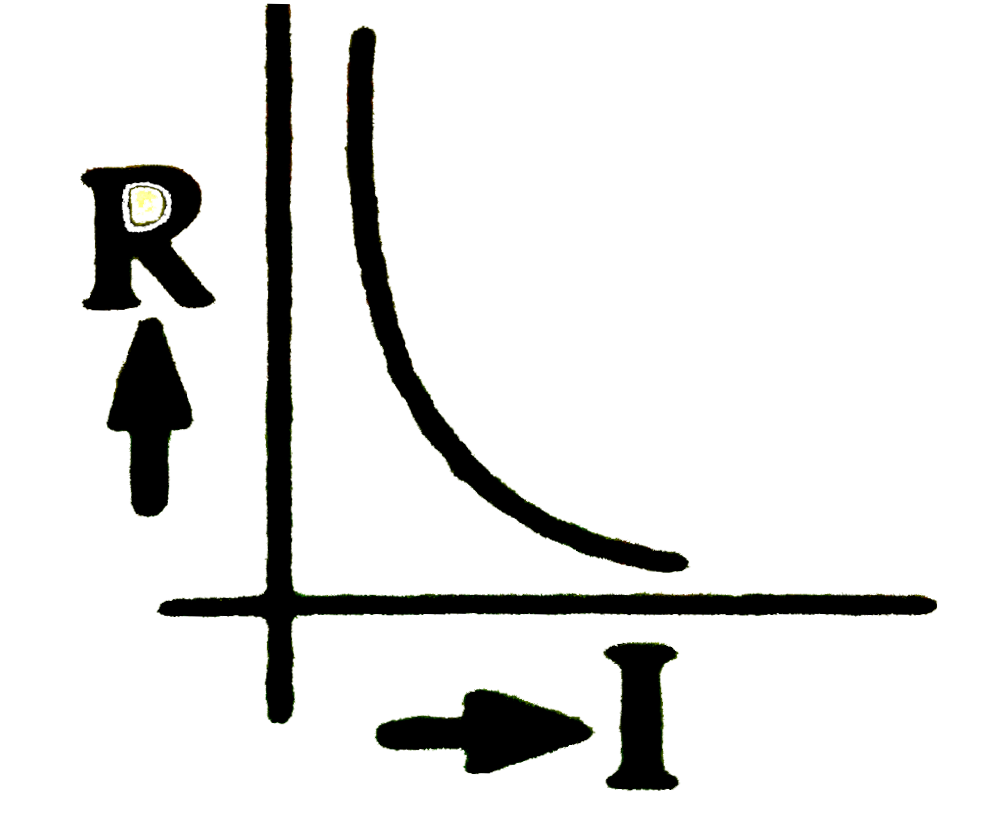 D
D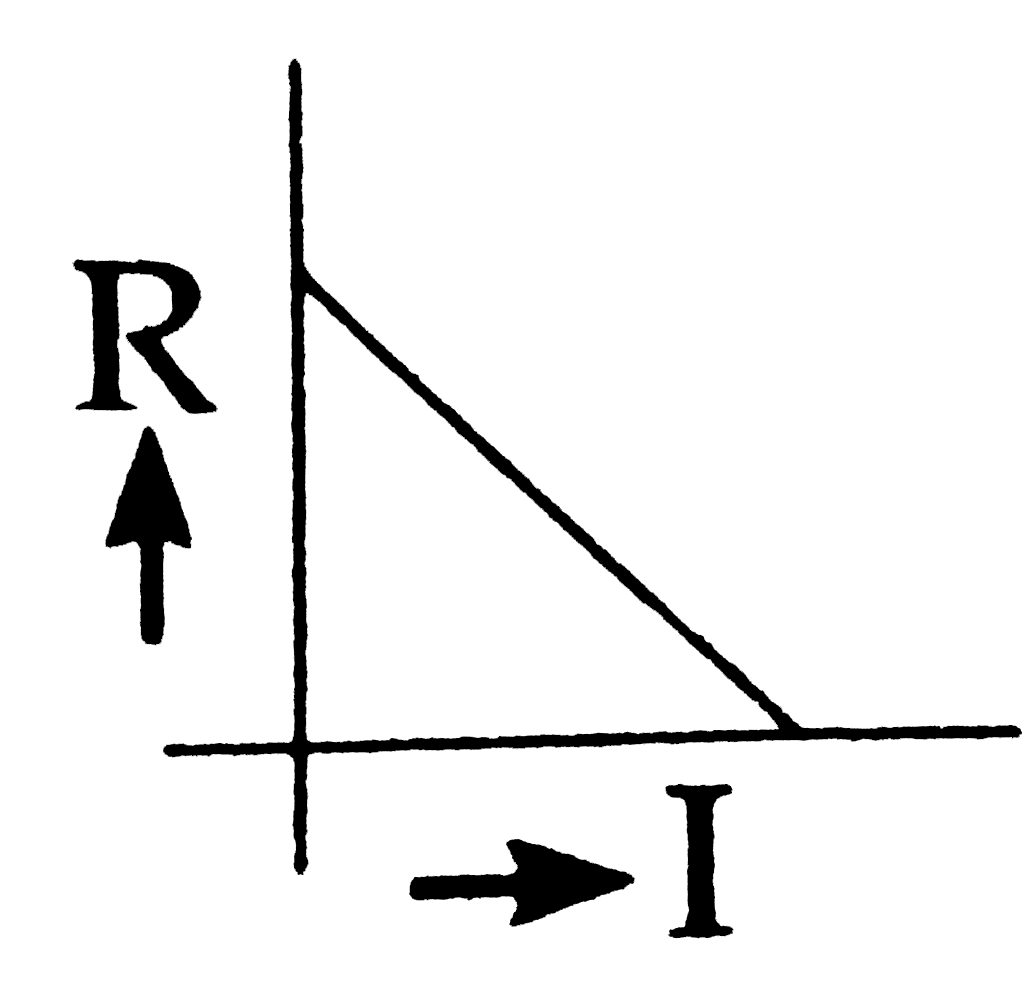
What is the relation between voltage sensitivity Sv and the current sensitivity S of a moving coil galvanometer ? (Given that G is the resistance of the galvanometer.)
ASv=GS1BSv=S1/GCSvS1=GDSvS1=G2
Calculate the value of the of resistance needed to convert a moving-coil galvanometer of 60Ω which gives a full scale deflection for a current of 50 mA into a voltmeter of range 0−50V.
View SolutionThe full scale deflection current of a galvanometer of resistance 1Ω is 5mA. How will you convert it into a voltmeter of range of V?
View SolutionThe relation between voltage sensitivity 'σV' and current sensitiviy σi of moving coil galvanometer if its resistance is 'G' is
View SolutionA moving coil galvanometer has a resistance of 50Ω and gives full scale deflection for 10 mA . How could it be converted into an ammeter with a full scale deflection for 1 A
View Solution100 current gives a full scale deflection in a galvanometer of 2Ω resistance. The resistance connected with the galvanometer to convert it into a voltmeter to measure V 5 is
View Solution
