The correct graph representing the variation of total energy (Et), kinetic energy (Ek) and potential energy (U) of a satellite with its distance form the centre of earth is
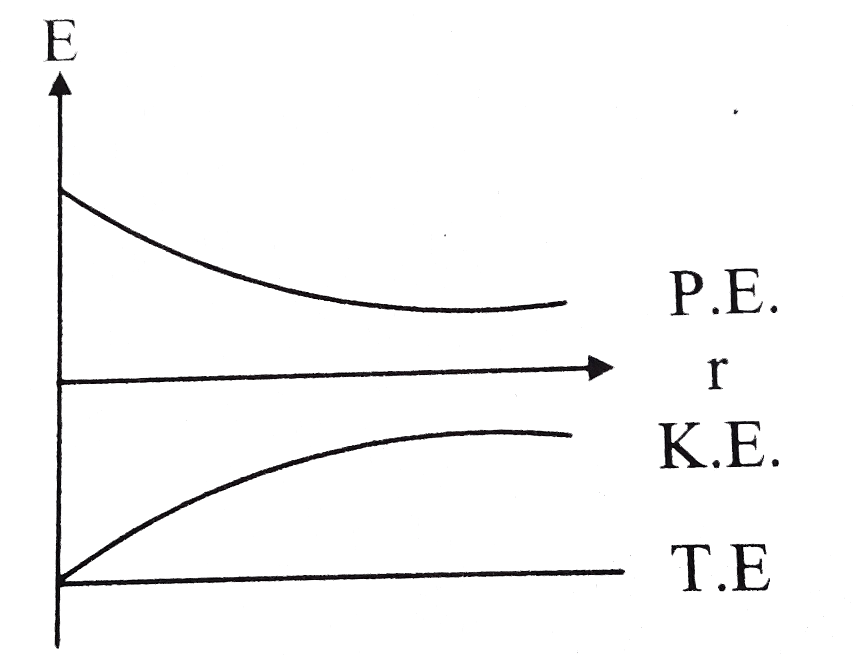
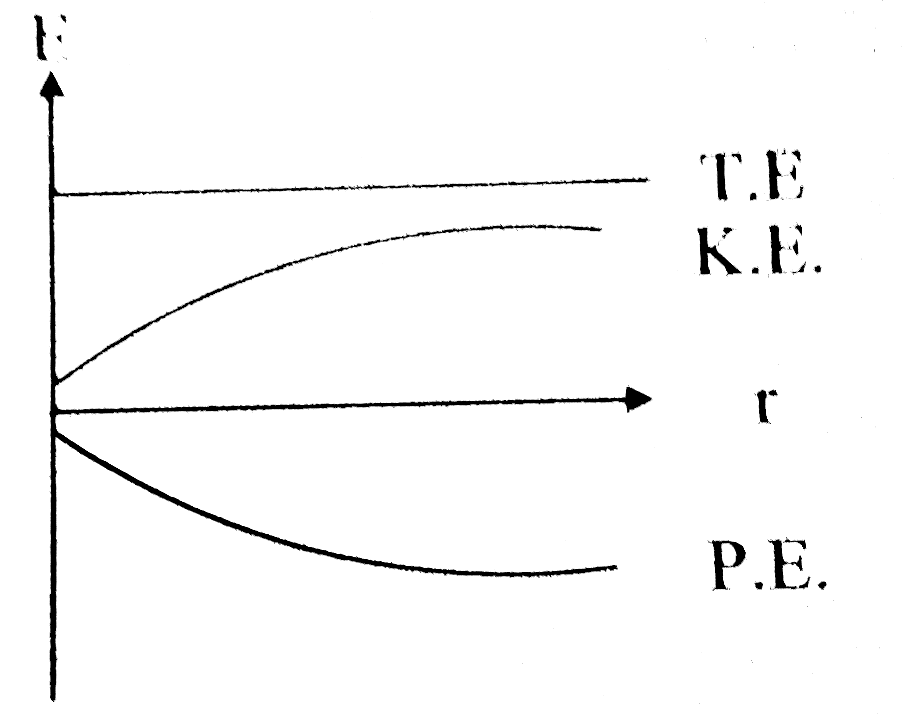
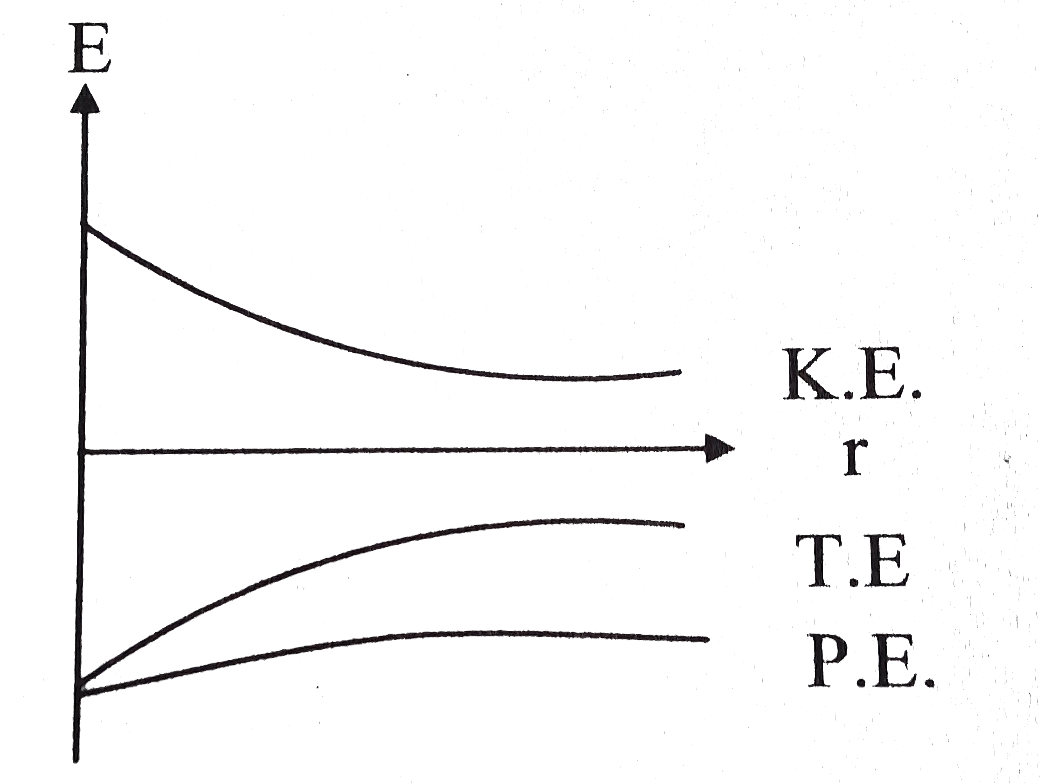
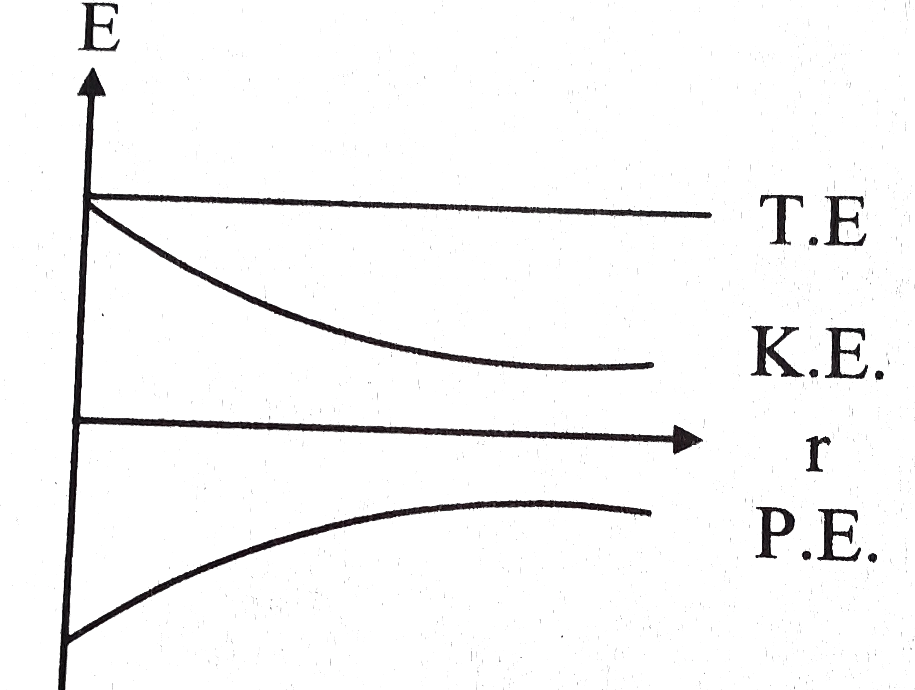
The correct Answer is:C
Step by step video, text & image solution for The correct graph representing the variation of total energy (E_(t)), kinetic energy (E_(k)) and potential energy (U) of a satellite with its distance form the centre of earth is by Physics experts to help you in doubts & scoring excellent marks in Class 12 exams.
Topper's Solved these Questions
- BOOK - TARGET PUBLICATIONCHAPTER - GRAVITATIONEXERCISE - COMPETITIVE THINKING109videos
GRAVITATION
- BOOK - TARGET PUBLICATIONCHAPTER - GRAVITATIONEXERCISE - EVALUATION TEST24videos
GRAVITATION
- BOOK - TARGET PUBLICATIONCHAPTER - GRAVITATIONEXERCISE - EVALUATION TEST24videos
GRAVITATION
- BOOK - TARGET PUBLICATIONCHAPTER - ELECTROSTATICSEXERCISE - EVALUATION TEST14videos
ELECTROSTATICS
- BOOK - TARGET PUBLICATIONCHAPTER - INTERFERENCE AND DIFFRACTIONEXERCISE - EVALUATION TEST20videos
INTERFERENCE AND DIFFRACTION
Similar Questions
Knowledge Check
- Question 1 - Select One
The physical situation in List-I with graphs of the variation of total energy (E), potential energy (U) and kinetic energy ( K) with time in List-II are given. Match the statements from List I with those in List II and select the correct answer using the code given below the lists.
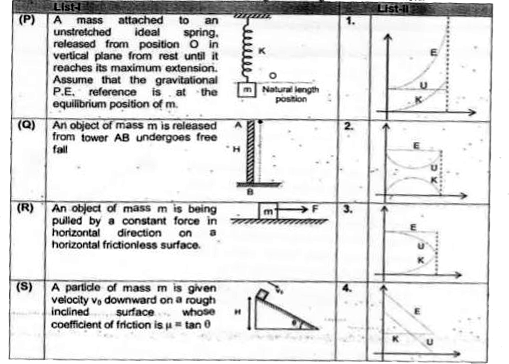 APQRS1423BPQRS2314CPQRS4123DPQRS4132
 - Question 2 - Select One
The kinetic energy of a satellite is 2 MJ. What is the total energy of the satellite?
A−2MJB−1MJC−12MJD−4MJ - Question 3 - Select One
The gravitational potential energy of a body at a distance r from the centre of earth is U. Its weight at a distance 2r from the centre of earth is
AUrBU2rCU4rDU√2r
If total energy of the same electron is E, then what would be its kinetic energy and potential energy .
View SolutionIf the kinetic energy of a satellite orbiting around the earth is doubled then
View SolutionWhich of the following graph is correct between kinetic energy E, potential energy (U) and height (h) from the ground of the partical
View SolutionFor a satellite moving in an orbit around the earth, ratio of kinetic energy to potential energy is
View SolutionThe magnitude of gravitational potential energy of a body at a distance r from the centre of earth is u. Its weight at a distance 2r from the centre of earth is
View Solution

