300 छात्रों का एक सर्वेक्षण किया गया । यह पाया गया कि 125 छात्रों को क्रिकेट खेलना पसंद है , 145 छात्रों को फुटबॉल खेलना पसंद है और 90 छात्रों को टेनिस खेलना पसंद है । 32 छात्र ऐसे हैं, जो तीन खेलो में से ठीक-ठीक दो खेल खेलना पसंद करते है ।
कितने छात्र सभी तीन खेल खेलना पसंद करते है ?
14
21
28
35
माना A उन छात्रों का समुच्चय है जिन्हें क्रिकेट पसंद है । B उन विद्यार्थियों का समुच्चय है, जिन्हें फुटबॉल पसंद है तथा C उन विद्यार्थियों का समुच्चय है जिन्हें टेनिस पसंद है ।
∴ हम जानते है
n(A∪B∪C)=300
n(A)=125
n(B)=145
n(C)=90
n(A∪B∪C)=n(A)+n(B)+n(C)
−[n(A∩B)+n(B∩C)+n(C∩B)]+n(A∩B∩C)
⇒300=125+145+90
−[n(A∩B)+n(B∩C)+n(C∩A)]+n(A∩B∩C)
⇒n(A∩B)+n(B∩C)+n(C∩A)
=60+n(A∩B∩C)
पुनः
n(A∩B)+n(B∩C)+n(C∩A)
−3n(A∩B∩C)=32
⇒n(A∩B)+n(B∩C)+n(C∩A)
=32+3n(A∩B∩C)...(ii)
समी (i) व (ii) से,
60+n(A∩B∩C)
=32+3mn(A∩B∩C)
⇒2n(A∩B∩C)=28
⇒n(A∩B∩C)=14
Topper's Solved these Questions
Similar Questions
यदि n∈N है, तो 121n−25n+1900n−(−4)n निम्नलिखित में से किससे विभाज्य है ?
06:14View Solutionअनुक्रम 25,−125,625,−3125,... का n वां पद क्या है ?
02:43View Solutionयह ज्ञात है की महाविद्यालय के छात्रों में से 60 % छात्रावास में रहते है और 40 % छात्रावास में नहीं रहते है । पूर्ववर्ती वर्ष से परिणाम सूचित करते है की छात्रावास में रहने वाले छात्रों में से30 % छात्रों में से 20 % छात्रों ने A ग्रेड लिए। वर्ष के अंत में महाविद्यालय के एक छात्र को यादृच्छया चुना गया और पाया गया की उसे A ग्रेड मिला है । इस बात की क्या प्रायिकता है की वह छात्रावास में रहने वाला है ?
01:13View SolutionThe average score of 30 students is 65, 36 students is 35 and 34 students is 45. The average score of all the students is :
30 छात्रों का औसत अंक 65 है, 36 छात्रों का 35 और 34 छात्रों का 45 है तो सभी छात्रों का औसत अंक है :02:56View SolutionThe given pie-chart favourite sport of students of a school. दिया गया पाई चार्ट एक विद्यालय के छात्रों के पसंदीदा खेल को दर्शाता है | In the given pie-chart, if there were 1280 students in all, how many liked football? इस पाई चार्ट के अनुसार, यदि कुल मिलाकर 1280 छात्र हैं, तो फुटबॉल कितने छात्रों को पसंद है ?
03:58View SolutionThe given pie-chart favourite sport of students of a school. दिया गया पाई चार्ट एक विद्यालय के छात्रों के पसंदीदा खेल को दर्शाता है | In the given pie-chart, what is the difference in percentage between liking for football and basketball? इस पाई चार्ट के अनुसार, फुटबॉल तथा बास्केटबॉल पसंद करने के प्रतिशत में क्या अंतर है ?
01:02View SolutionThe given pie-chart favourite sport of students of a school. दिया गया पाई चार्ट एक विद्यालय के छात्रों के पसंदीदा खेल को दर्शाता है | In the given pie-chart, if the school strength was 2500, how many liked cricket more than hockey? इस पाई चार्ट के अनुसार, यदि विद्यालय में कुल 2500 छात्र थे , तो कितने छात्र क्रिकेट को हॉकी से ज्यादा पसंद करते थे ?
03:21View Solutionप्राथमिक स्तर पर अधिकांशत: बच्चे ......... कविताएँ पसंद करते हैं |
02:47View SolutionStatement/ कथन : A very large number of students love dancing in the rain rather than studying in class./ बहुत बड़ी संख्या में छात्रों को कक्षा में पढ़ने के बजाय बारिश में नाचना पसंद है। Conclusion/ निष्कर्ष: l. Rain keeps students healthy./बारिश छात्रों को स्वस्थ रखती है। ll. Dancing is a good Exercise./डांस करना एक अच्छी एक्सरसाइज है।
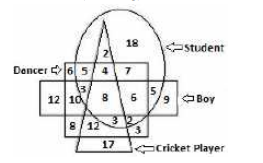
02:47View SolutionIn the following diagram, the triangle represents ‘cricket players’, the circle represents ‘students’, the rectangle represents ‘boys’ and the square represents ‘dancers’. The numbers in different segments show the number of persons.
निम्नलिखित आरेख में, त्रिभुज क्रिकेट खिलाड़ियों' को दर्शाता है, वृत्त 'छात्रों' को दर्शाता है, आयत ' लड़कों? को दर्शाता है तथा वर्ग 'नर्तकों' को दर्शाता है | विभिन्न खंडो में दी गयी संख्याएं लोगों की संख्या के बारे में बताती हैं How many students are dancers and cricket players but not boys?
कितने छात्र नर्तक और क्रिकेट खिलाड़ी हैं लेकिन लड़के नहीं हैं ?03:53View SolutionThere are 70 students in a class, of them 50 students like cricket, 35 like both cricket and football, and some like only football. Select the venn diagram that correctly represents the given information. एक कक्षा में 10 छात्र हैं, उनमें से 50 छात्र क्रिकेट पसंद करते है, 35 क्रिकेट और फुटबॉल दोनों पसंद करते हैं और कुछ केवल फुटबॉल पसंद करते हैं। वेन आरेख का चयन करें जो दी गई जानकारी को सही ढंग से प्रस्तुत करता है।
01:53View SolutionIn the given Venn diagram, the ‘rectangle’ represents ‘travellers who like to travel by plane’, the ‘circle’ represents ‘travellers who like to travel by bus’ , and the ‘triangle ‘represents travellers who like to travellers who like to travel by train’. The numbers given in the diagram represent the number of travellers in that particular category. दिए गए वेन आरेख में, आयत'” उन यात्रियों को दर्शाता है जो विमान के द्वारा सफ़र करना पसंद करते हैं | 'वृत्त' उन यात्रियों को दर्शाता है जो “बस' के द्वारा सफ़र करना पसंद करते हैं तथा त्रिभुज” उन यात्रियों को दर्शाता है जो ट्रेन से यात्रा करना पसंद करते हैं | आरेख में दी गयी संख्याएँ उस विशेष श्रेणी के यात्रियों की संख्या को दर्शाती हैं| How many travellers like to travel either by train or plane but NOT by bus? कितने यात्री ऐसे हैं जो ट्रेन या विमान से सफ़र करना पसंद करते हैं लेकिन बस से नहीं ?
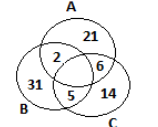
02:28View SolutionIn the given Venn diagram, A denotes mangoes, B denotes bananas, C denotes apples, and the numbers in each section represent the number of persons who like fruits. How many persons like only bananas? / दिए गए वेंन आरेख में, A आम को, B केले को, C सेब को दर्शाता है | प्रत्येक अंक उस अनुभाग के फलों को पसंद करने वाले लोगों ही दर्शाता है | कितने लोगों को केवल केले पसंद है?
02:44View SolutionIn the given Venn diagram, A likes milk, B likes bread and C likes meat. Who likes all the given eating materials? / किसी वेंन आरेख में, A को दूध, B को ब्रेड और C को मीट पसंद है | किसको सब खाना पसंद है ?
01:34View SolutionIn the given Venn diagram, 'A' denotes 'likes teaching', 'B' denotes 'likes cooking', and 'C' denotes 'likes playing', How many persons like only teaching and playing but NOT cooking?
दिए गए वेंन आरेख में A पढ़ाने को, B खाना बनाने को और C खेल पसंद को दर्शाता है| कितने व्यक्तियों को पढ़ना और खेलना पसंद है पर खाना बनाना नहीं ? 02:10View Solution
60 students were asked to choose their favourite sport. Their distribution is an follows :
Football = 15
Cricket = 12
Swimming - 12
Basketball - 11
Athletics = 10
The data is illustrated in a Pie Chart. What angle should be used for football?View Solution

