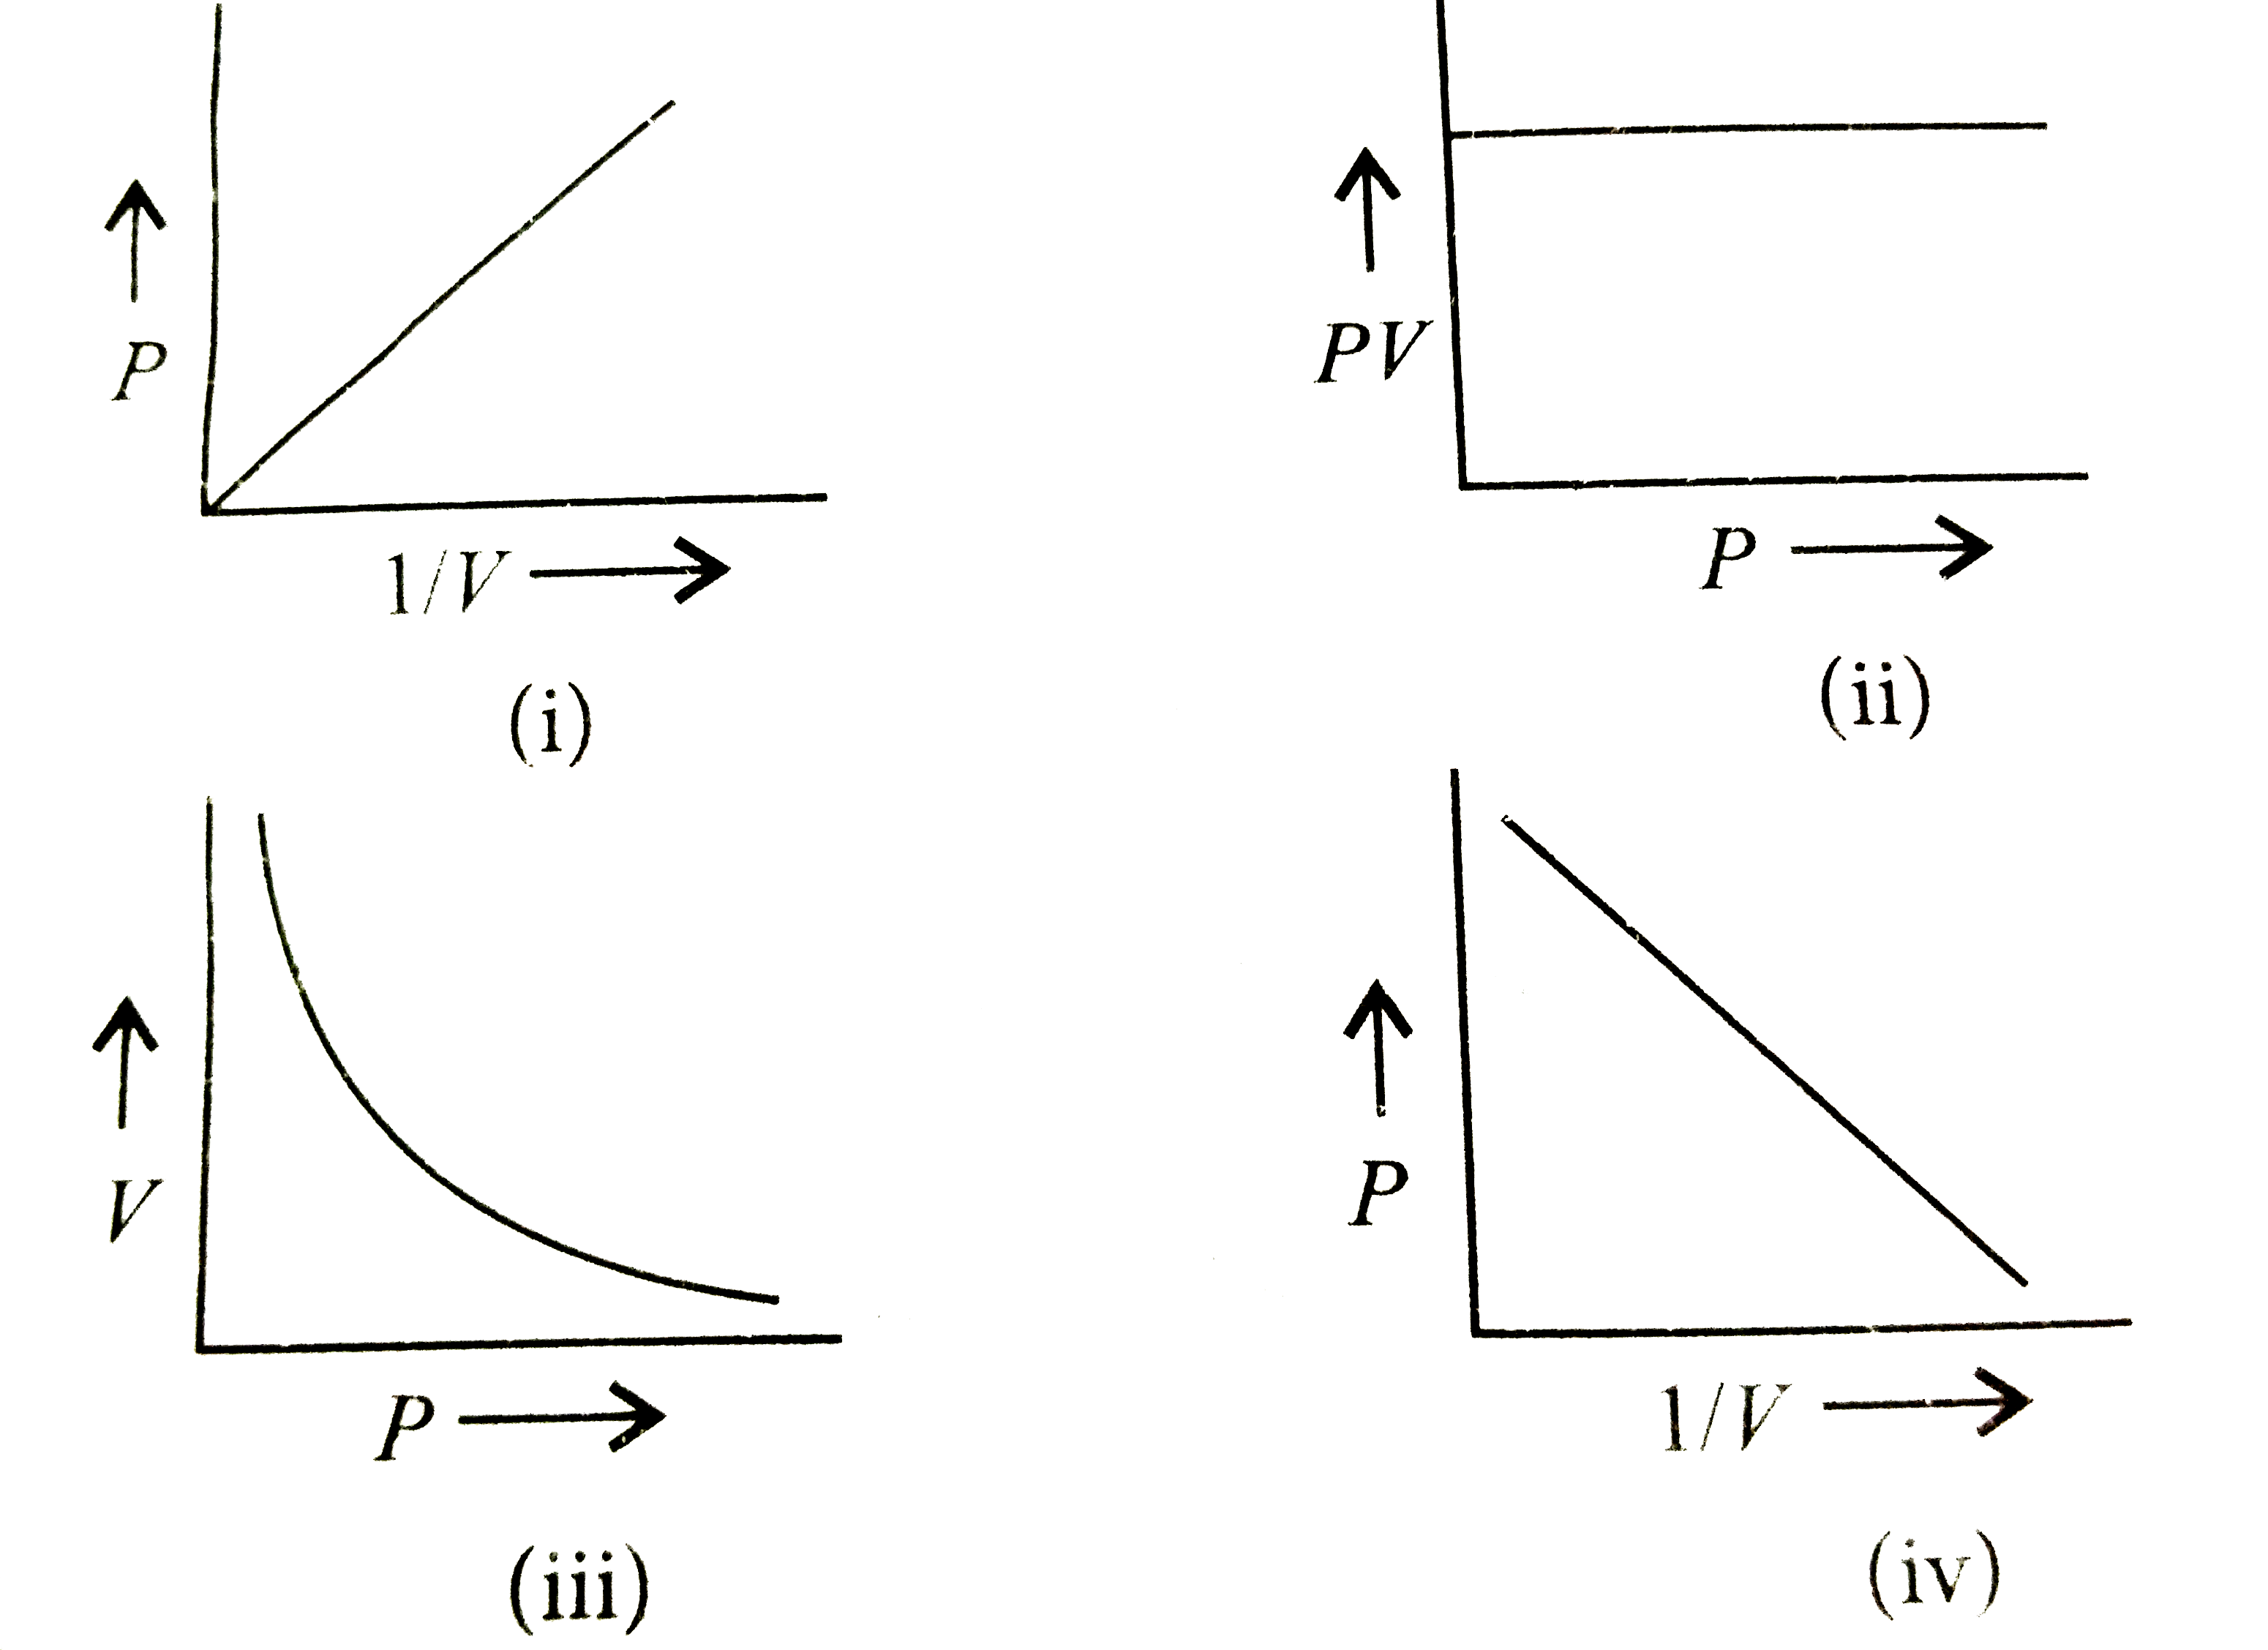
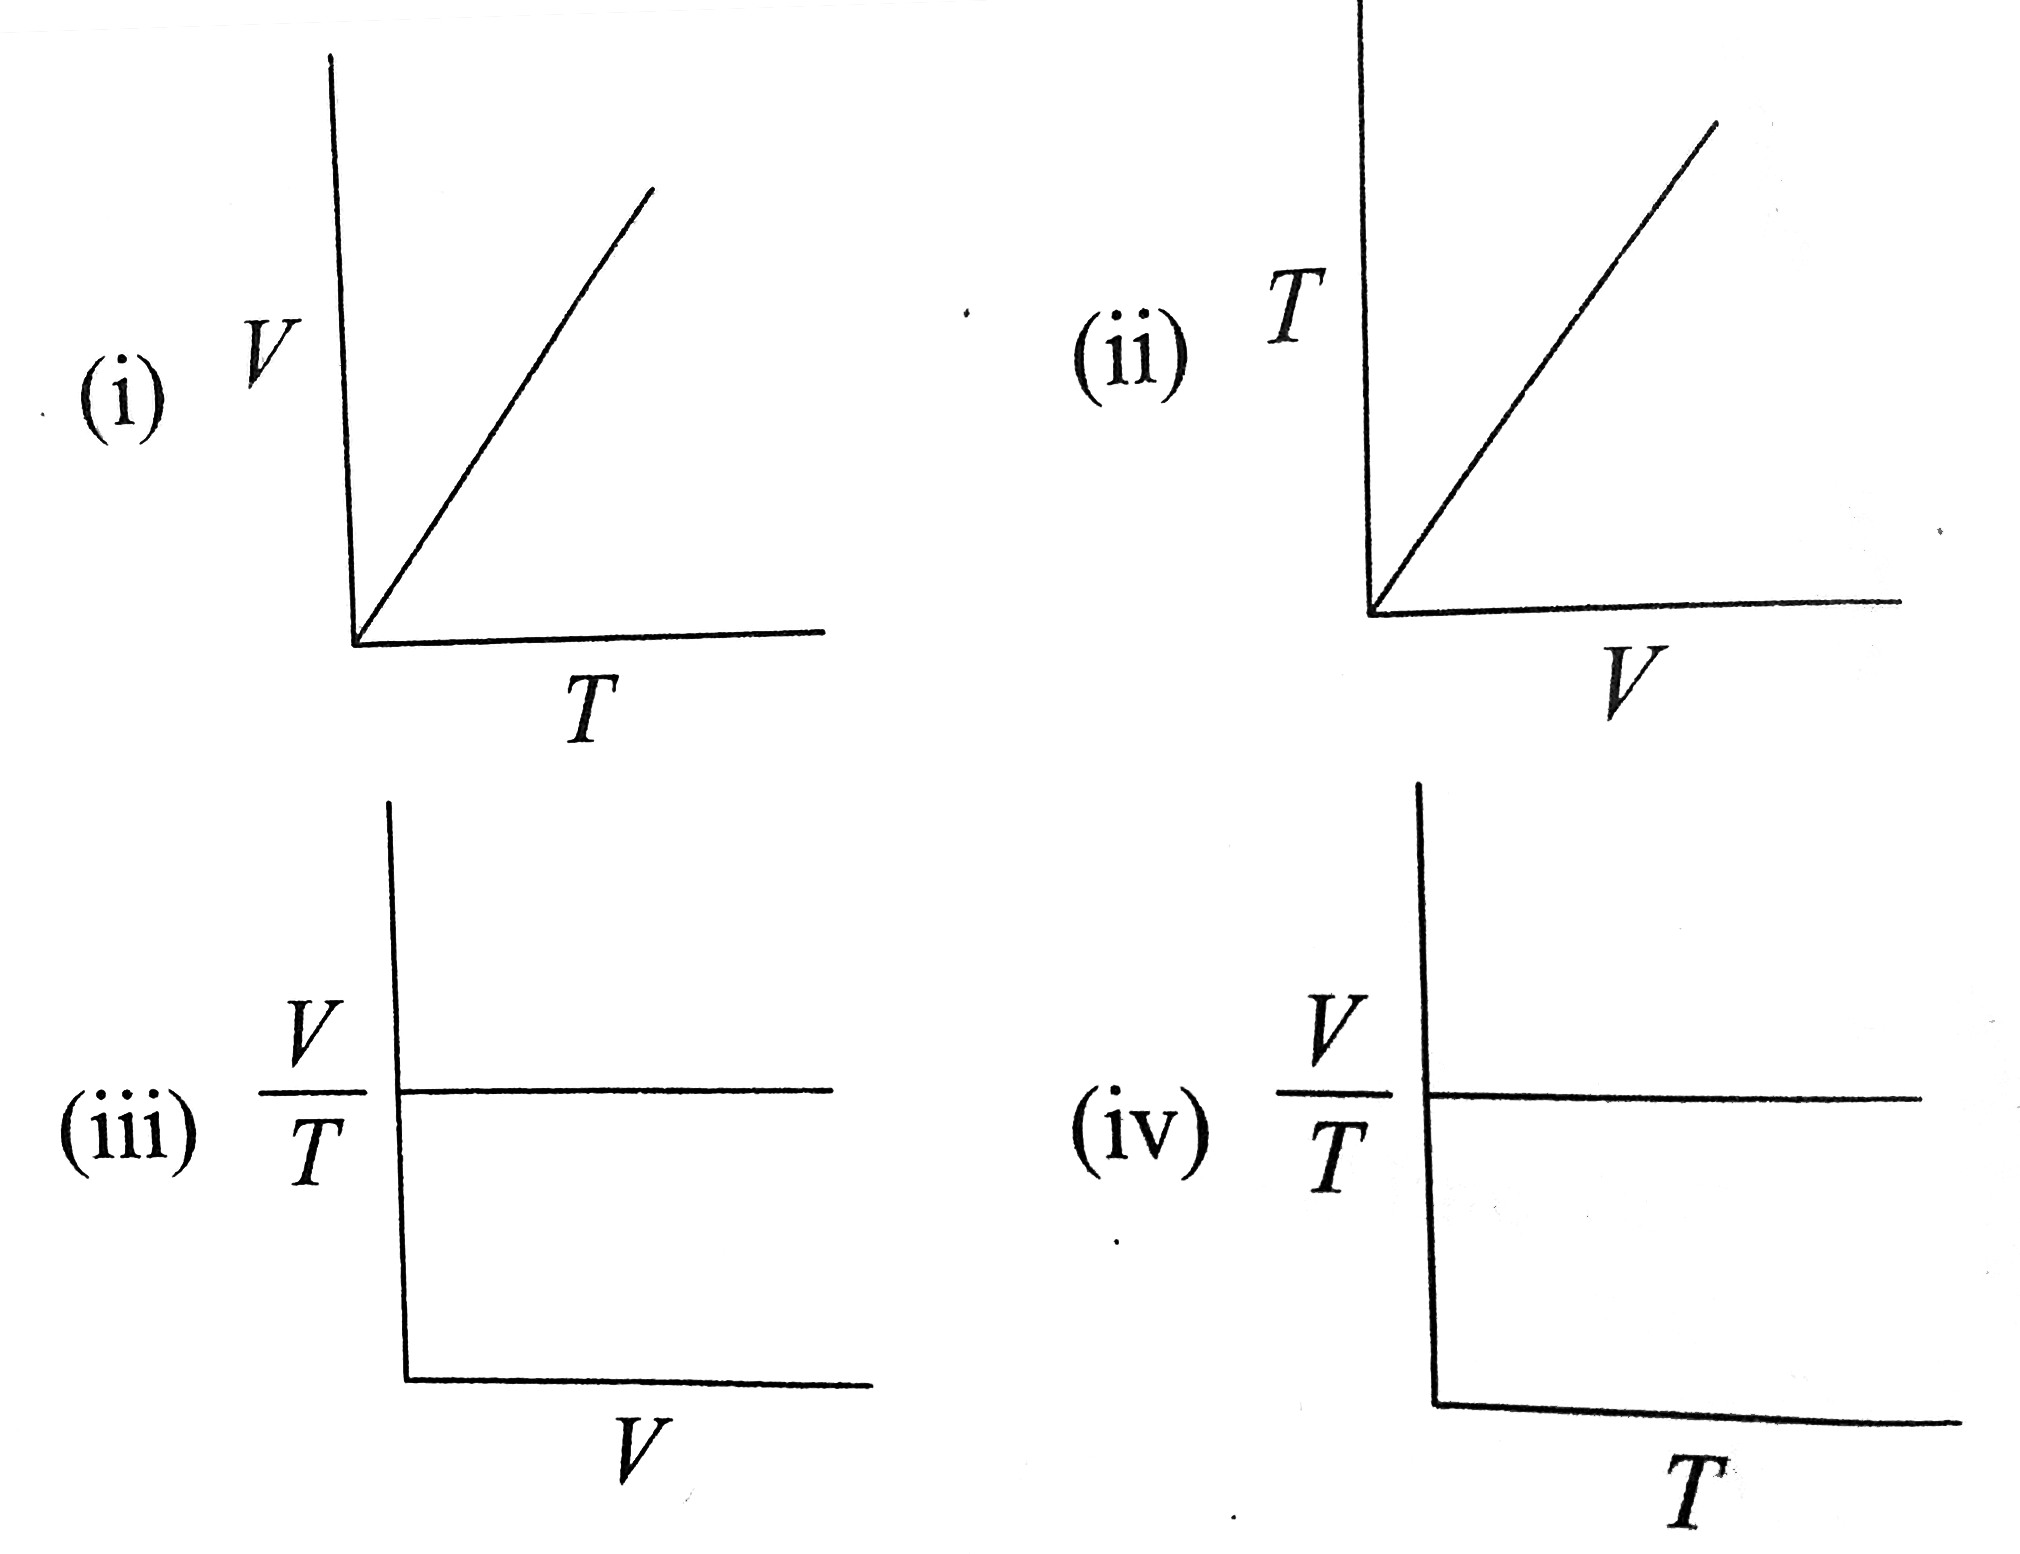
Which of the following graphs represents Boyle's law correctly?
(i) 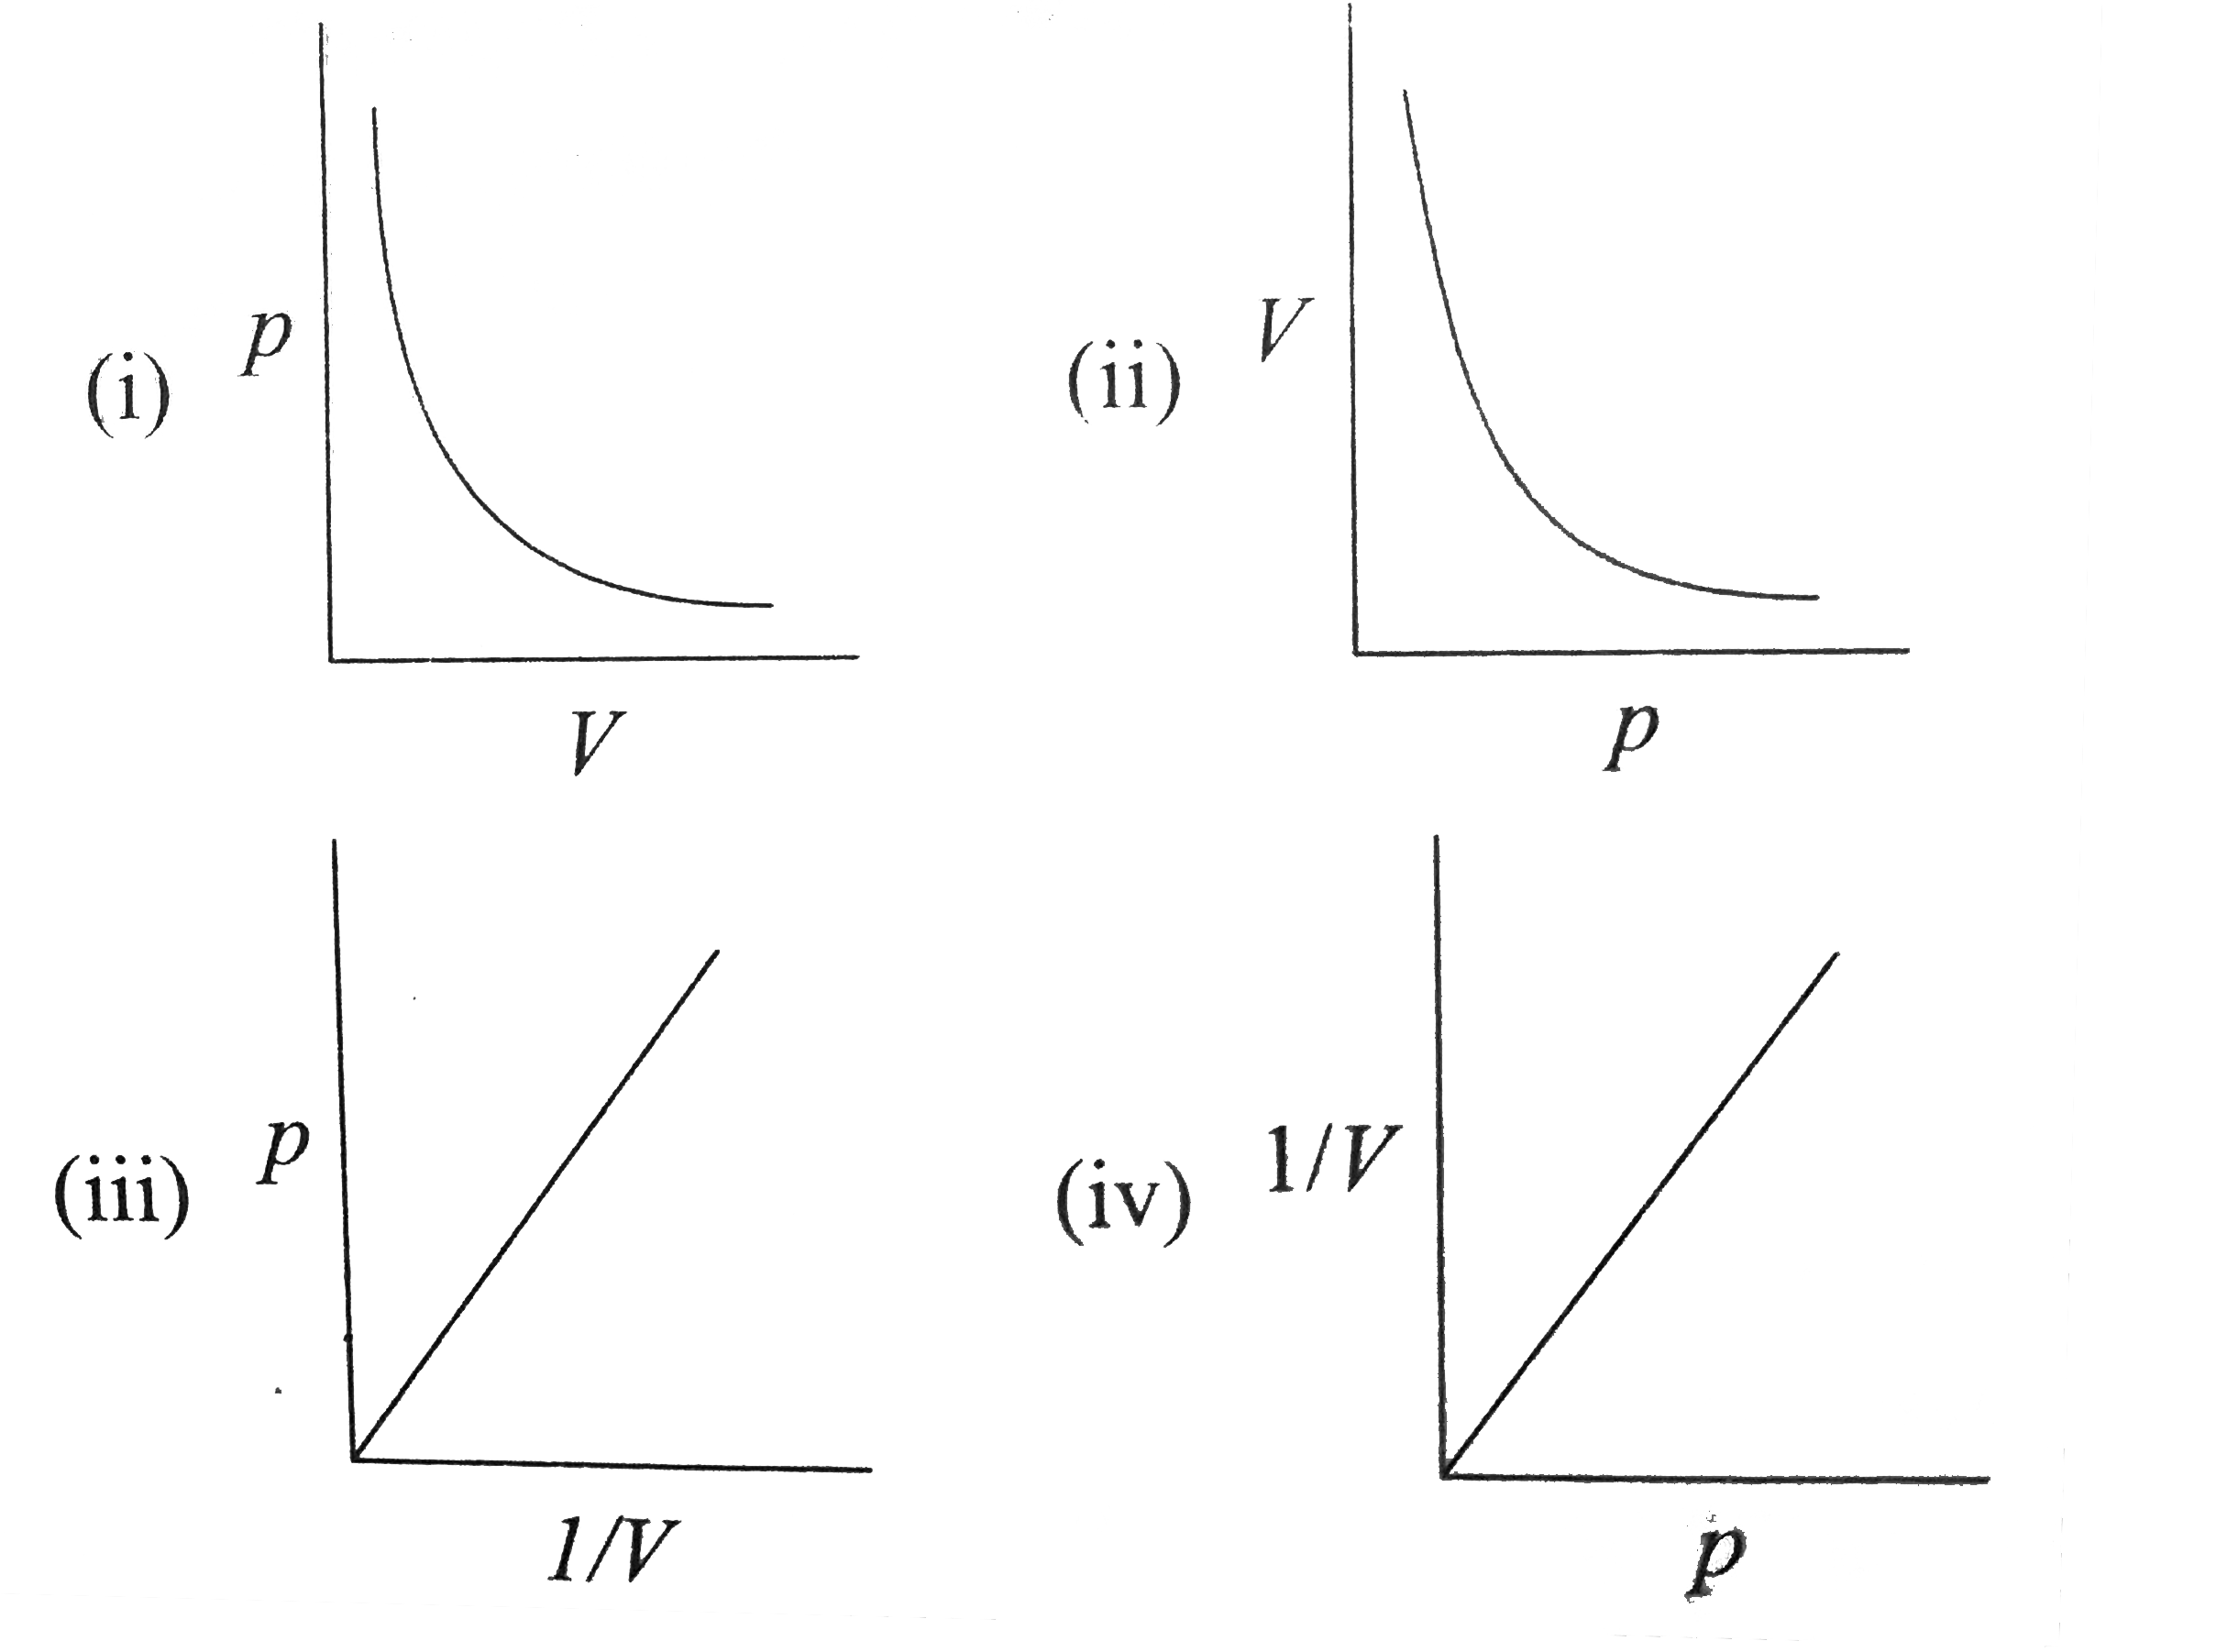
A
(i),(ii),(iii),(iv)
B
(i),(iii)
C
(ii),(iv)
D
(ii),(iii)
Video Solution
Text Solution
The correct Answer is:A
Because at constant n and T, (i) the pressure of a gas is inversely proportional to its volume, (ii) the volume of a gas inversely proportional to the applied pressure, and (iii) , (iv) the pressure is directly proportional to the volume.
|
Topper's Solved these Questions
- STATES OF MATTERBOOK - R SHARMACHAPTER - STATES OF MATTEREXERCISE - Follow -up Test 4
6 Videos
- STATES OF MATTERBOOK - R SHARMACHAPTER - STATES OF MATTEREXERCISE - Follow -up Test 5
8 Videos
- STATES OF MATTERBOOK - R SHARMACHAPTER - STATES OF MATTEREXERCISE - Follow -up Test 2
14 Videos
- SOME BASIC CONCEPTS OF CHEMISTRYBOOK - R SHARMACHAPTER - SOME BASIC CONCEPTS OF CHEMISTRYEXERCISE - Archives
26 Videos
- STRUCTURE OF ATOMBOOK - R SHARMACHAPTER - STRUCTURE OF ATOMEXERCISE - ARCHIVES
55 Videos
Similar Questions
Knowledge Check
Which of the following graph represents Boyle's law ?
A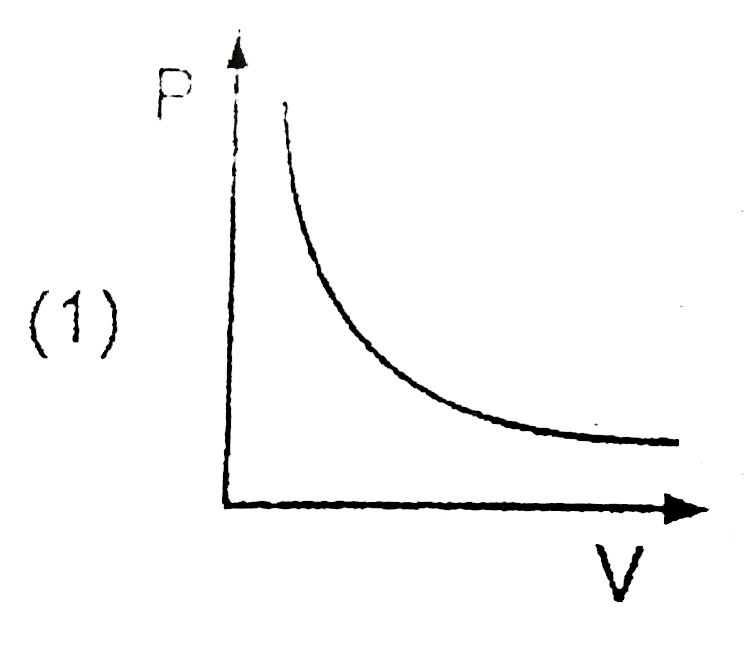 B
B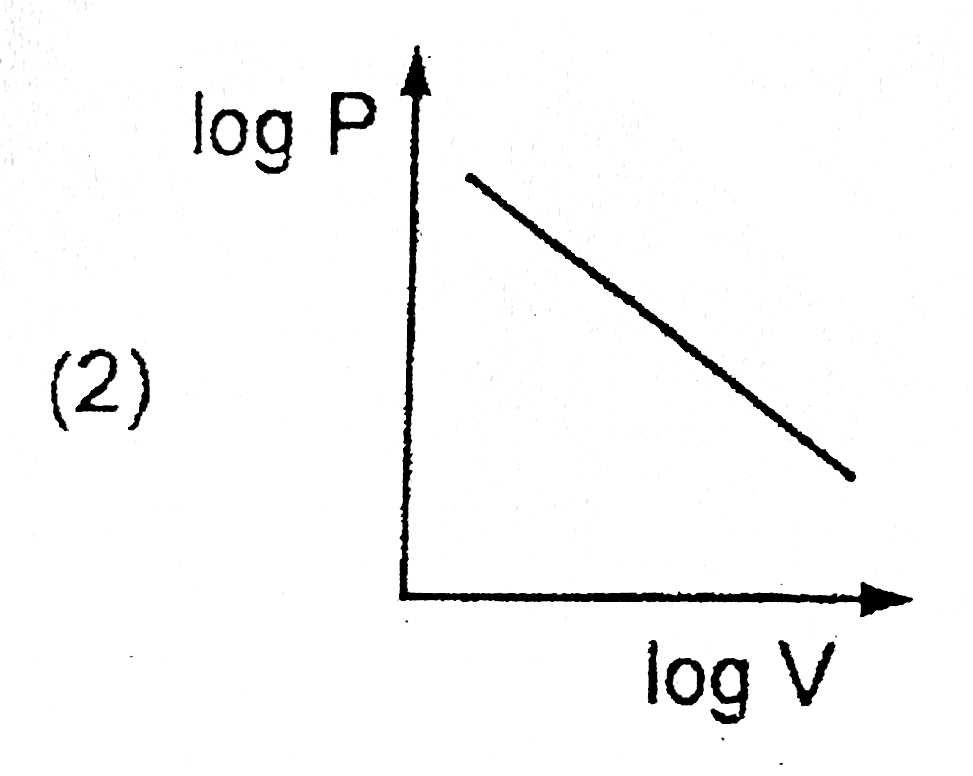 C
C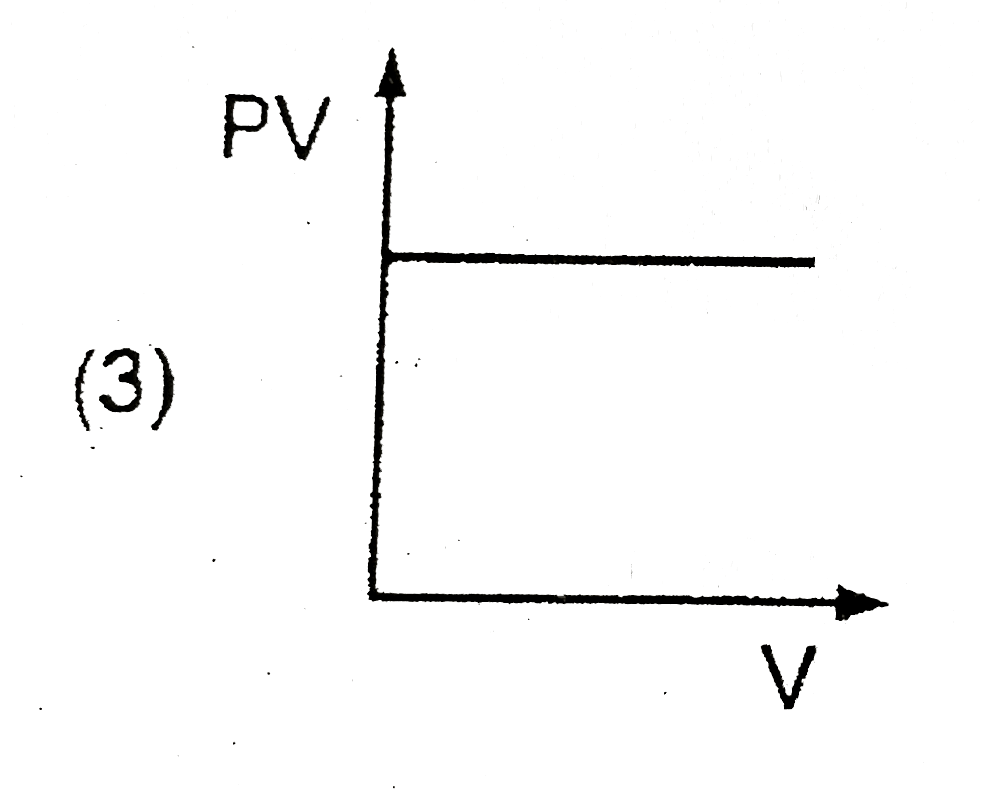 DAll of these
Which of the following graph represent Boyle's law ?
A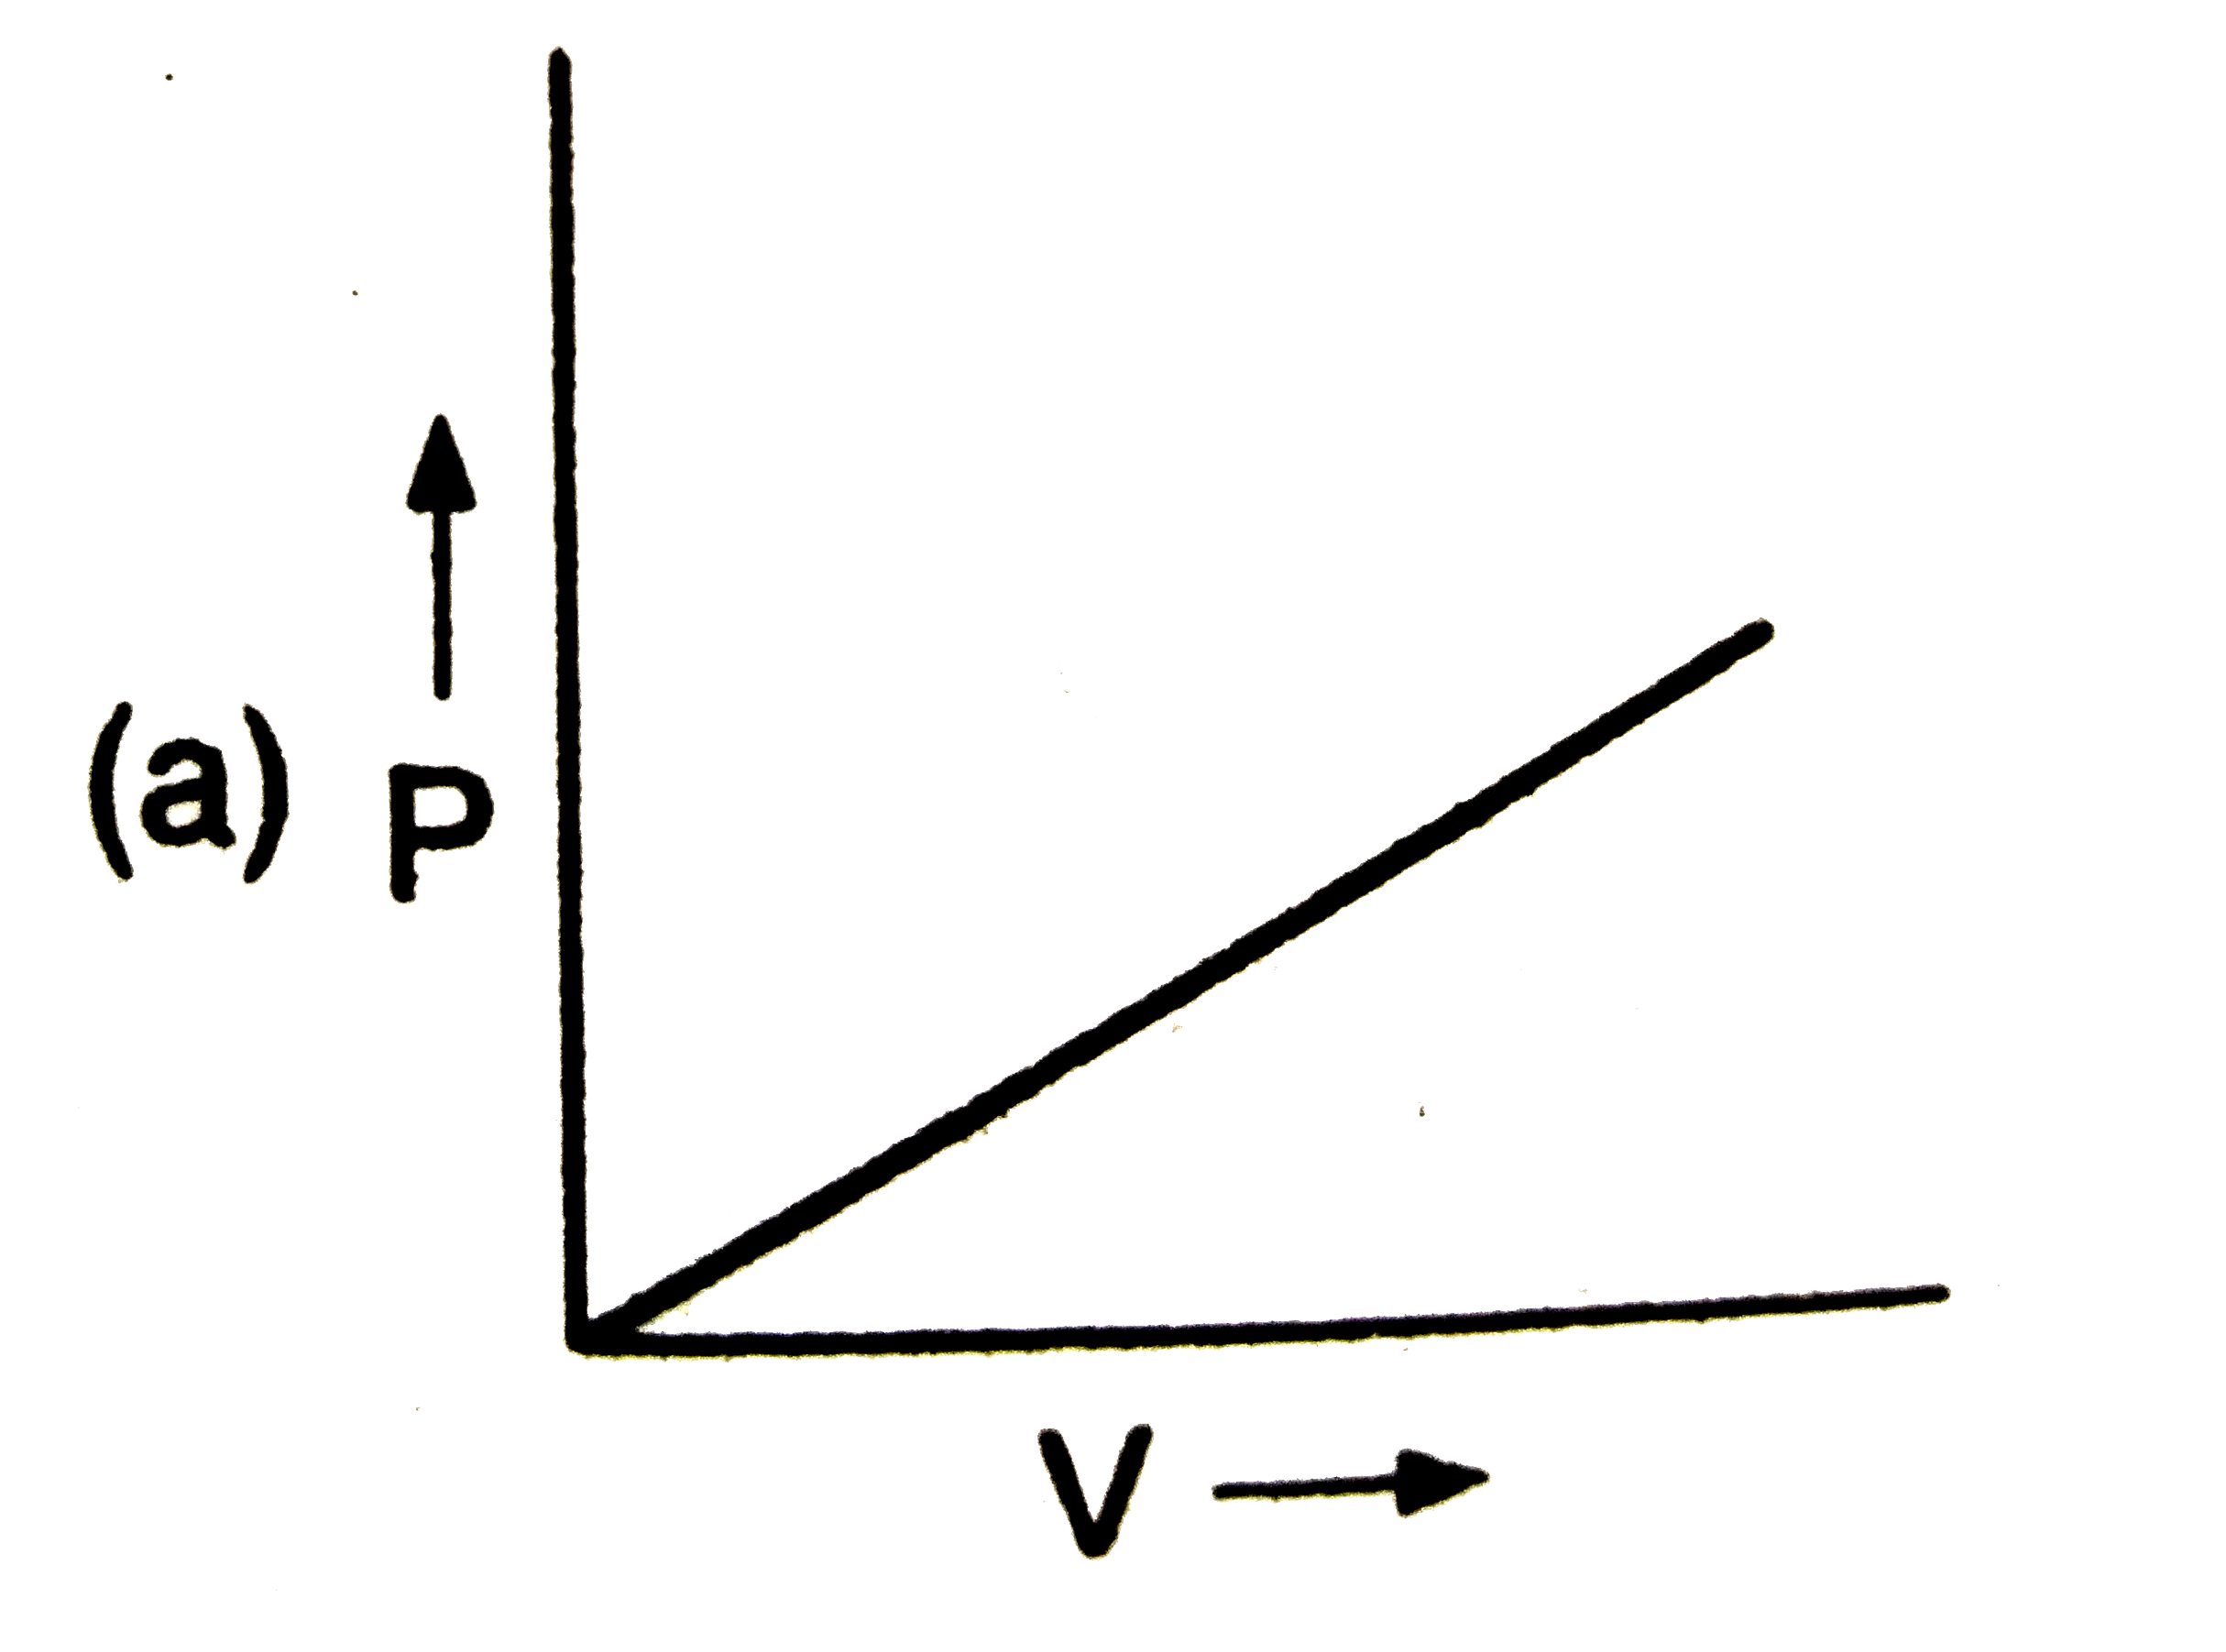 B
B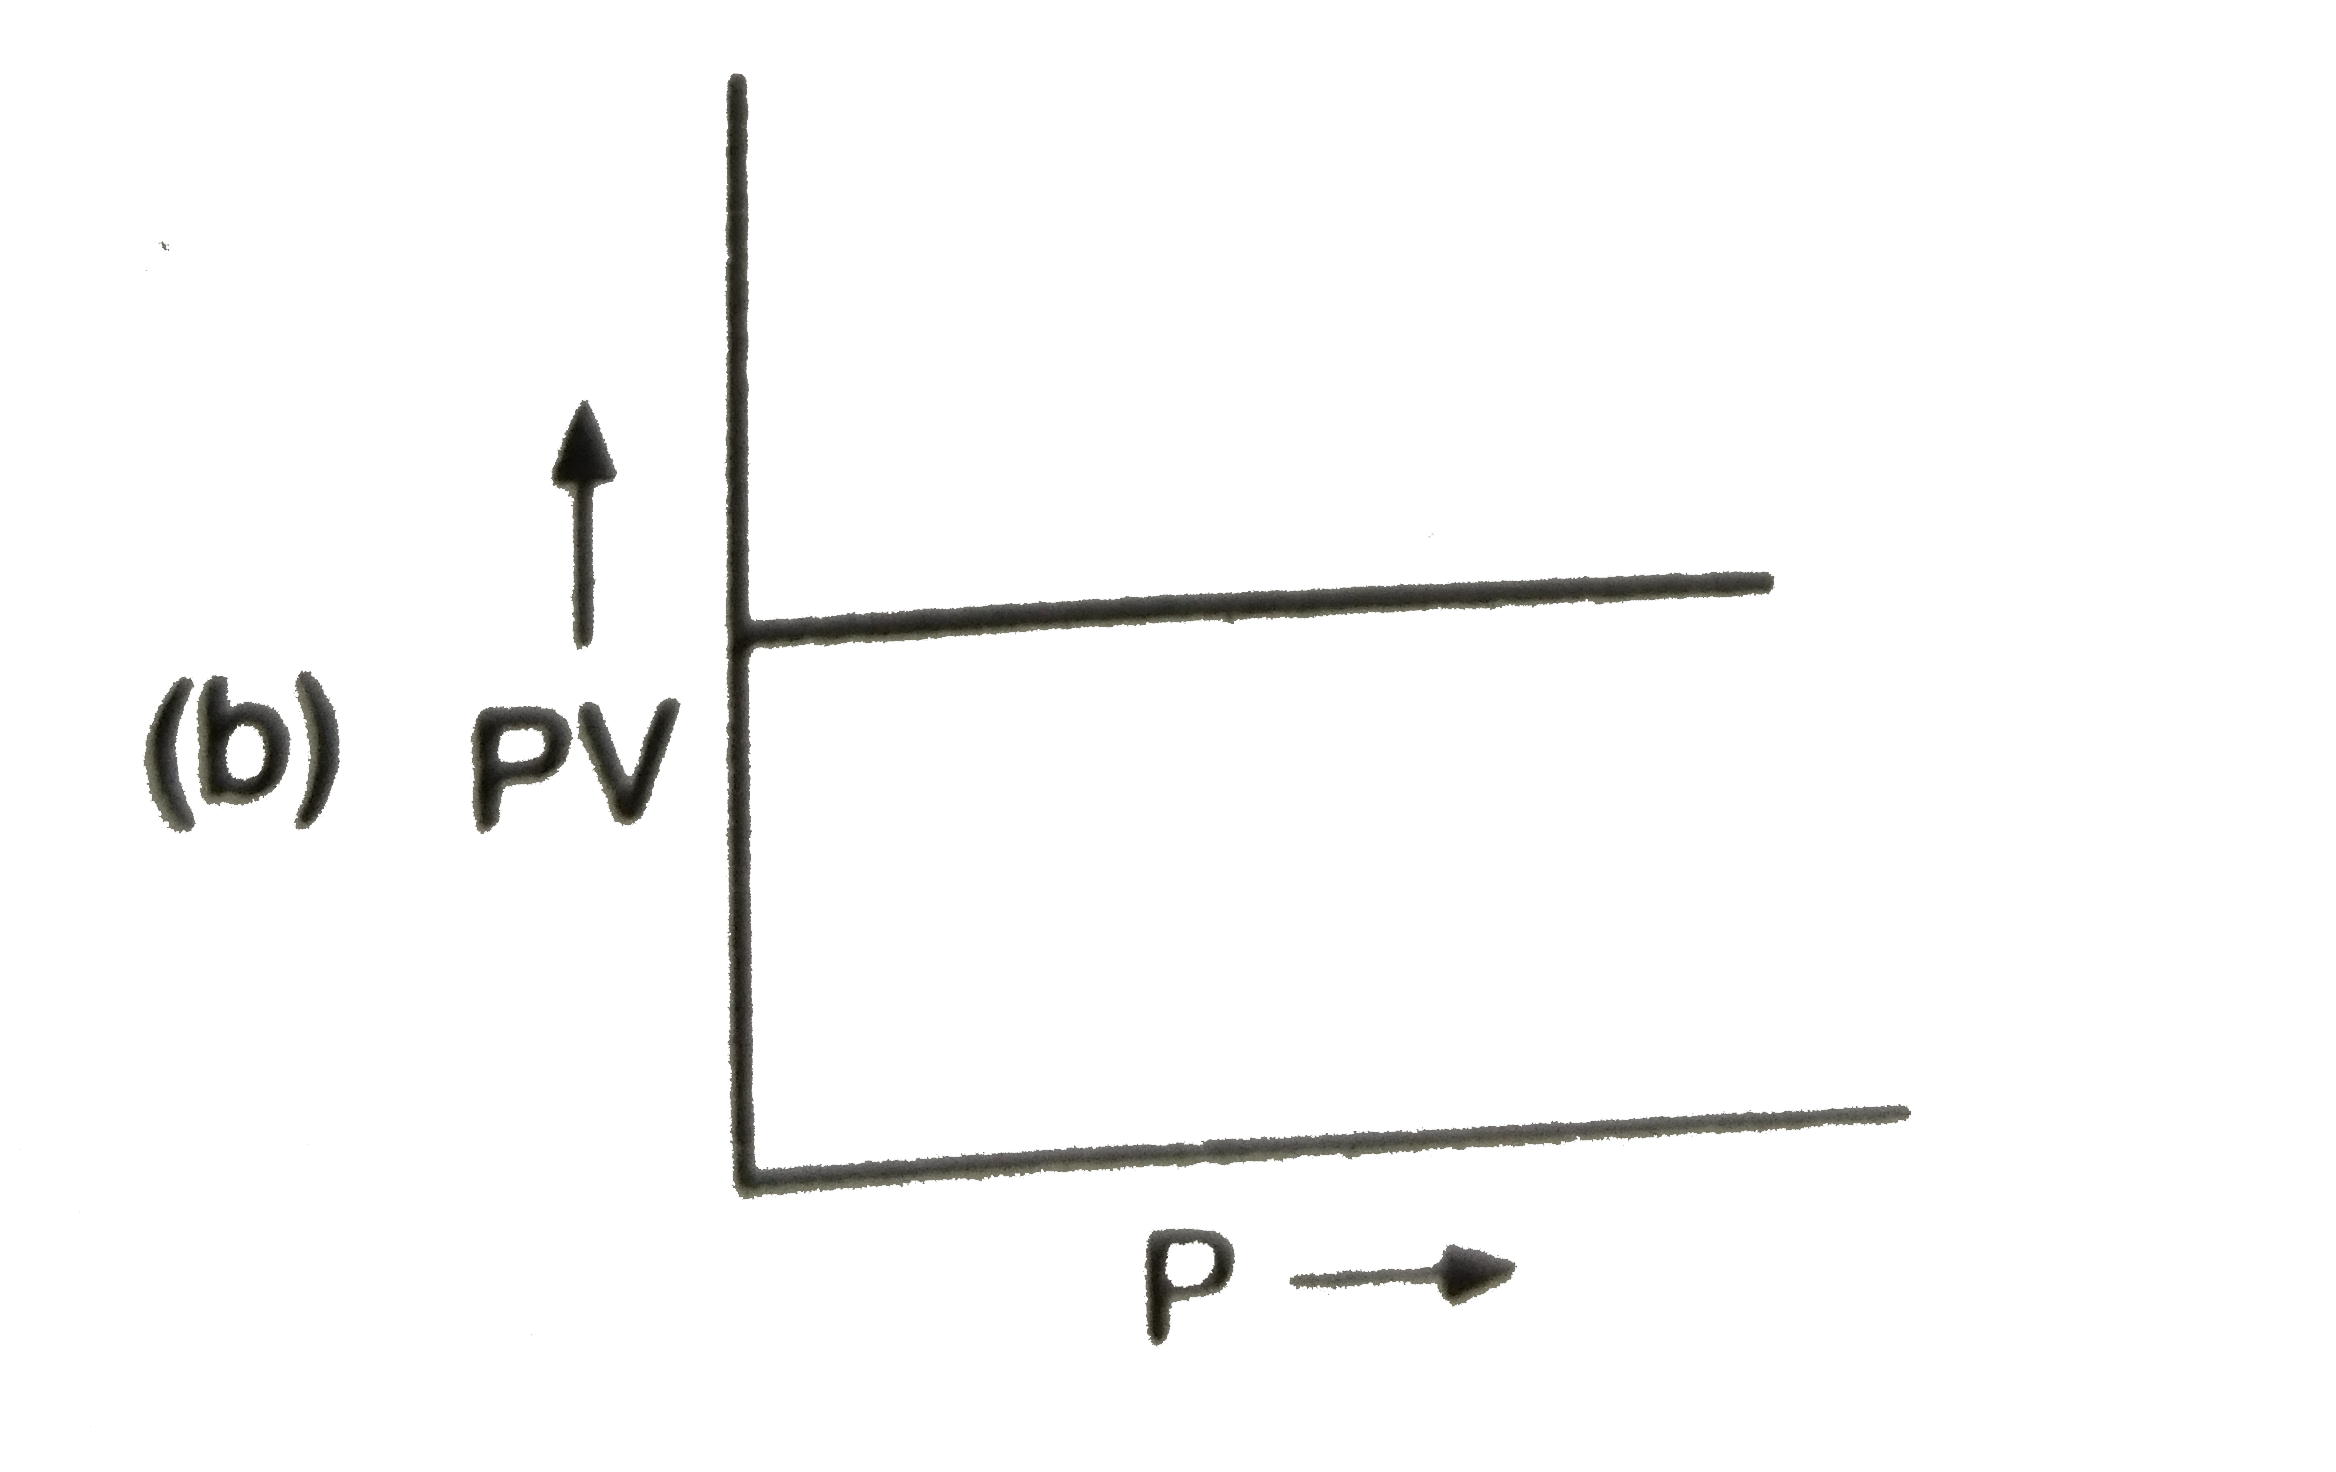 C
C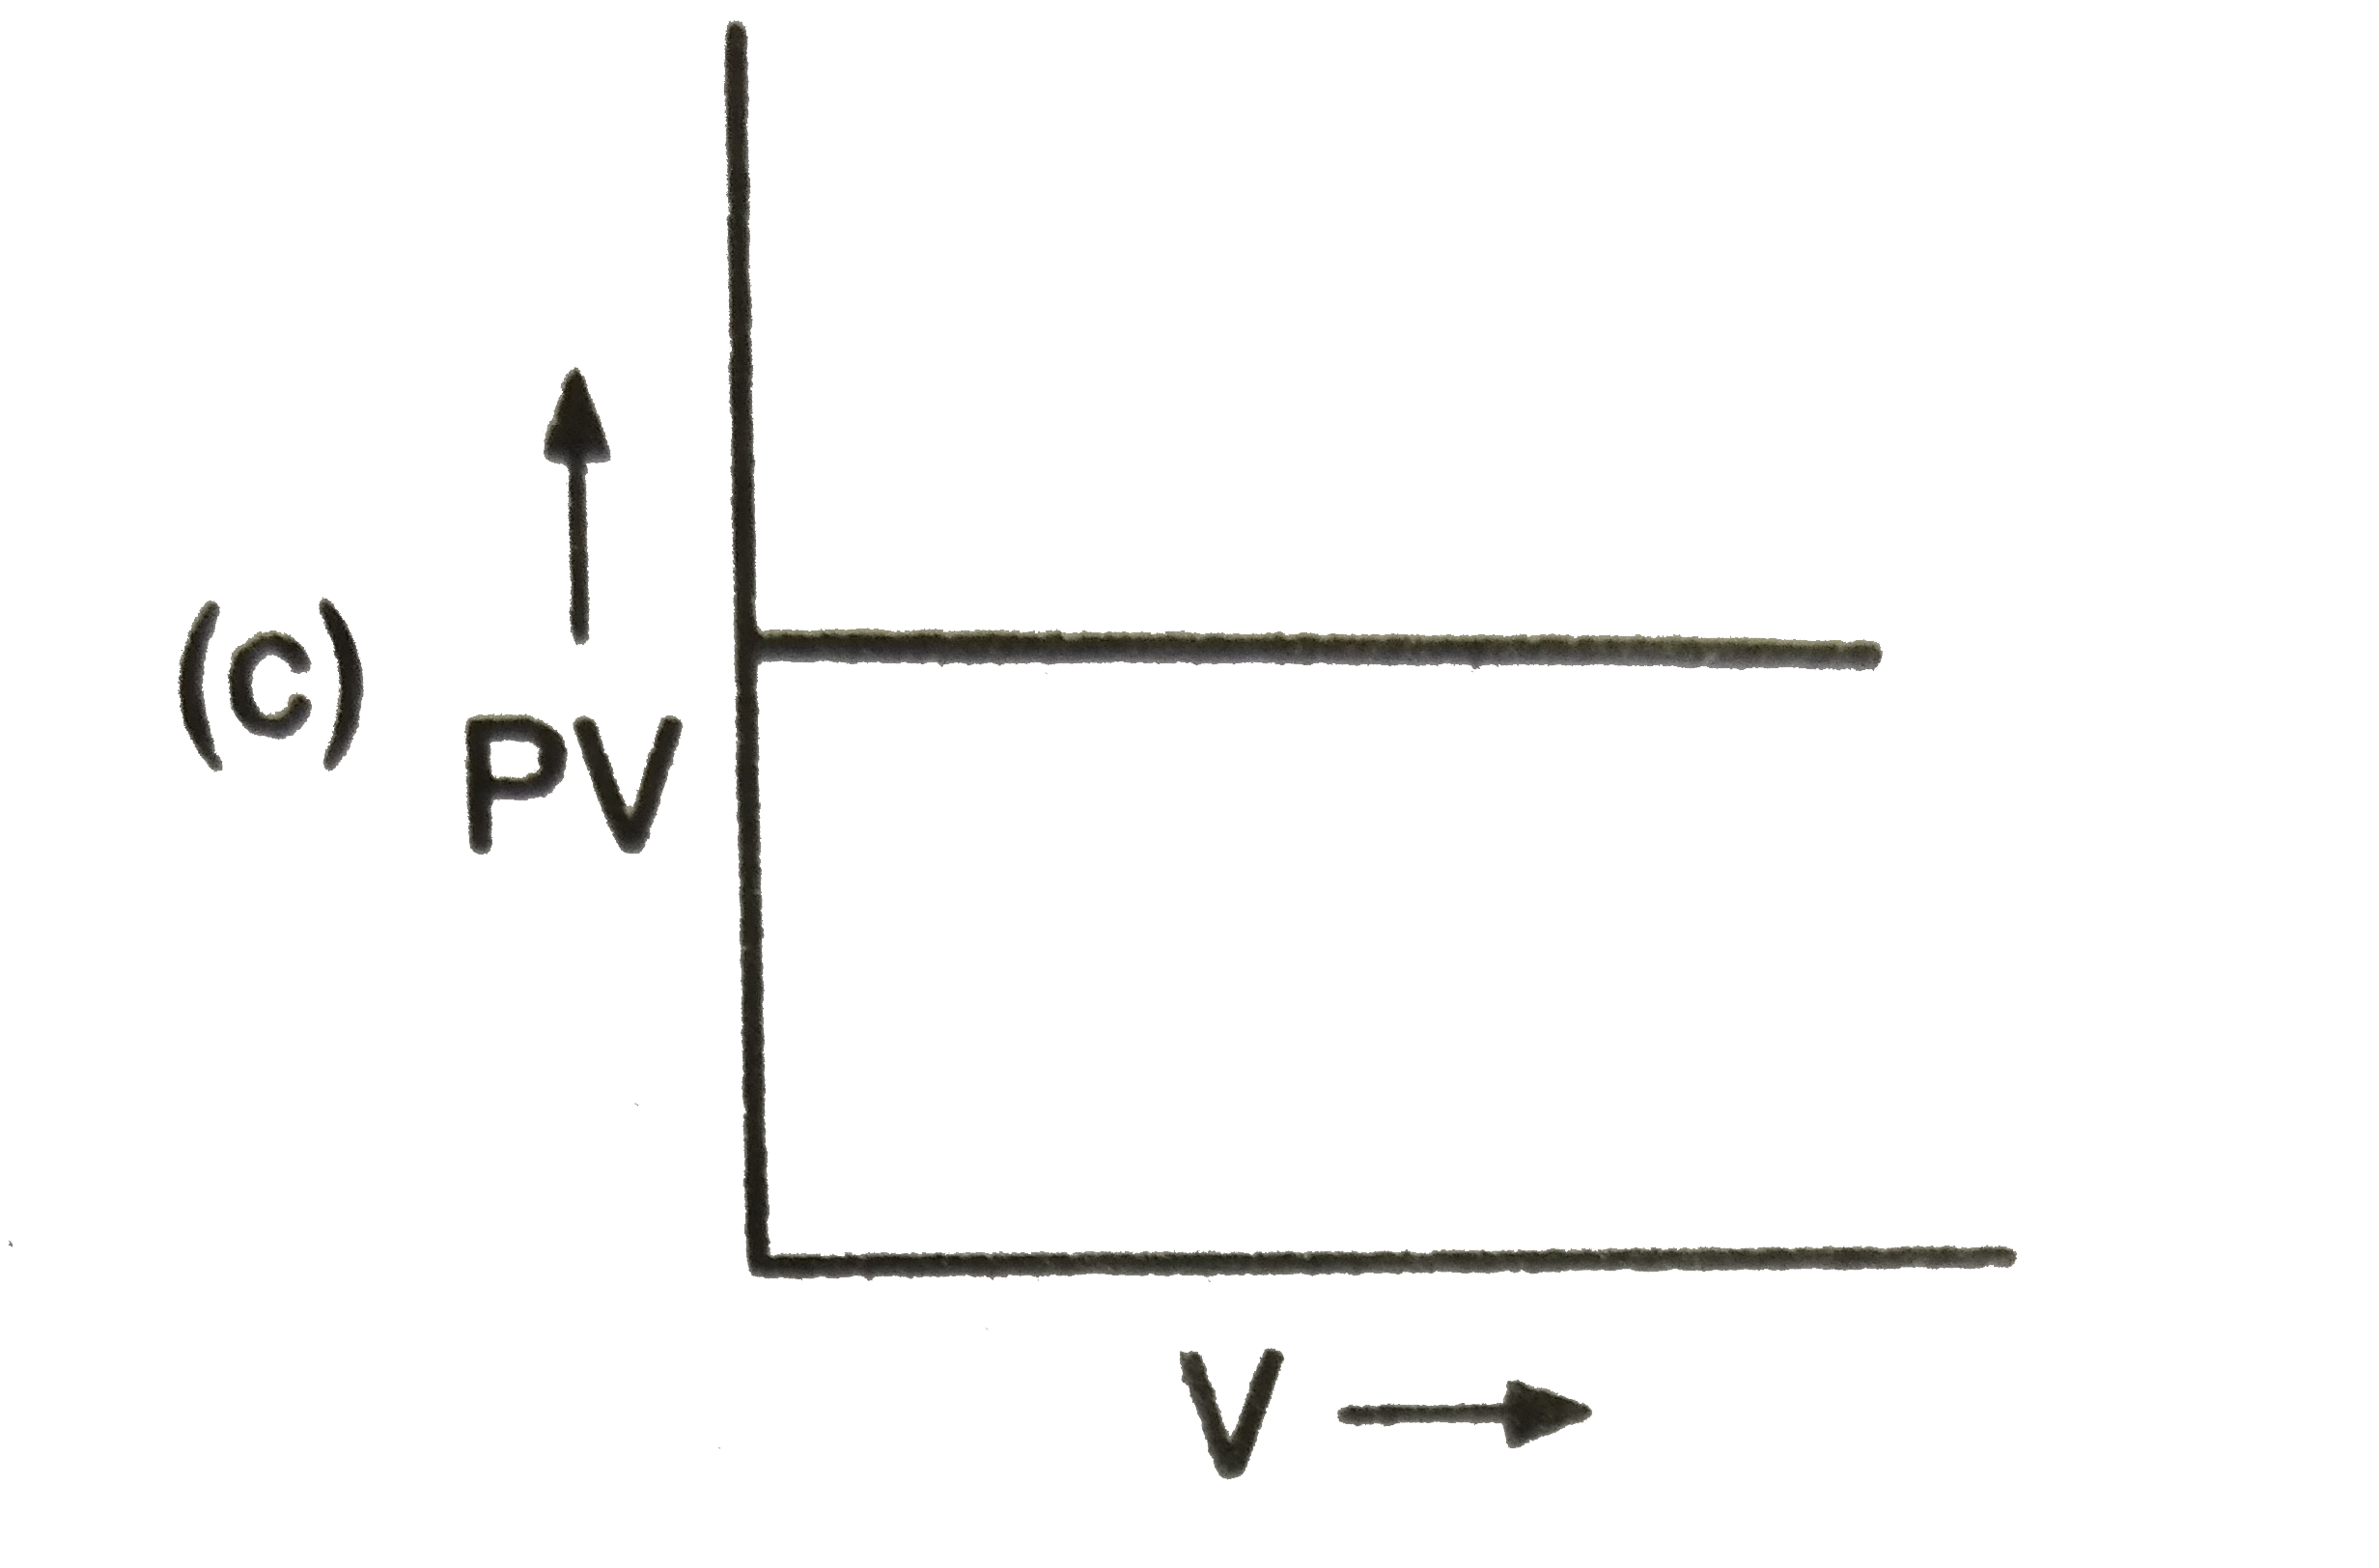 D
D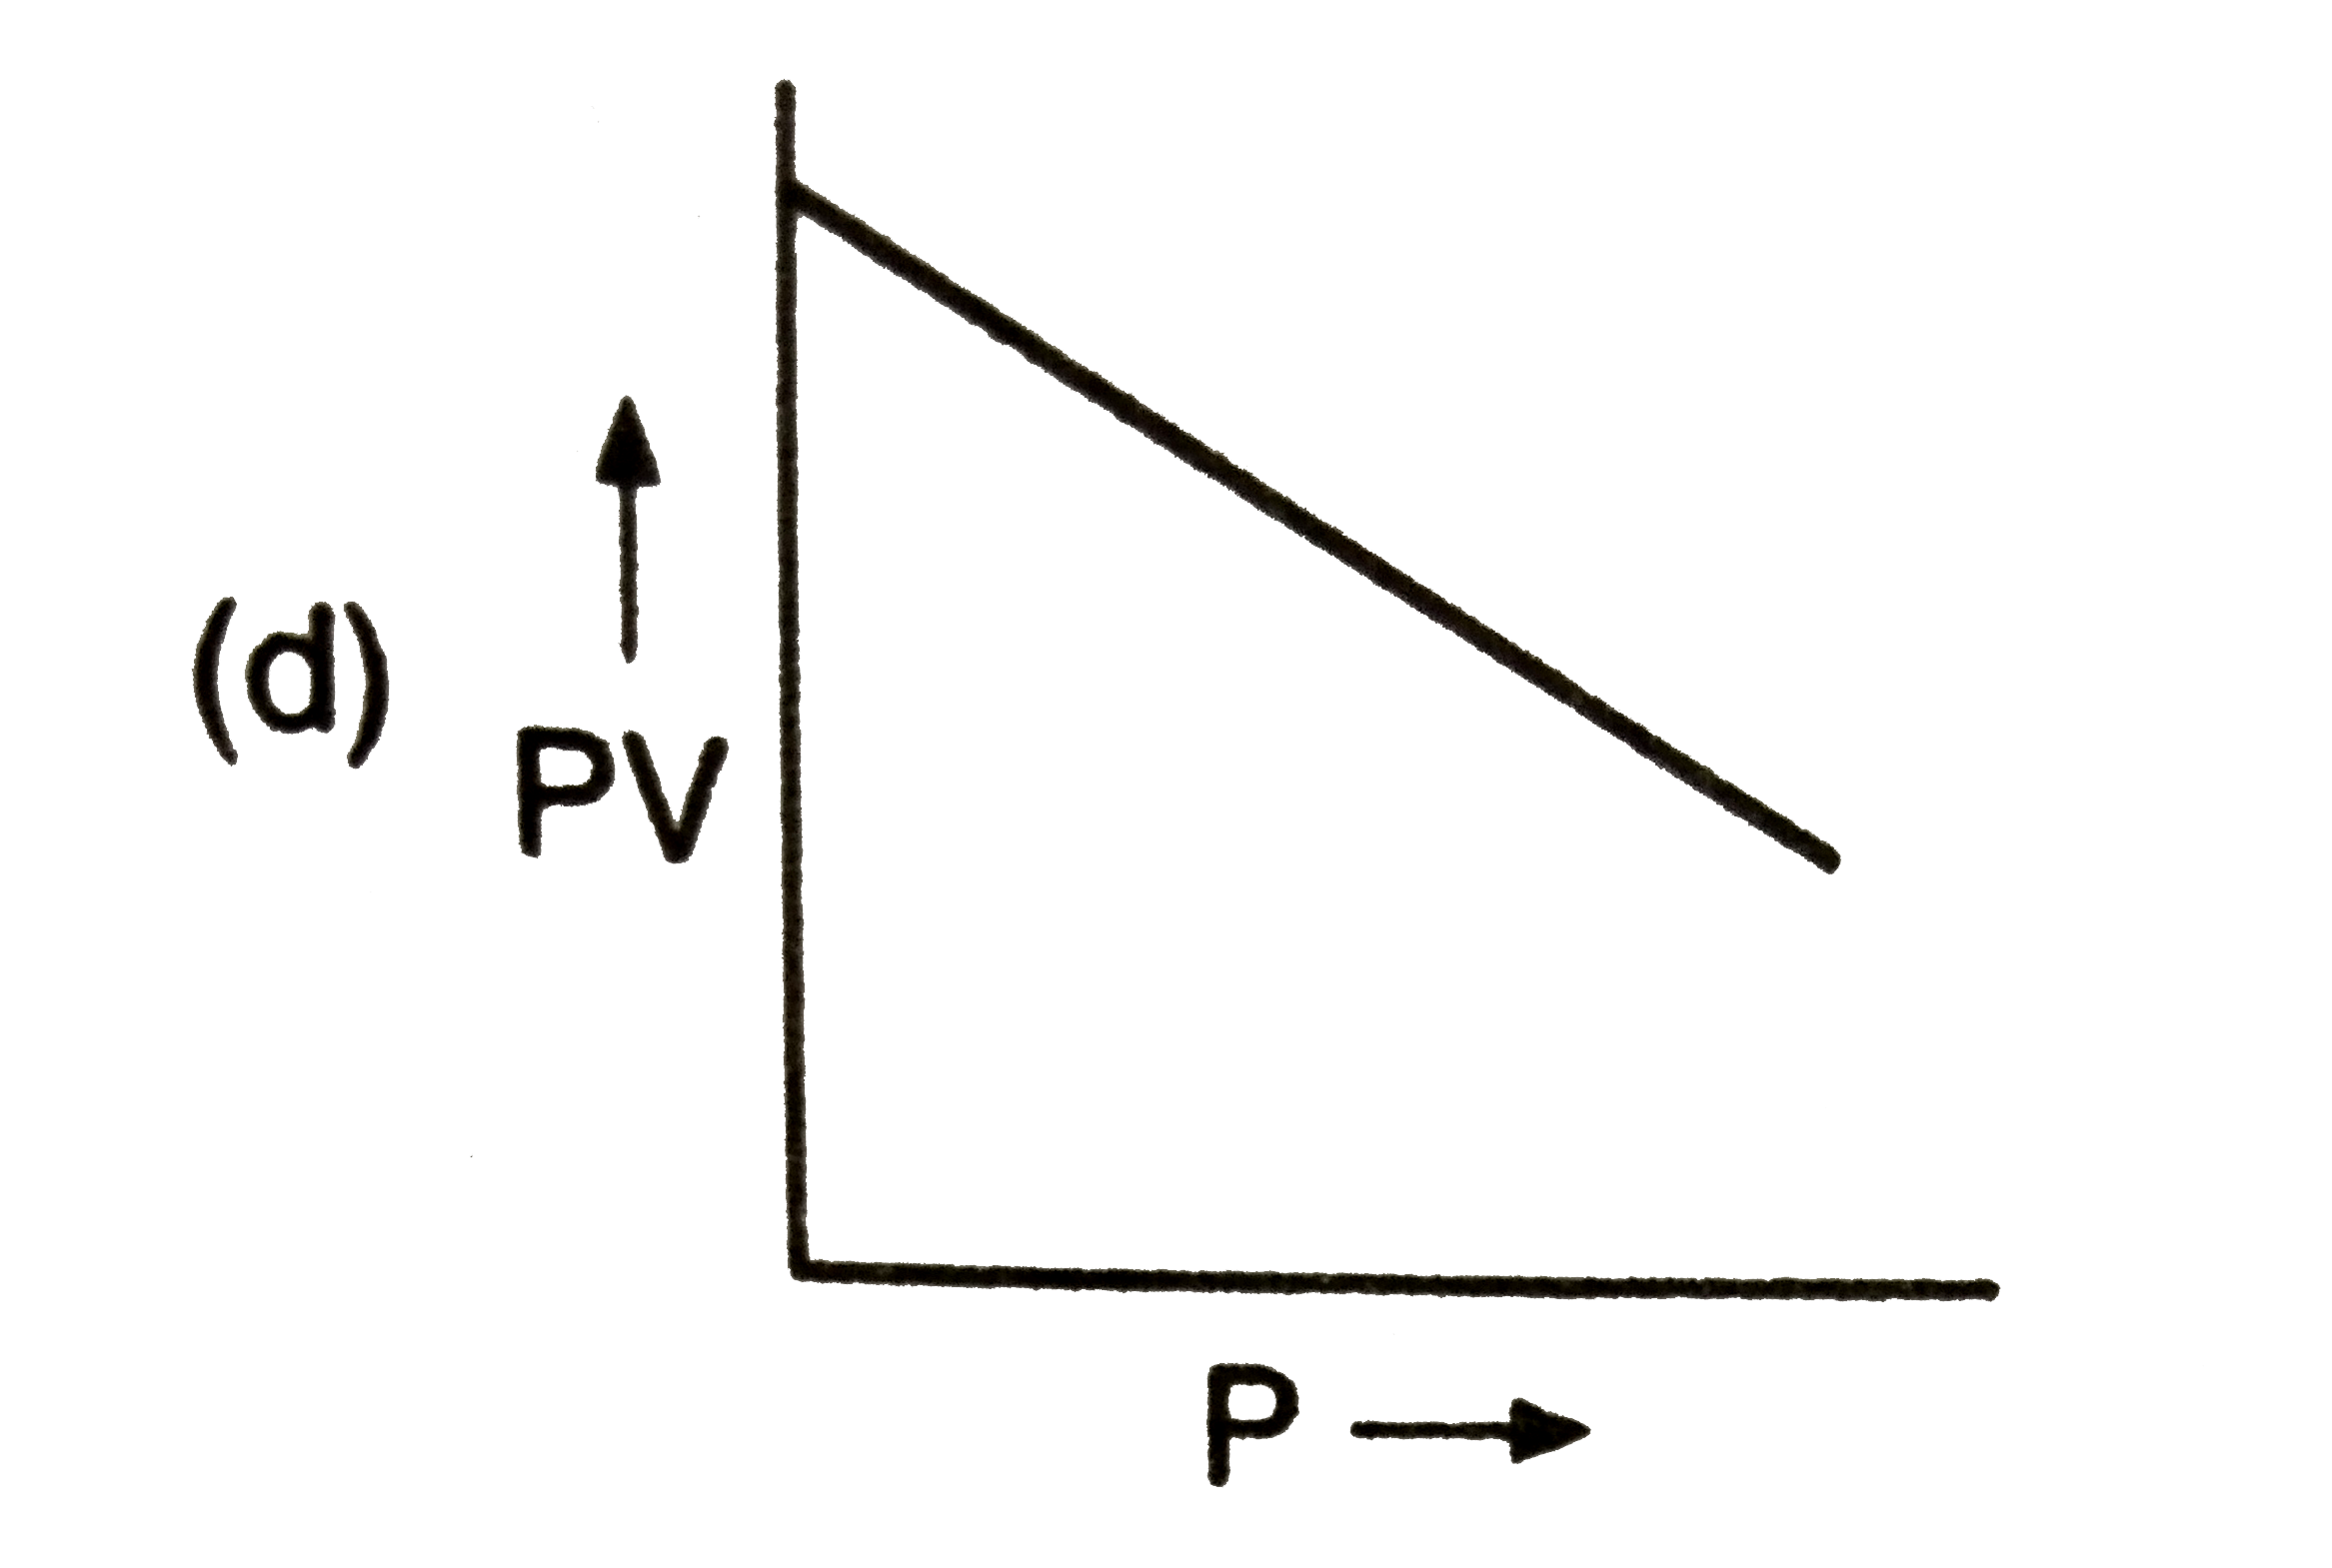
Which of the following graph represents Boyle's law ?
A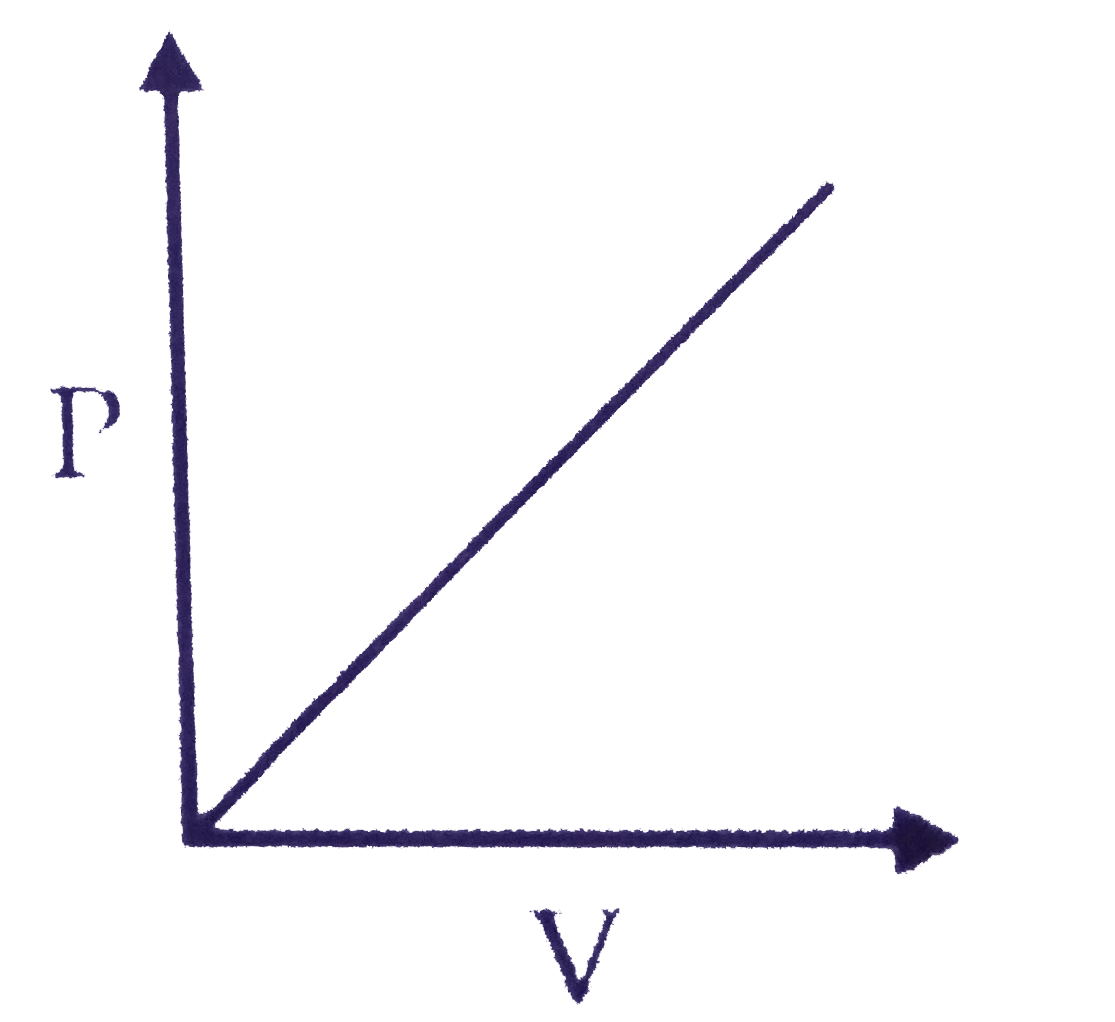 B
B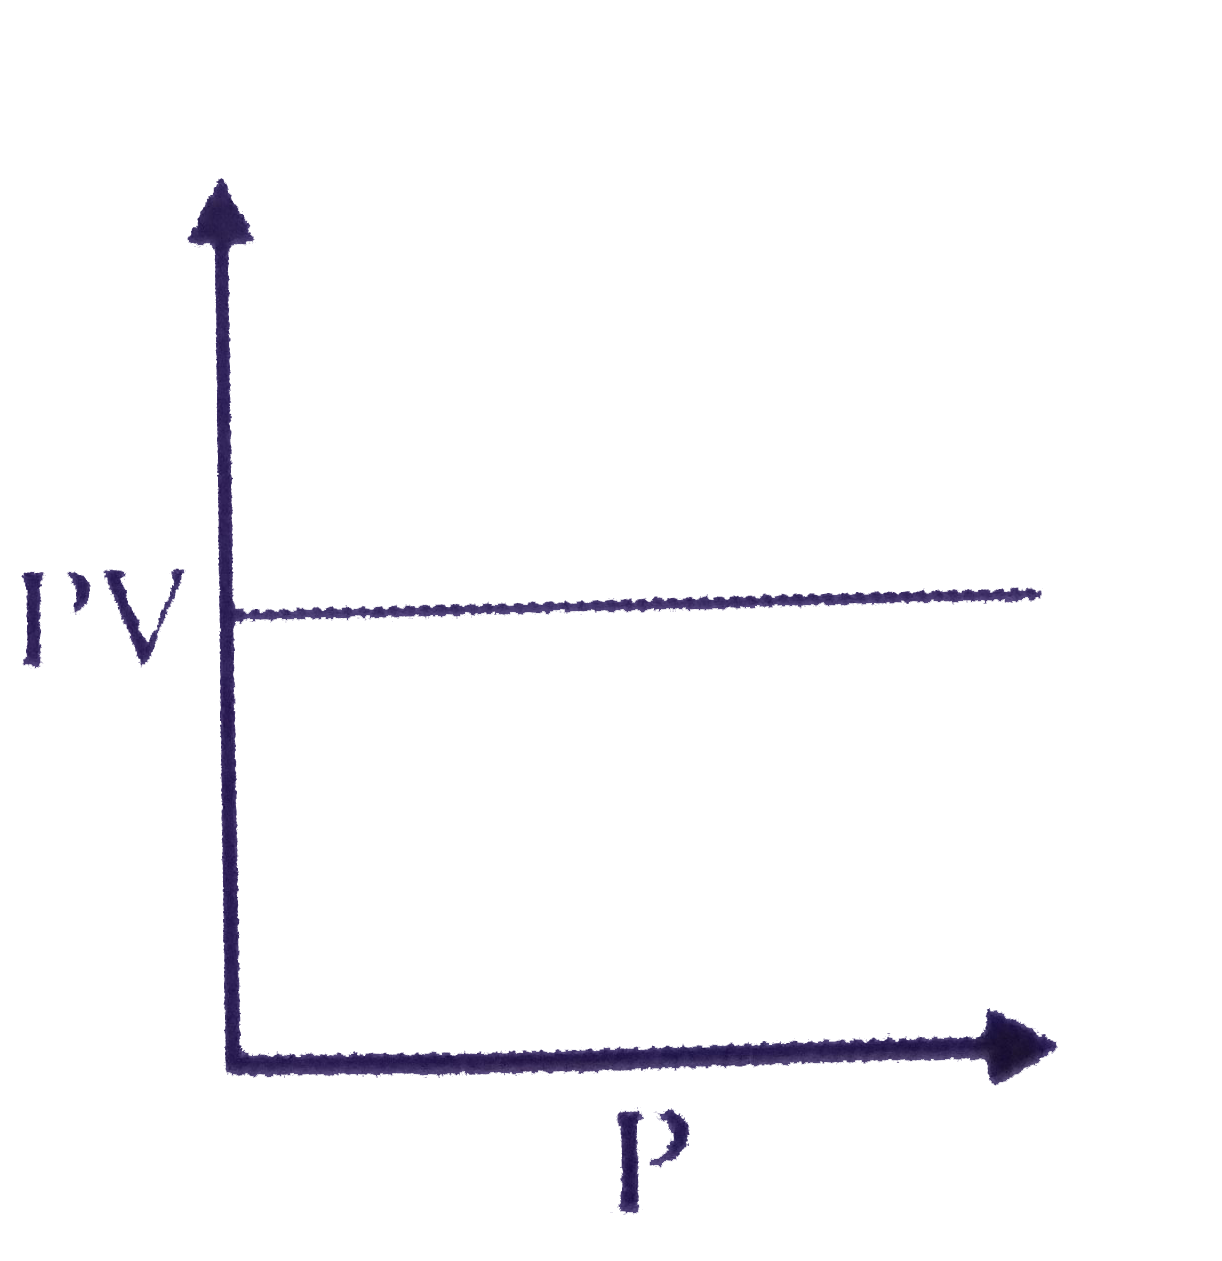 C
C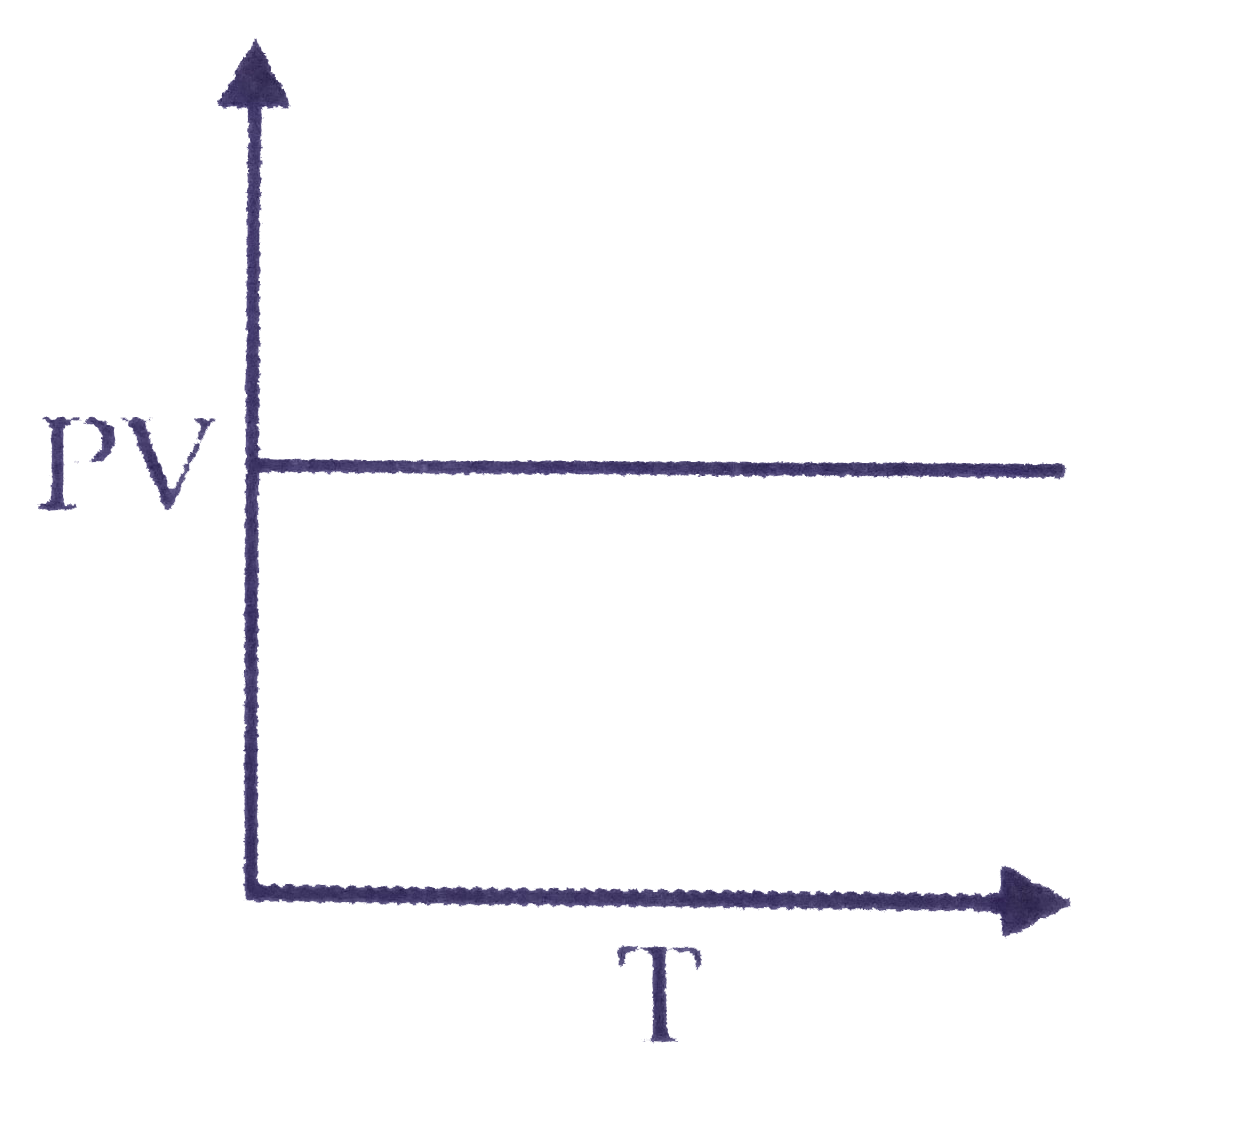 D
D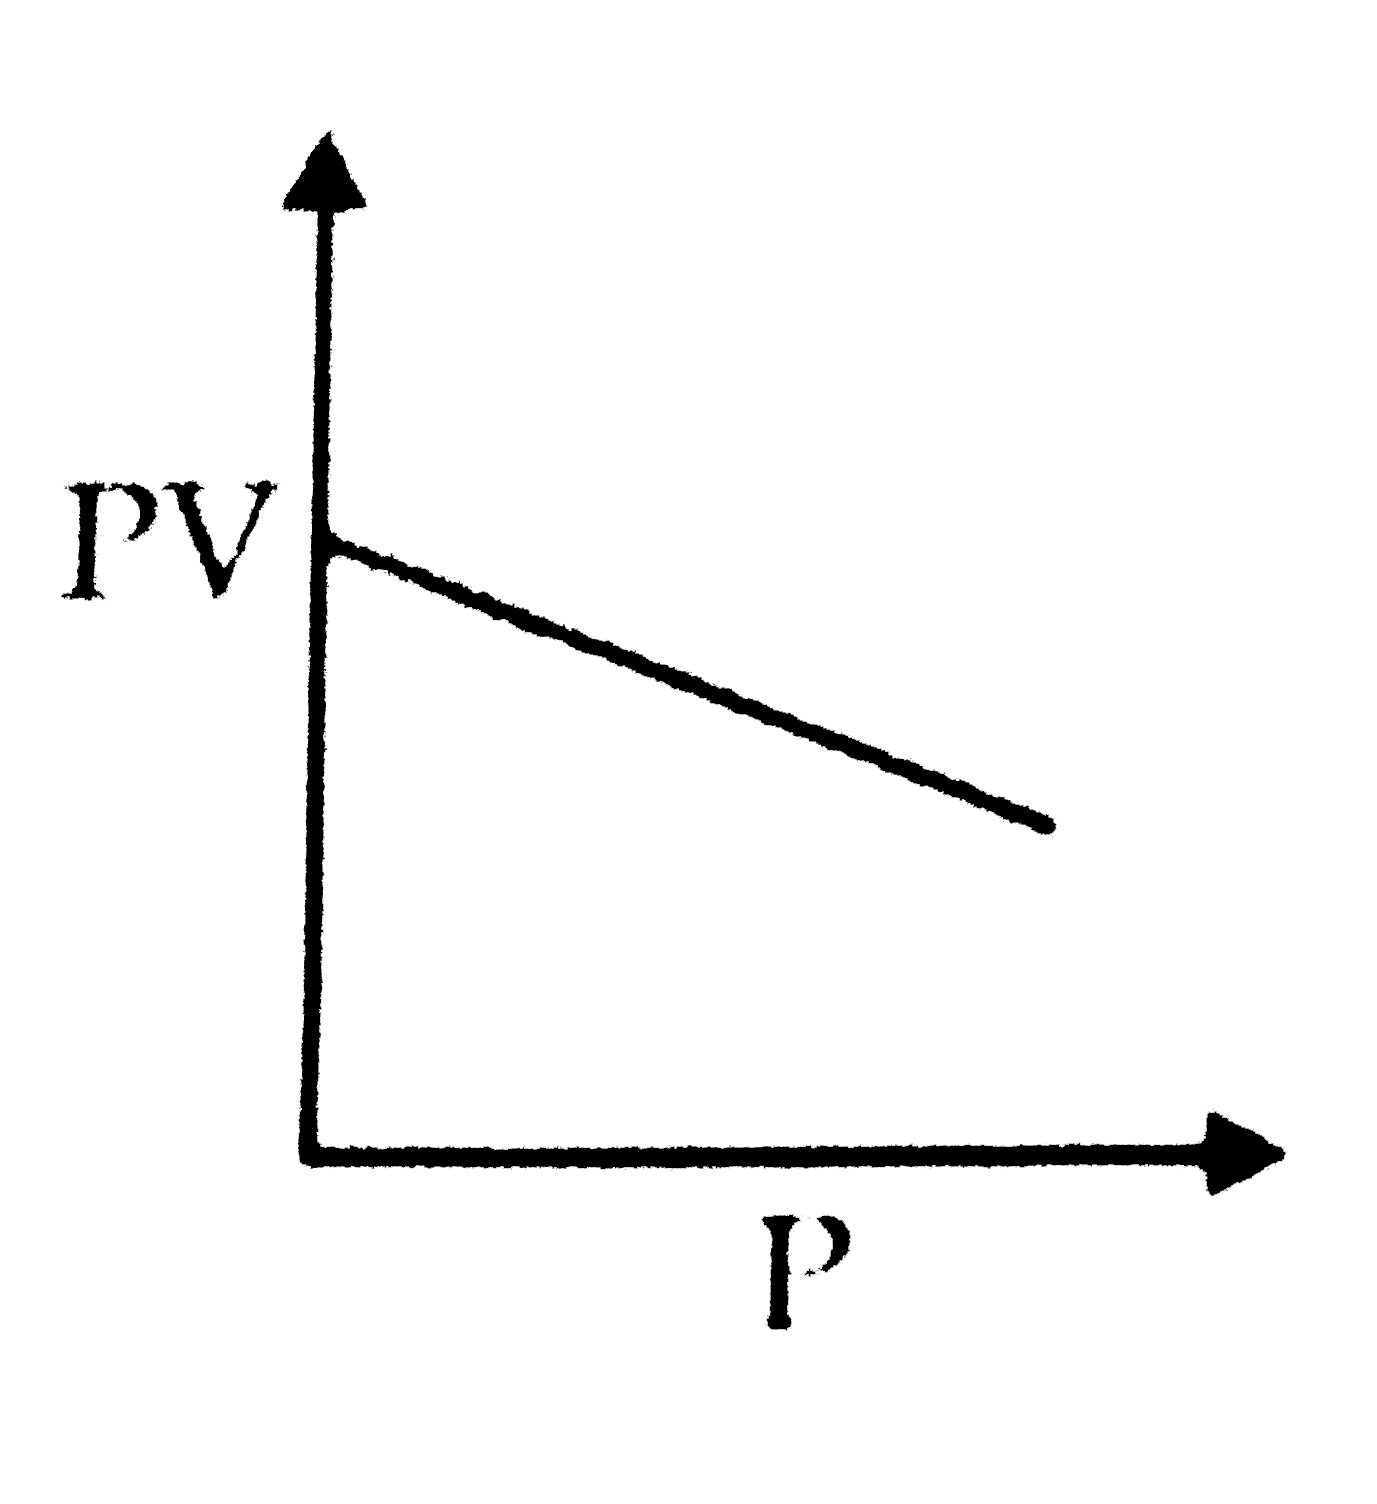
Which of the following curves represent(s) Boyle's law?
View SolutionOne of the following represents the Boyle's law .
View SolutionWhich of the following graphs represents correctly the variations of 0.5mv2max with the intensity of incident radiations of a constant frequency ?
View SolutionWhich of the following plots does not represent Boyle's law?
View SolutionWhich of the following curve does not represent Boyle's law?
View Solution
