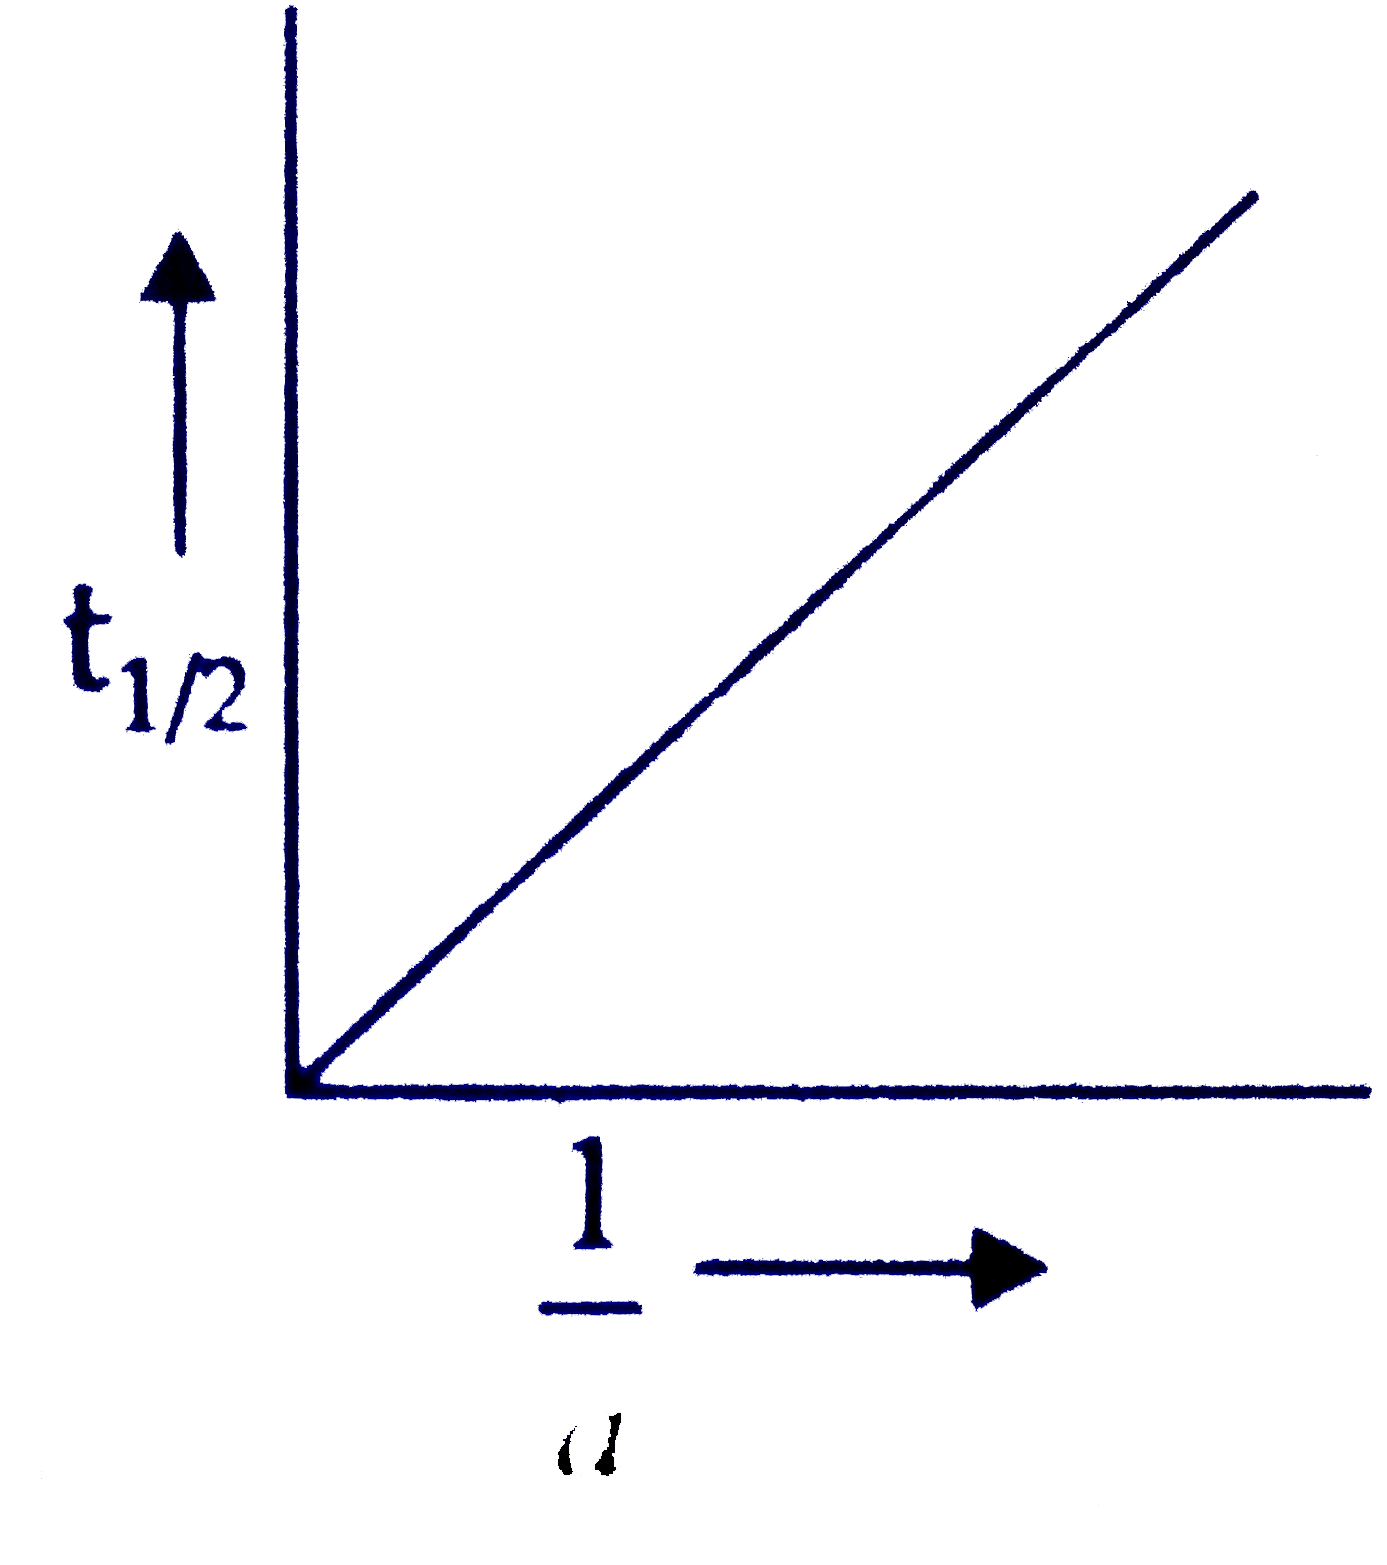
Which of the following graphs formed plotted between t1/2 and initial concentration (a) represents a zero order reaction ?
A

B

C
D

Video Solution
Text Solution
t1/2∝a for a zero order reaction .
|
Topper's Solved these Questions
Similar Questions
Knowledge Check
The plot that represents the zero order reaction is:
A B
B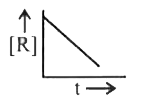 C
C D
D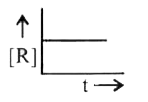
Which of the following represents zero order reaction ?
A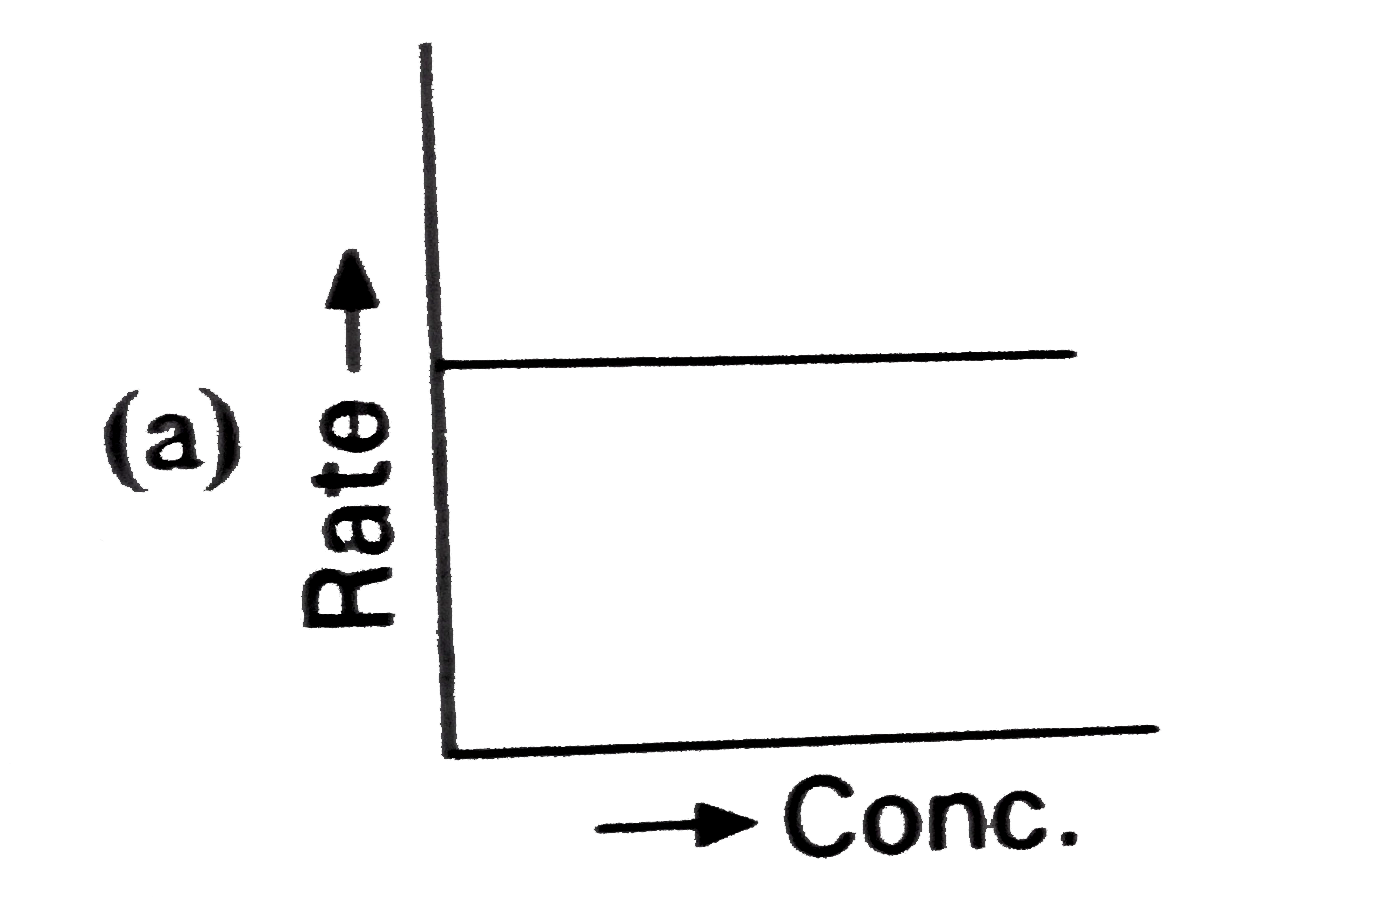 B
B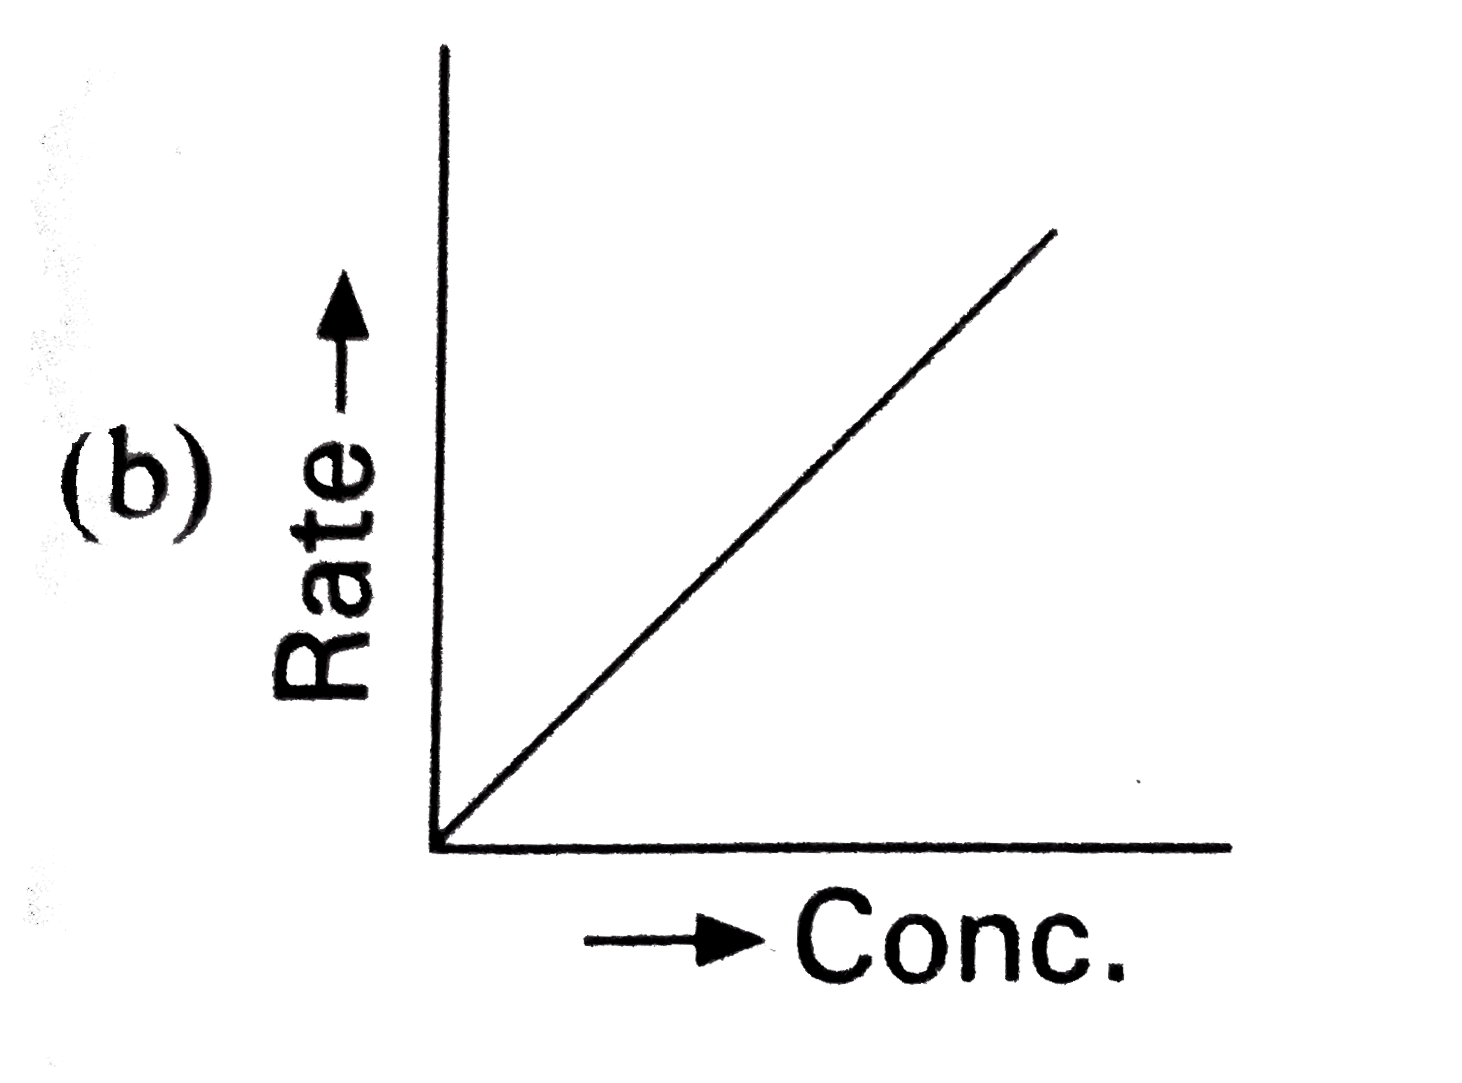 C
C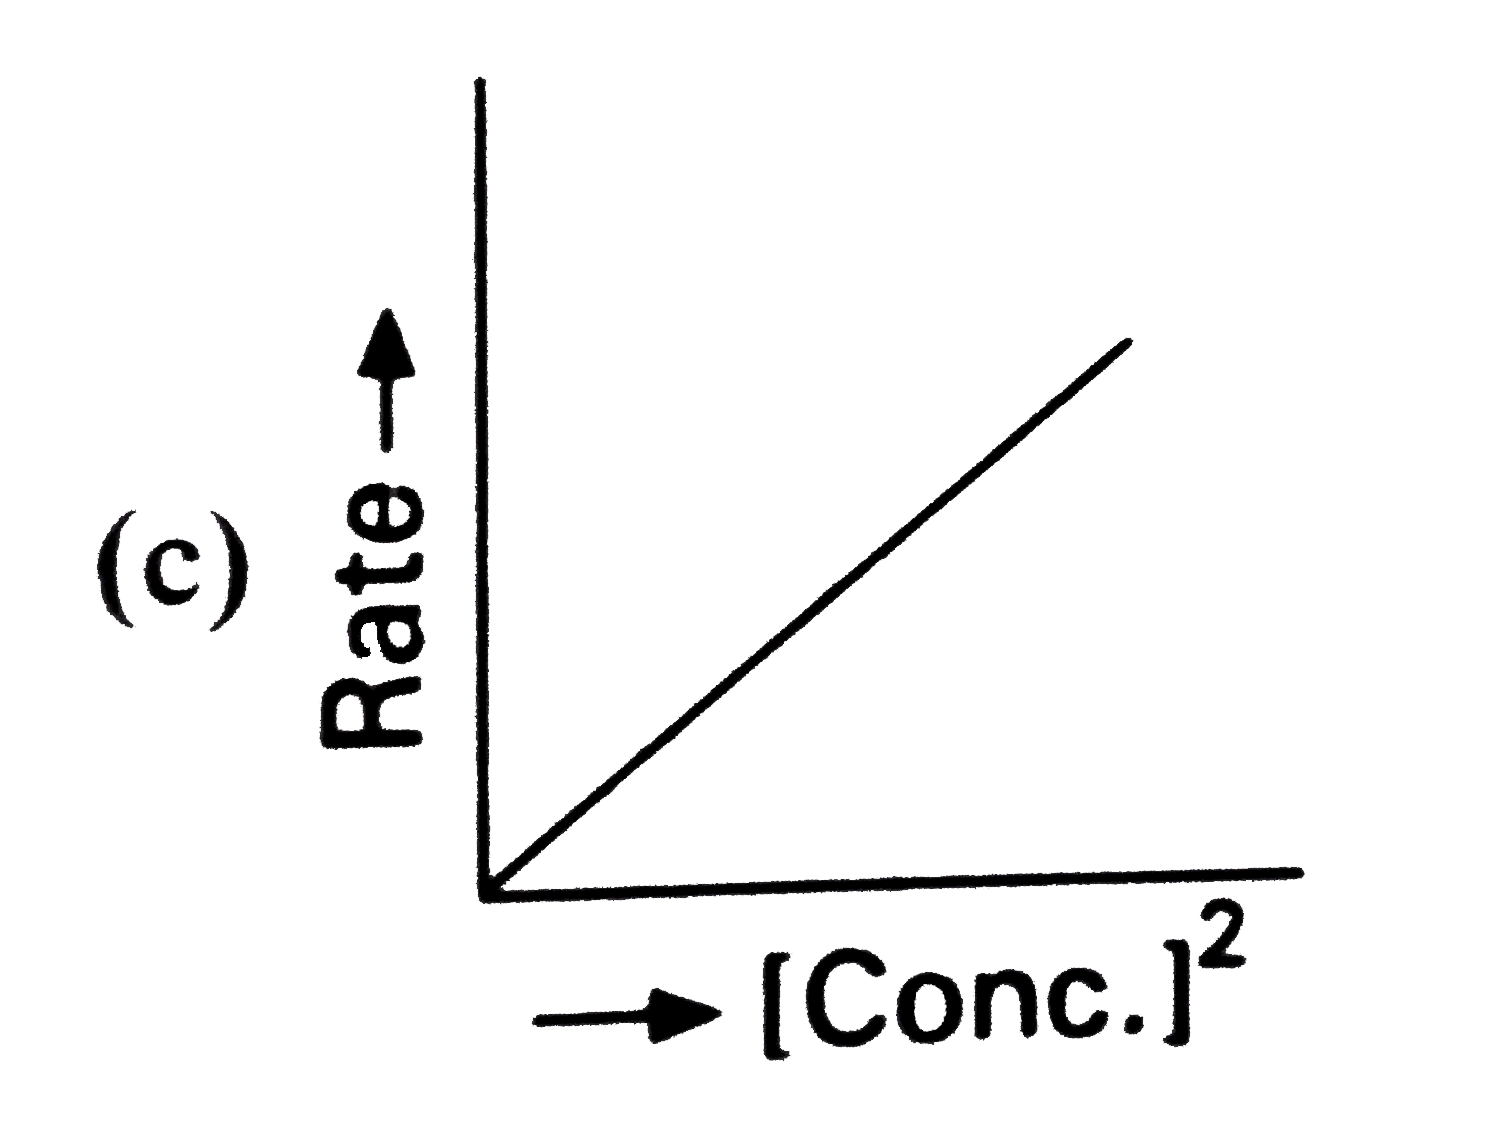 D
D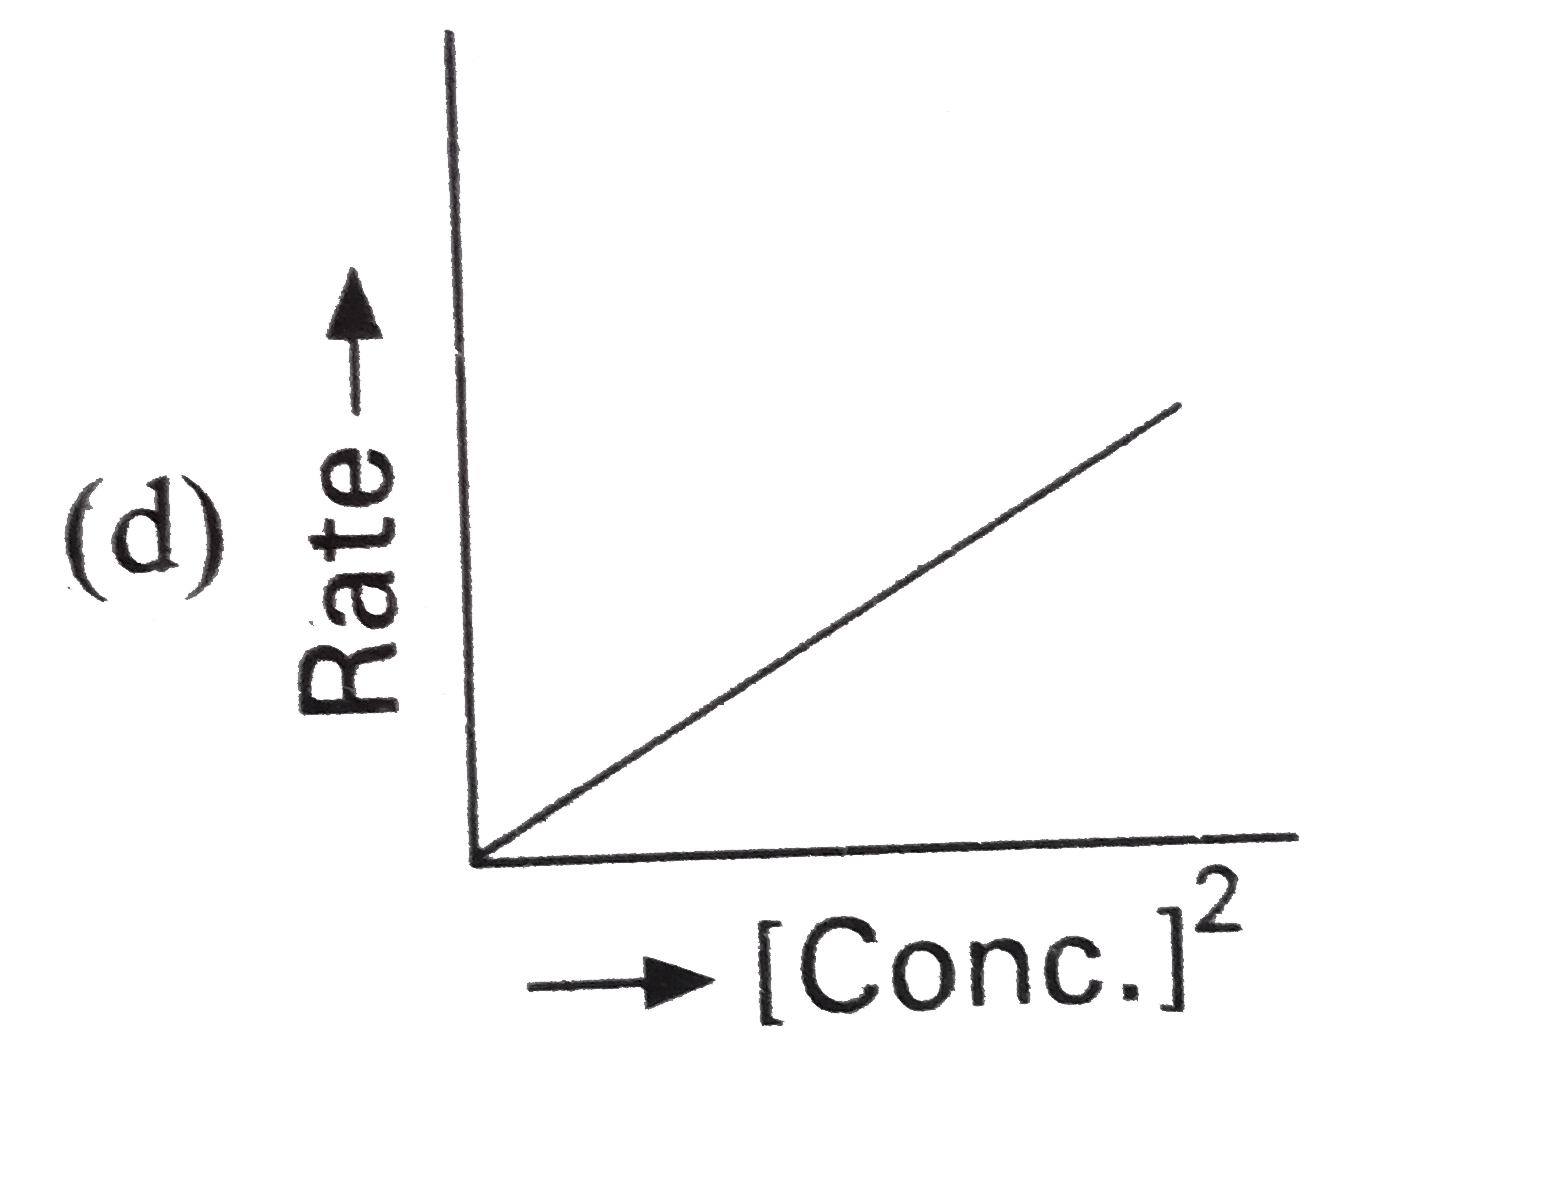
Which of the following graphs is not for zero order reaction?
A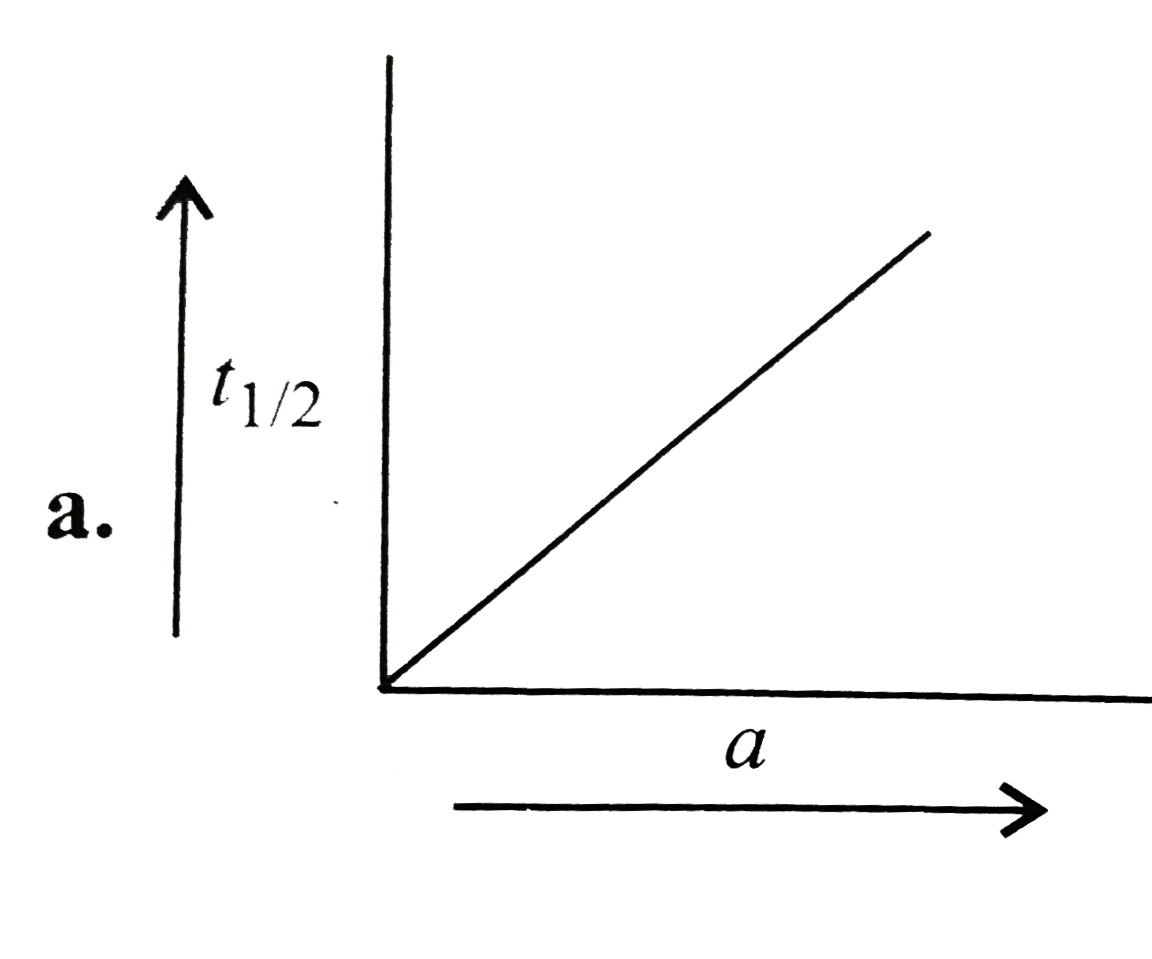 B
B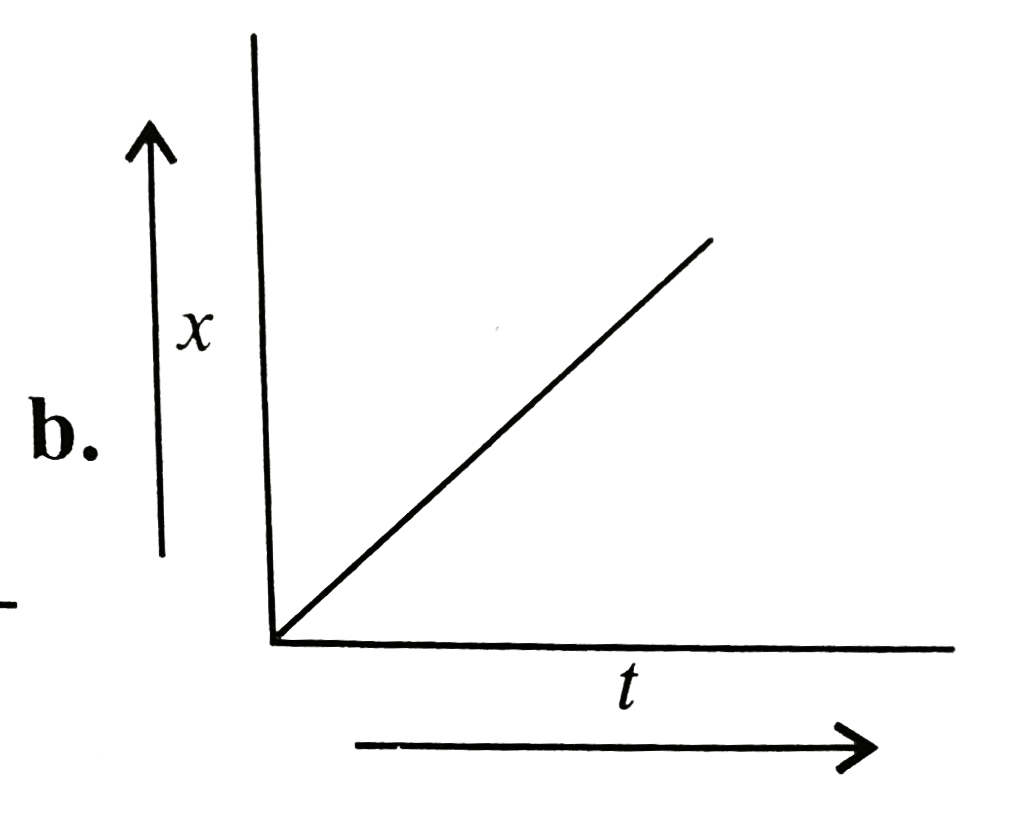 C
C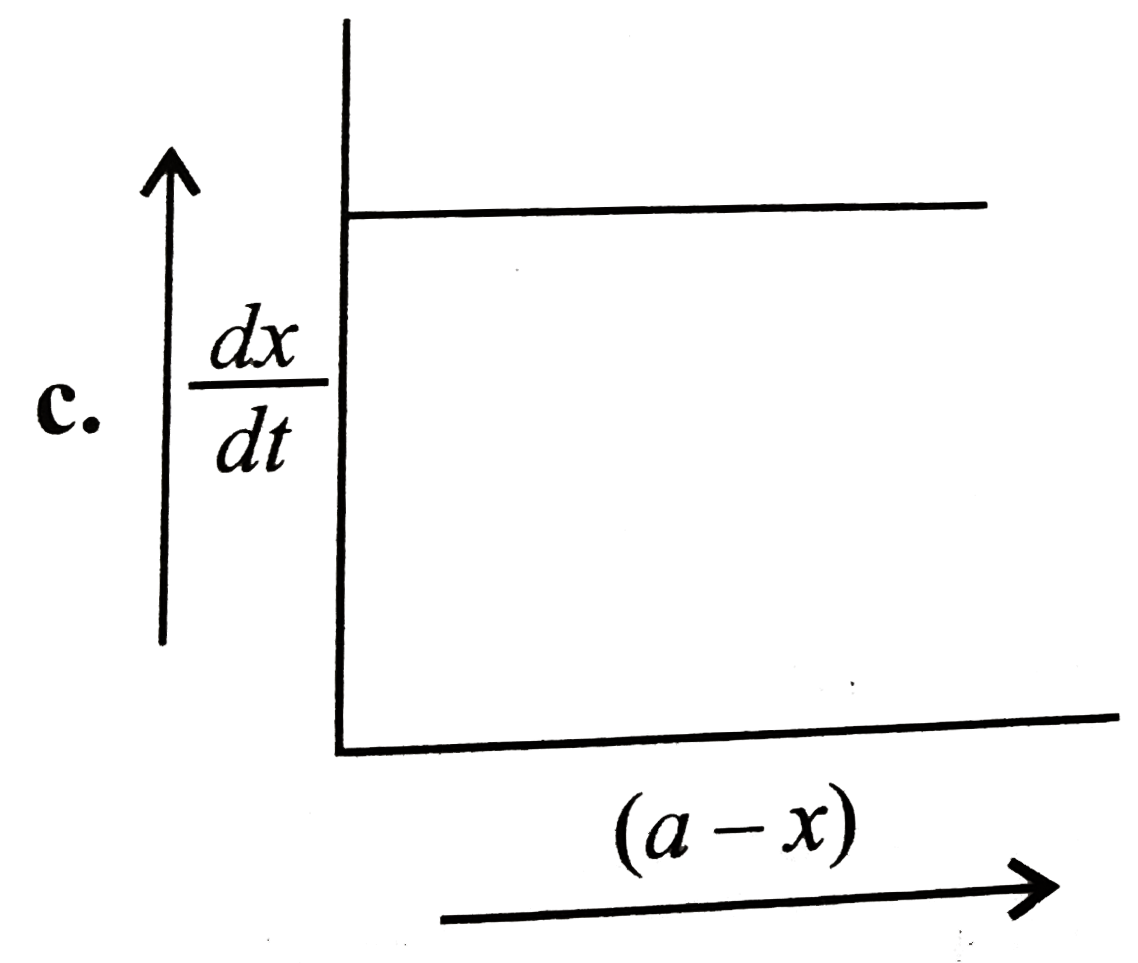 D
D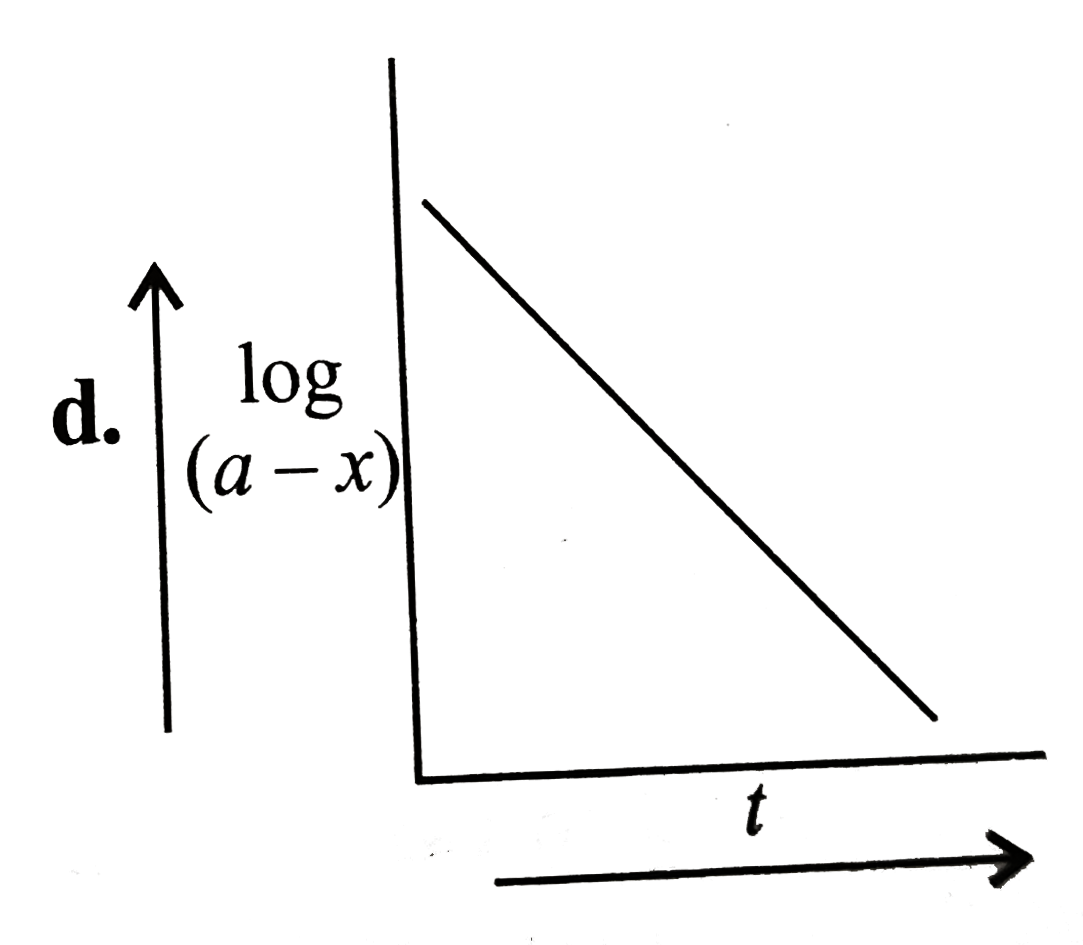
Which of the following graph is correct for zero order reaction?
View SolutionWhich of the following graphs represents a first order reaction ?
View SolutionWhich concentration plot is linear for a first order reaction?
View SolutionWhich of the following is correct representation of the variation of half - life with initial concentration of a zero order reaction ?
View SolutionWhich of the following graphs is not for zero order reaction?
View Solution