A P−V diagram is obtained by changing the temeprature of the gas as shown. During the proces the gas is
_E01_020_Q01.png)
heated continuously
cooled continuously
heated in the beginning but cooled towards the end
cooled in the beginning but heated towards the end
The correct Answer is:C
Step by step video, text & image solution for A P-V diagram is obtained by changing the temeprature of the gas as shown. During the proces the gas is by Physics experts to help you in doubts & scoring excellent marks in Class 11 exams.
Updated on:21/07/2023Topper's Solved these Questions
- THERMAL PROPERTIES OF MATTERBOOK - NARAYNACHAPTER - THERMAL PROPERTIES OF MATTEREXERCISE - LEVEL - I (C.W.)
24 Videos
- THERMAL PROPERTIES OF MATTERBOOK - NARAYNACHAPTER - THERMAL PROPERTIES OF MATTEREXERCISE - LEVEL - II (C.W.)
20 Videos
- SYSTEM OF PARTICLES AND ROTATIONAL MOTION BOOK - NARAYNACHAPTER - SYSTEM OF PARTICLES AND ROTATIONAL MOTION EXERCISE - EXERCISE - IV
39 Videos
- THERMODYNAMICSBOOK - NARAYNACHAPTER - THERMODYNAMICSEXERCISE - Exercise
187 Videos
Similar Questions
An ideal gas with heat capacity at constant volume CV undergoes a quasistatic process described by PVα in a P-V diagram, where α is a constant. The heat capacity of the gas during this process is given by-
View Solution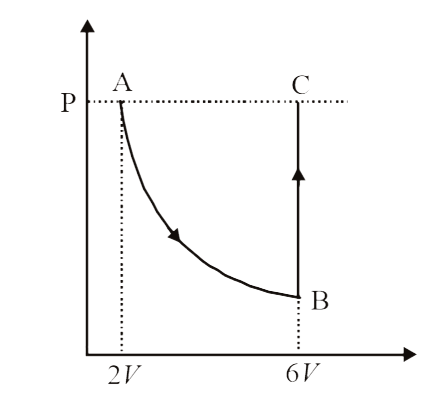
In the figure n mole of a monoatomic ideal gas undergo the process ABC as shown in the P-V diagram. The process AB is isothermal and BC is isochoric. The temperature of the gas at A is T0 total heat given to the gas during the process ABC is measured to be
Q. Temperature of the gas at C is equal to
View Solution
Knowledge Check
A volume V absolute temperature T diagram was obtained when a given mass of gas was heated. During the heating process from state 1 to 2, the pressure
_E01_062_Q01.png) ARemain constantBDecreasedCChanged erraticallyDIncreased
ARemain constantBDecreasedCChanged erraticallyDIncreasedV−T diagram for a process of given mass of ideal gas is as shown in fig. During the process pressure of the gas
_E01_072_Q01.png) AFirst increases then decreasesBFirst decreases then increasesCcontinously decreasesDcontinously increases
AFirst increases then decreasesBFirst decreases then increasesCcontinously decreasesDcontinously increasesOne mole of an ideal monotomic gas undergoes a linear process from A to B in which its pressure p and its volume V change as shown in figure.
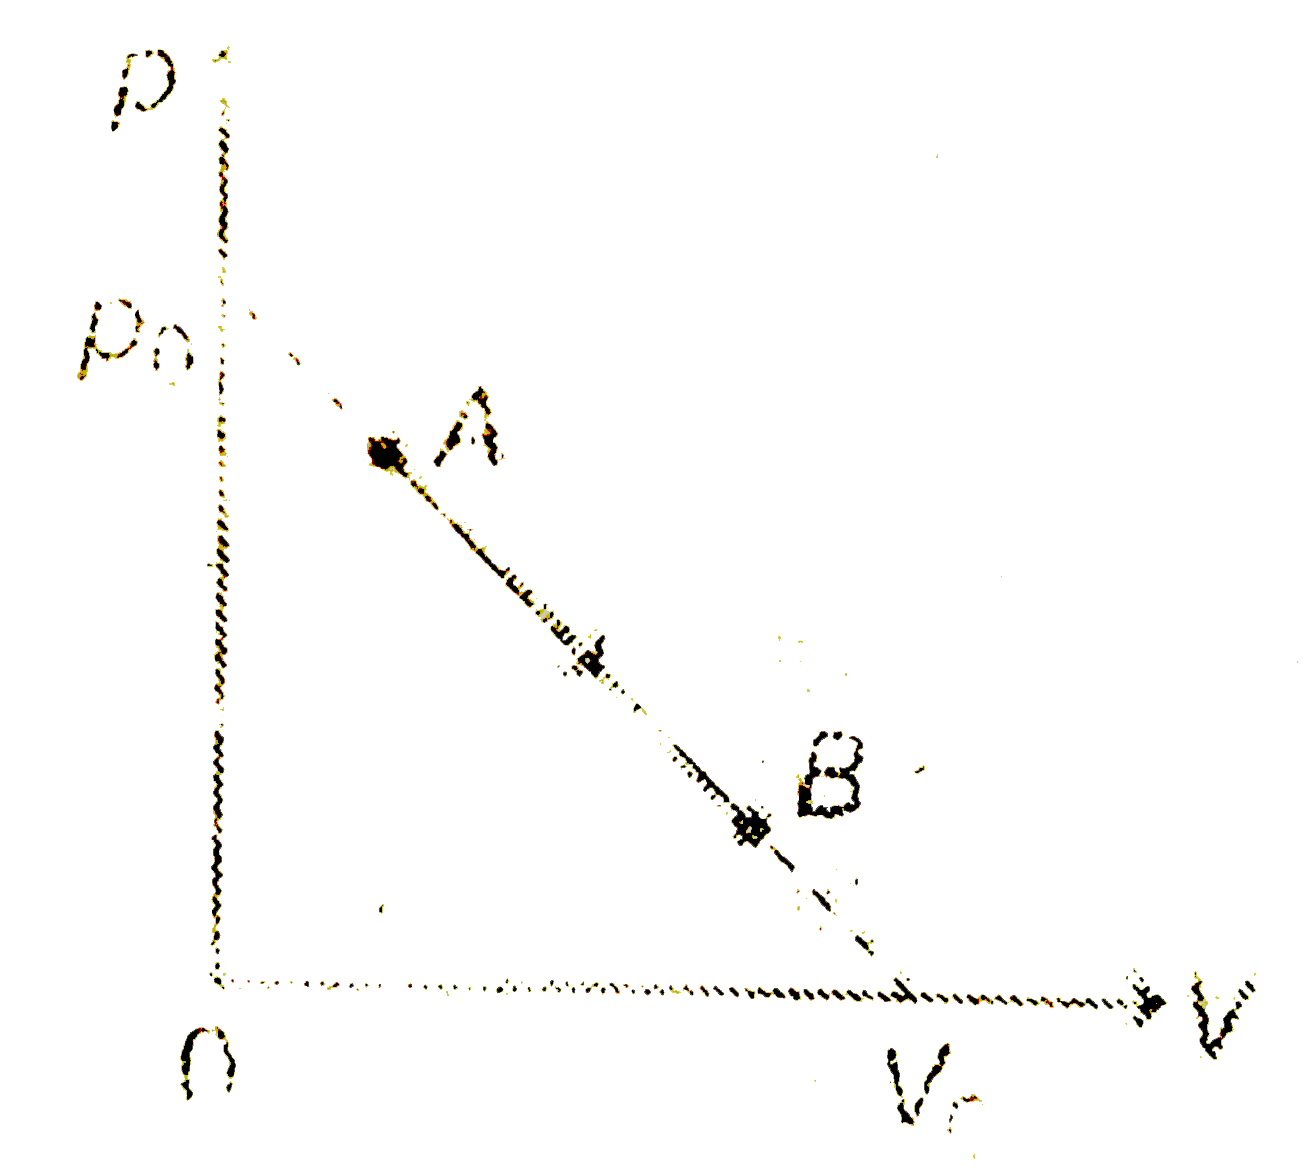
The maximum temperature of the gas during this process isAp0V02RBp0V04RC3p0V04RD3p0V02R
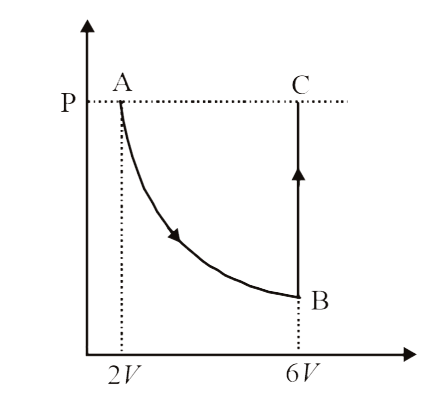
In the figure n mole of a monoatomic ideal gas undergo the process ABC as shown in the P-V diagram. The process AB is isothermal and BC is isochoric. The temperature of the gas at A is T0 total heat given to the gas during the process ABC is measured to be
Q. The average molar heat capacity of the gas in process ABC is
View Solution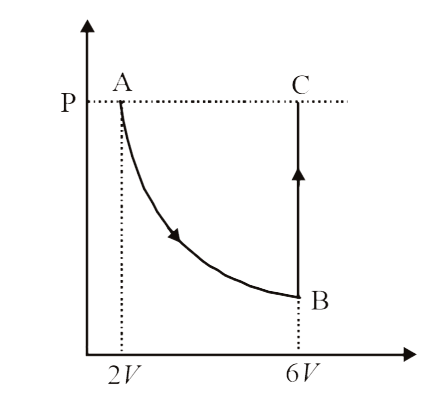
In the figure n mole of a monoatomic ideal gas undergo the process ABC as shown in the P-V diagram. The process AB is isothermal and BC is isochoric. The temperature of the gas at A is T0 total heat given to the gas during the process ABC is measured to be
Q. Heat absorbed by the gas in the process BC
View Solution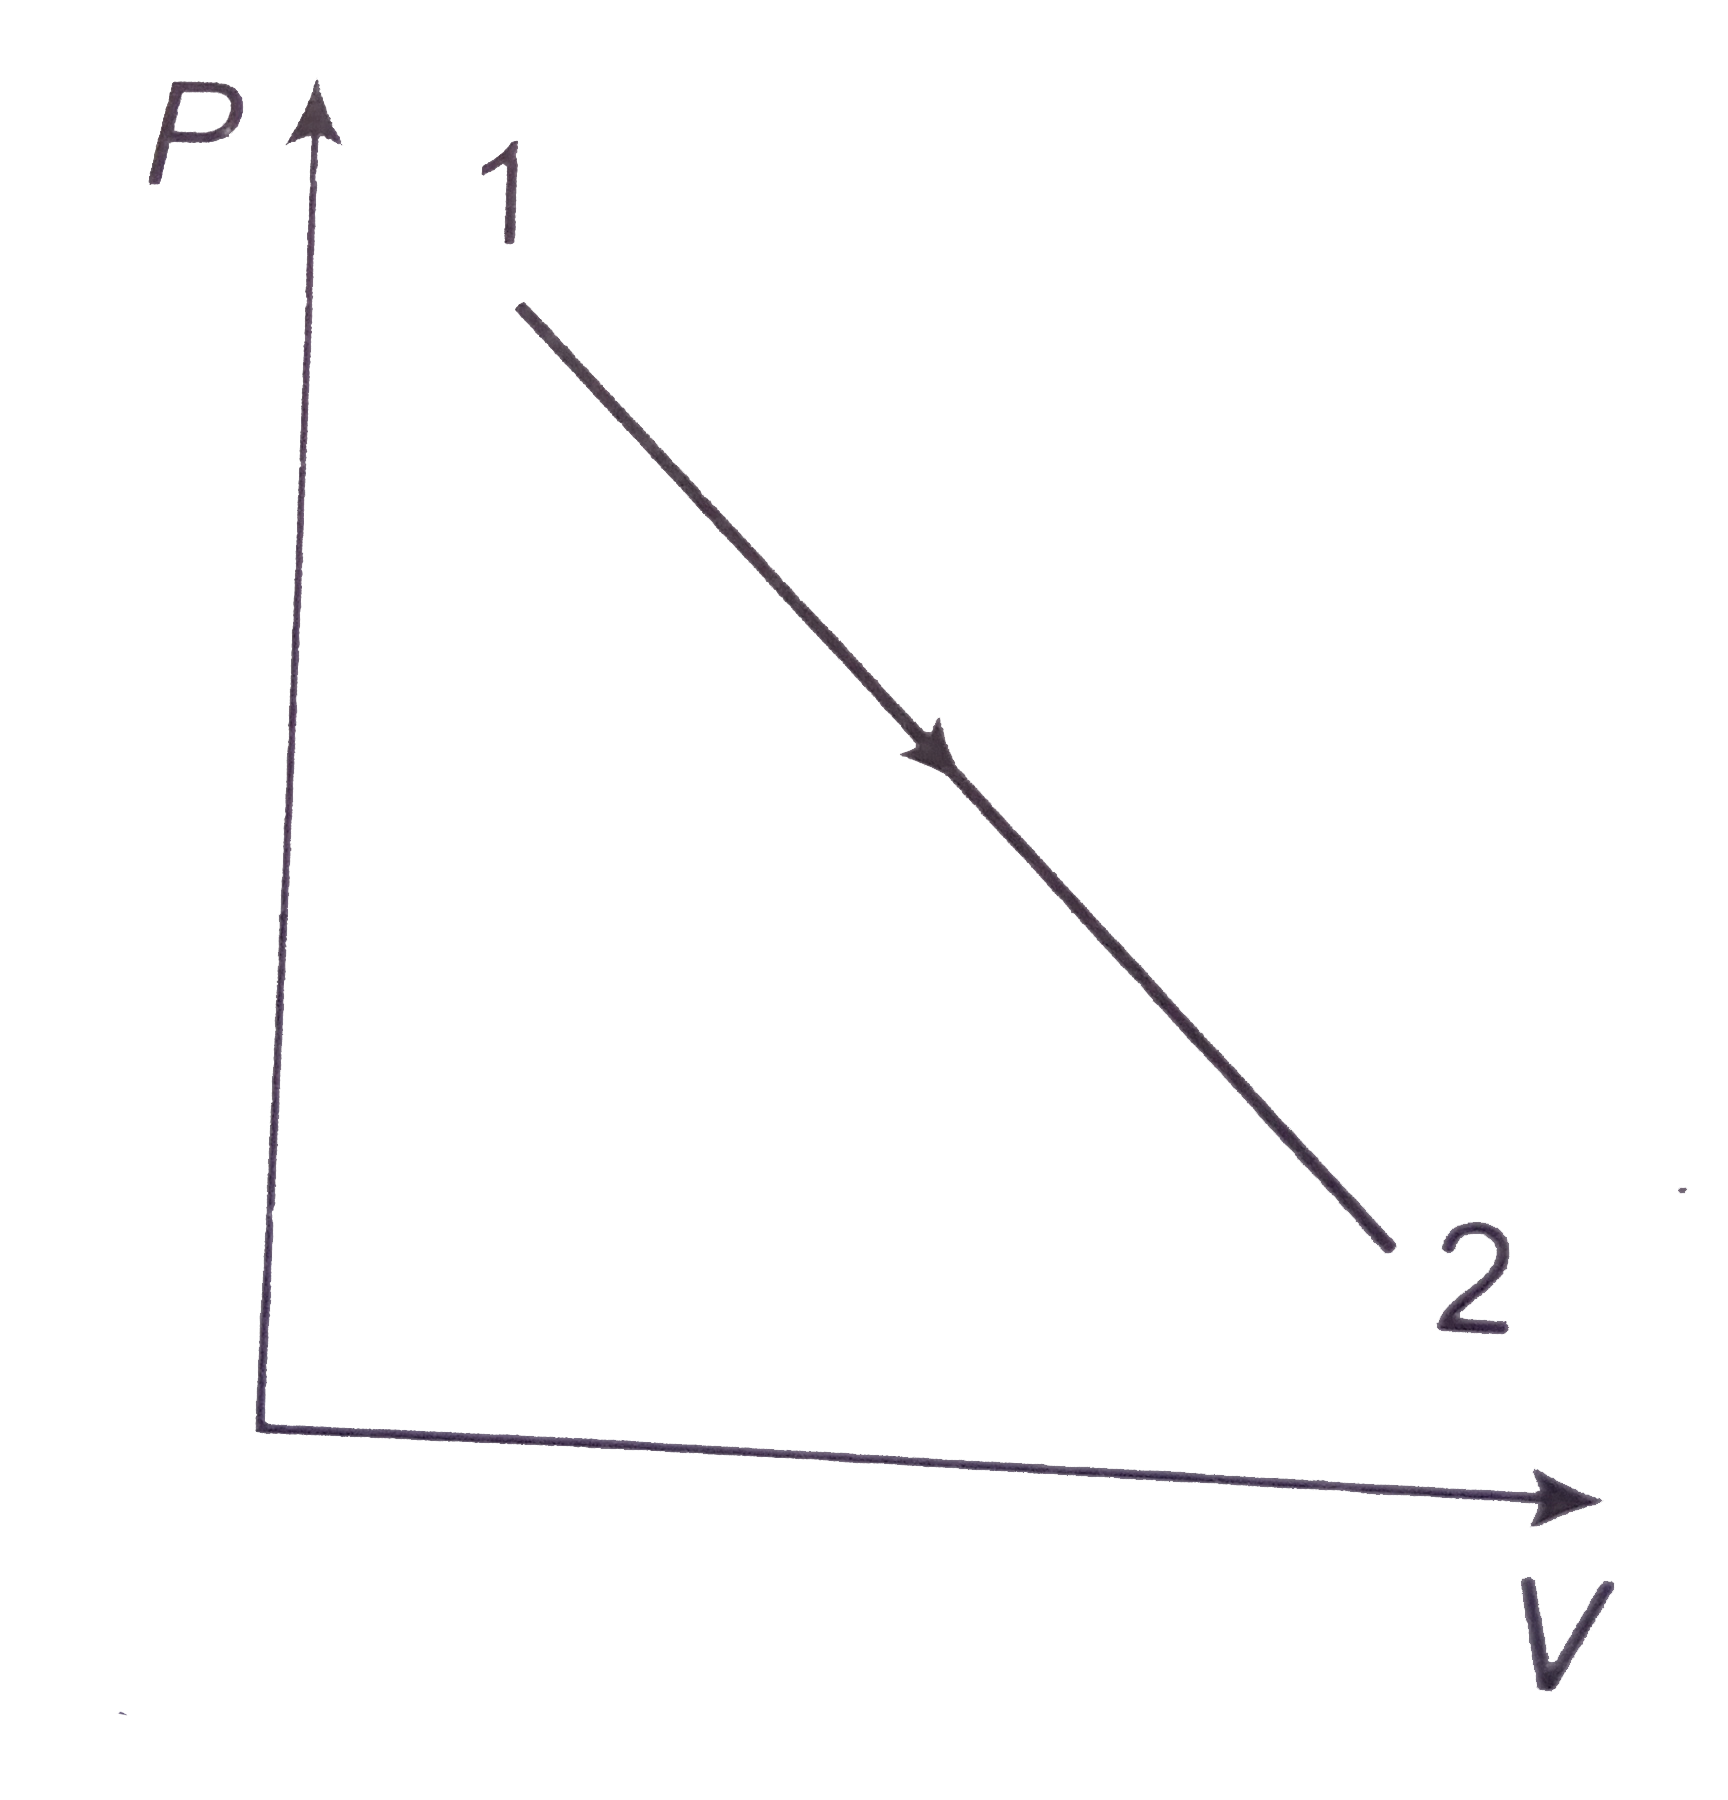
P−V graph was obtained from state 1 to state 2 when a given mass of a gas is subjected to temperature changes during the process the gas is
View SolutionAn ideal gas is taken from point A to the point B, as shown in the P-V diagram, keeping the temperature constant. The work done in the process is :
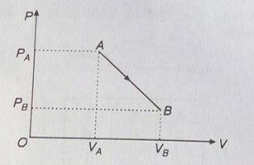
View SolutionAn ideal gas is taken from point A to the point B, as shown in the P-V diagram, keeping the temperature constant. The work done in the process is :

View Solution
