Construction of A Histogram When Mid-Points of Class-Intervals are Given
Video Solution
|
Answer
Step by step video & image solution for Construction of A Histogram When Mid-Points of Class-Intervals are Given by Maths experts to help you in doubts & scoring excellent marks in Class 9 exams.
Updated on:21/07/2023Similar Questions
Knowledge Check
Mid point of class is
AAverage of lower and upper limitBMultiple of lower and upper limitCRatio of lower and upper limitDNone of these.The mid point of class interval is called
AClass IntervalBFrequencyCMid value,DNone of theseCalculate the mid-point of class interval 70-80
A70B75C80D85
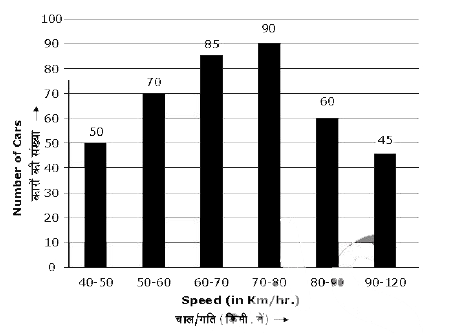
Construct a histogram from the following data :

View SolutionConstruction of Histogram of a Continuous grouped frequency distribution
View SolutionConstruction of Histogram of a Continuous grouped frequency distribution with unequal distribution
View SolutionIn the given histogram, in which class interval the median lies

View SolutionConstruct a histogram for the following distribution:

View Solution
