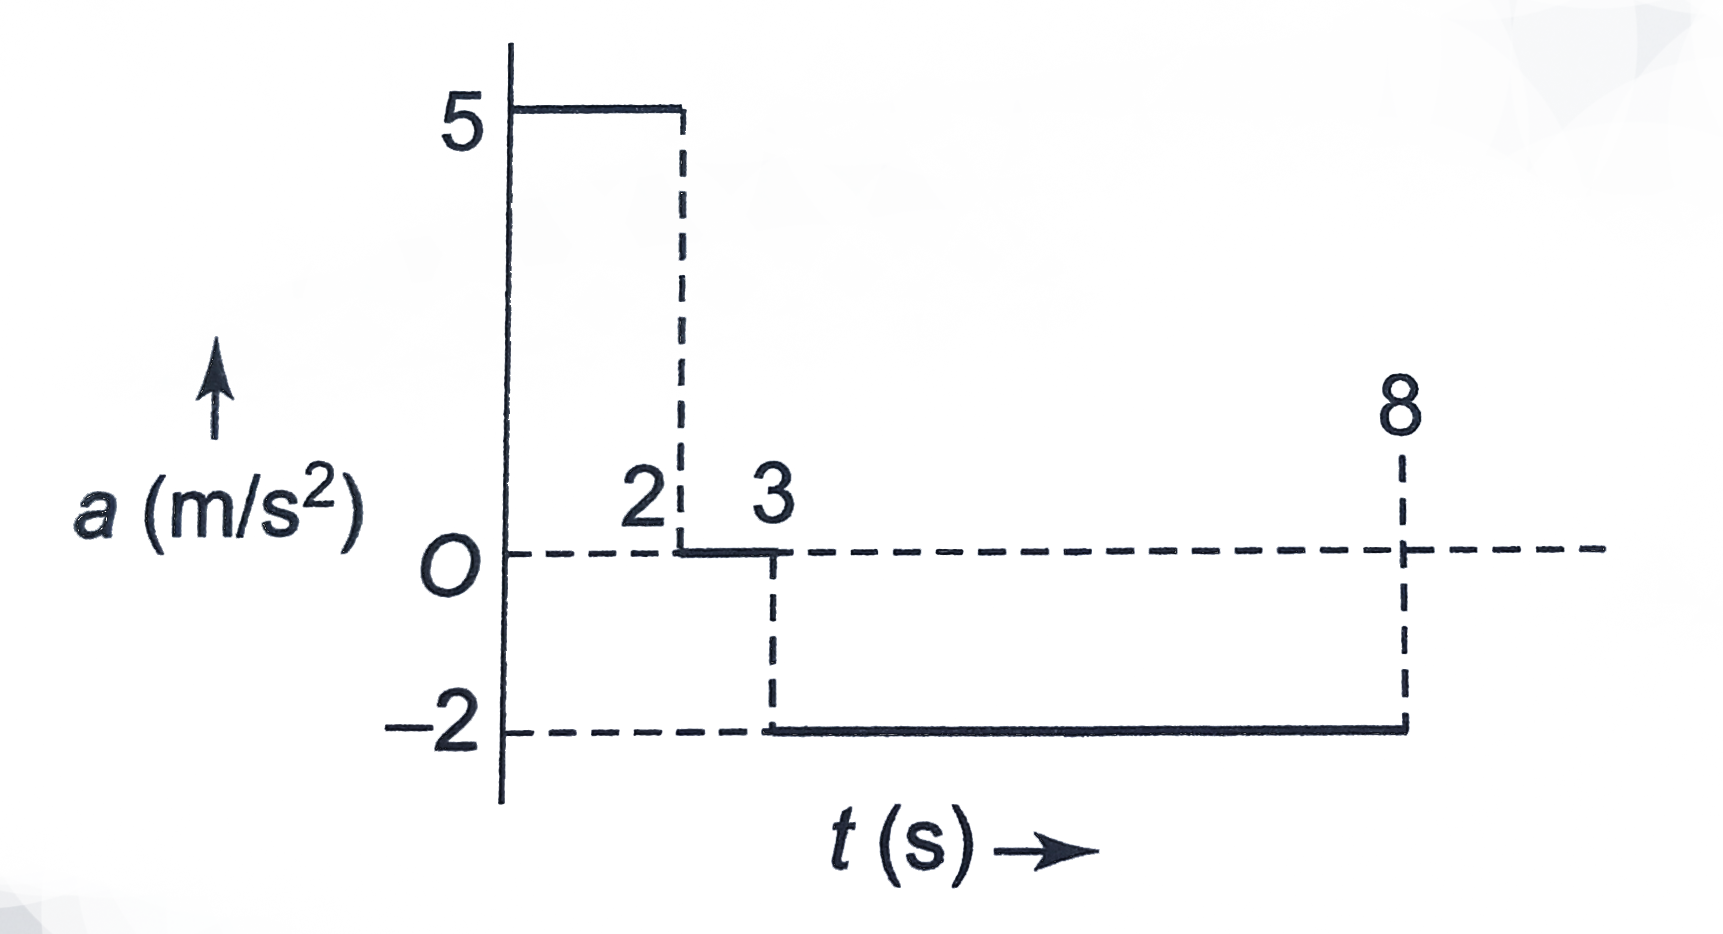
For a particle moving in a straight line, the velocity-time graph is as shown in the figure. Find the acceleration at time t=1s2.5s and 5s. Sketch the acceleration time graph.
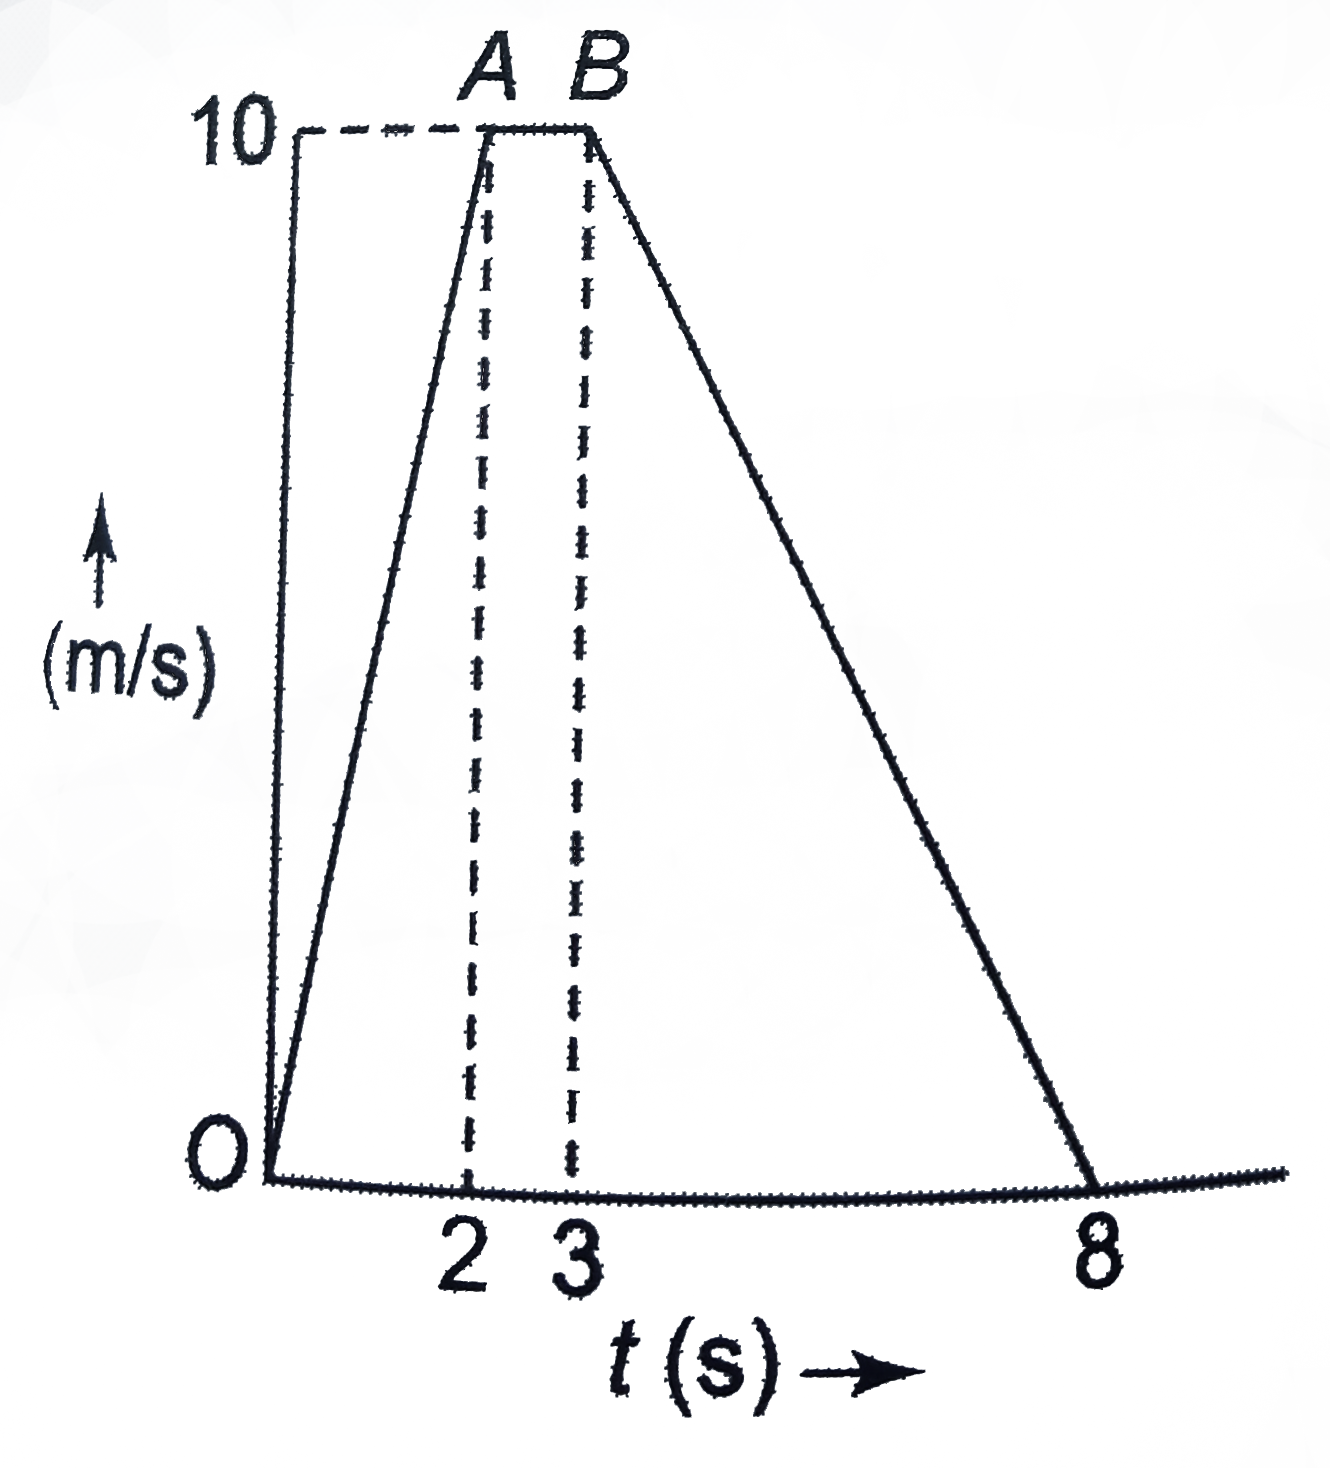
As the slope of the s-t graph gives the velocity, in the same manner, the slope of the v-t graph gives the acceleration.
O to A:Slope=102=5
a=5m/s2 for t=0 to 2s
A to B: Slope=0
a=0 for t=2 to 3s
B to C:Slope=−105=−2
a=−2m/s2 for t=3 to 8s
At t=1s,a=5m/s2
t=2.5s,a=0
t=5s,a=−2m/s2
Acceleration-time (a−t) graph
Topper's Solved these Questions
Similar Questions
For a particle moving in a straight line, the position-time graph is as shown in the figure. Find the velocity of the particle at time t=1s and t=4s. Also sketch the v-t graph.
 View Solution
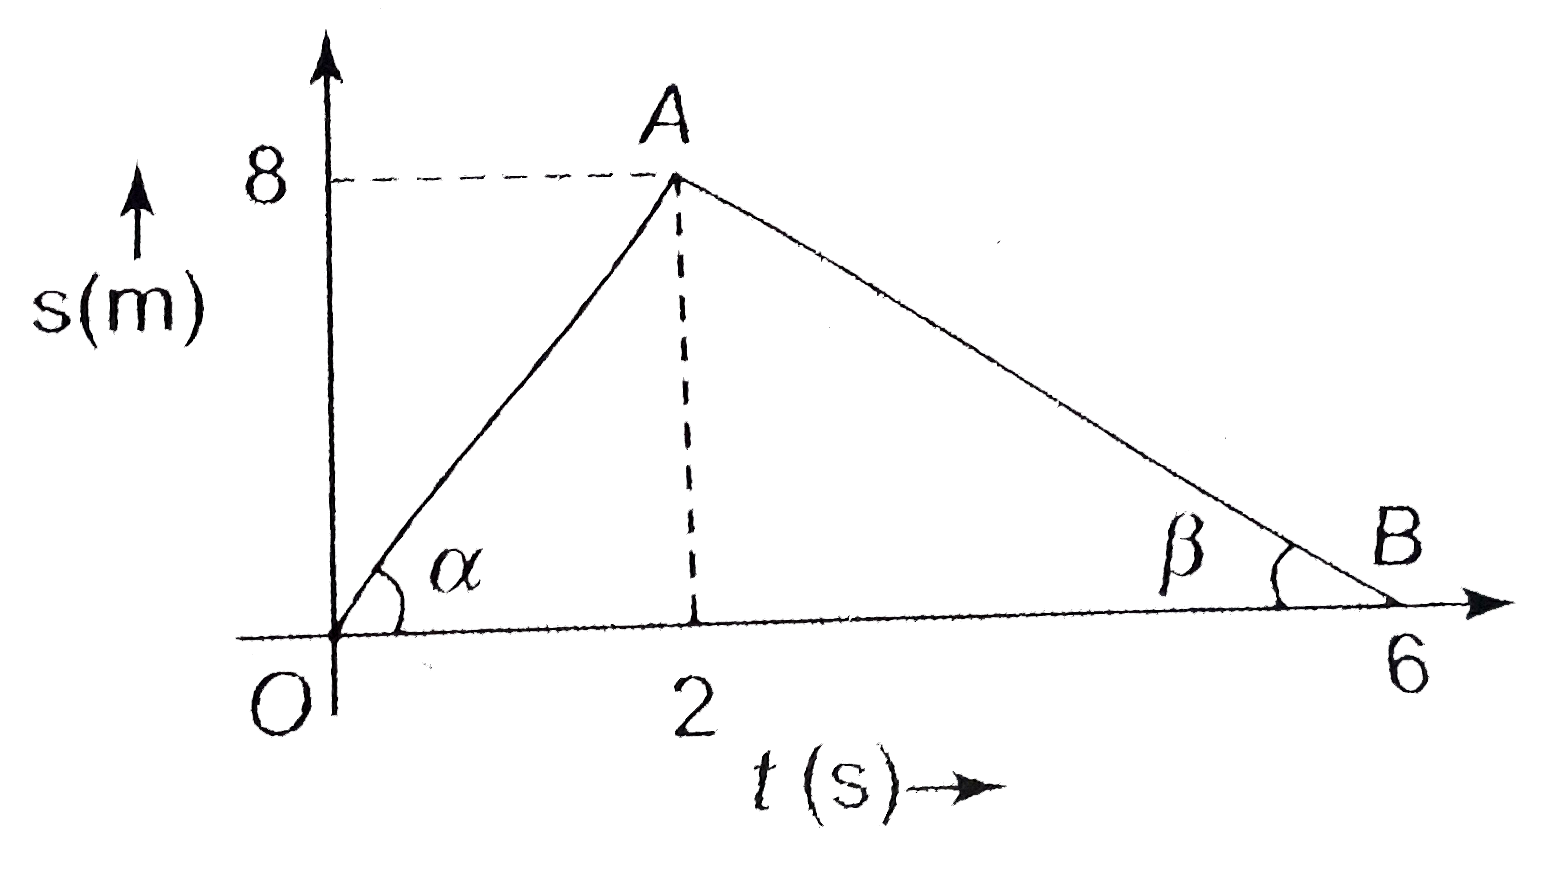
The displacement-time graph for a particle moving in a straight line is as shown in the figure. Determine the velocity of the particle at t=1s,3s and 6s. Sketch the velocity-time graph.
View Solution
Knowledge Check
- Question 1 - Select One
The velocity - time graph is shown in the figure, for a particle. The acceleration of particle is
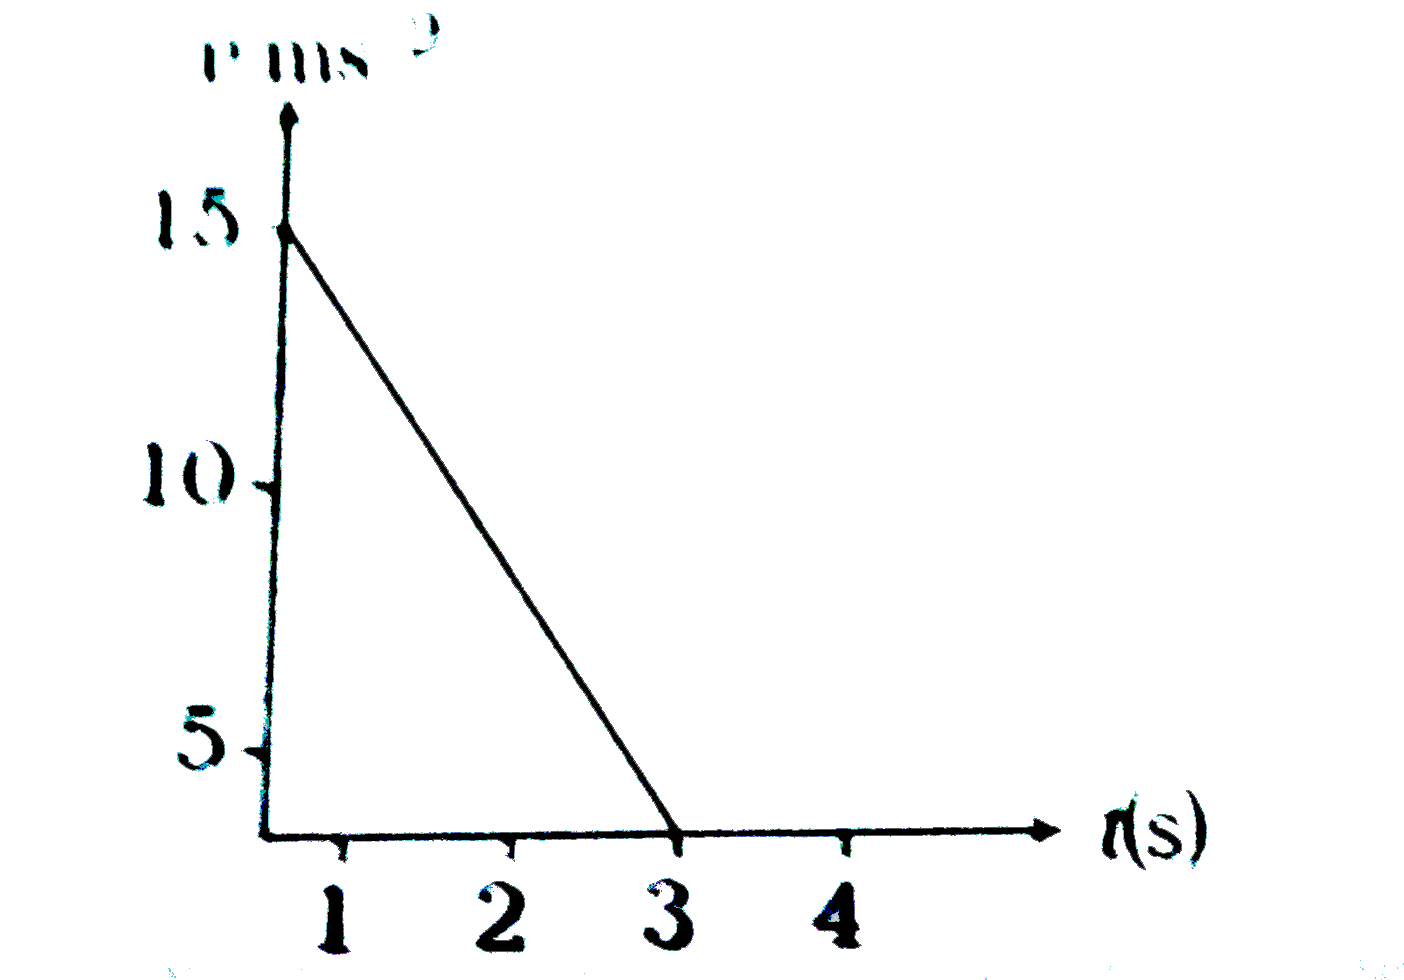 A22.5ms−2B5ms−2C−5ms−2D−3ms−2
 - Question 2 - Select One
Displacement-time graph of a particle moving in a straight line is as shown in figure.
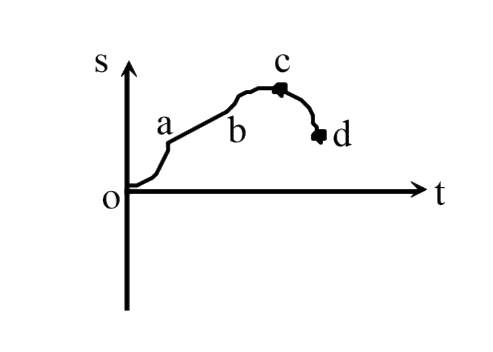
Q. Find the sign of acceleration in the above regionAzero, postive, negative, negativeBpositive , zero, negative, positiveCpositive , zero, positive, negativeDpositive , zero, negative, negative - Question 3 - Select One
The velocity-time graph of a particle is not a straight line. Its acceleration is
AzeroBconstantCnegativeDvariable
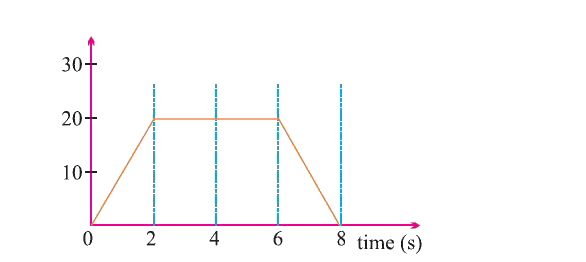
The velocity time graph for a particle is shown in figure. Draw acceleration time graph from it.
 View Solution
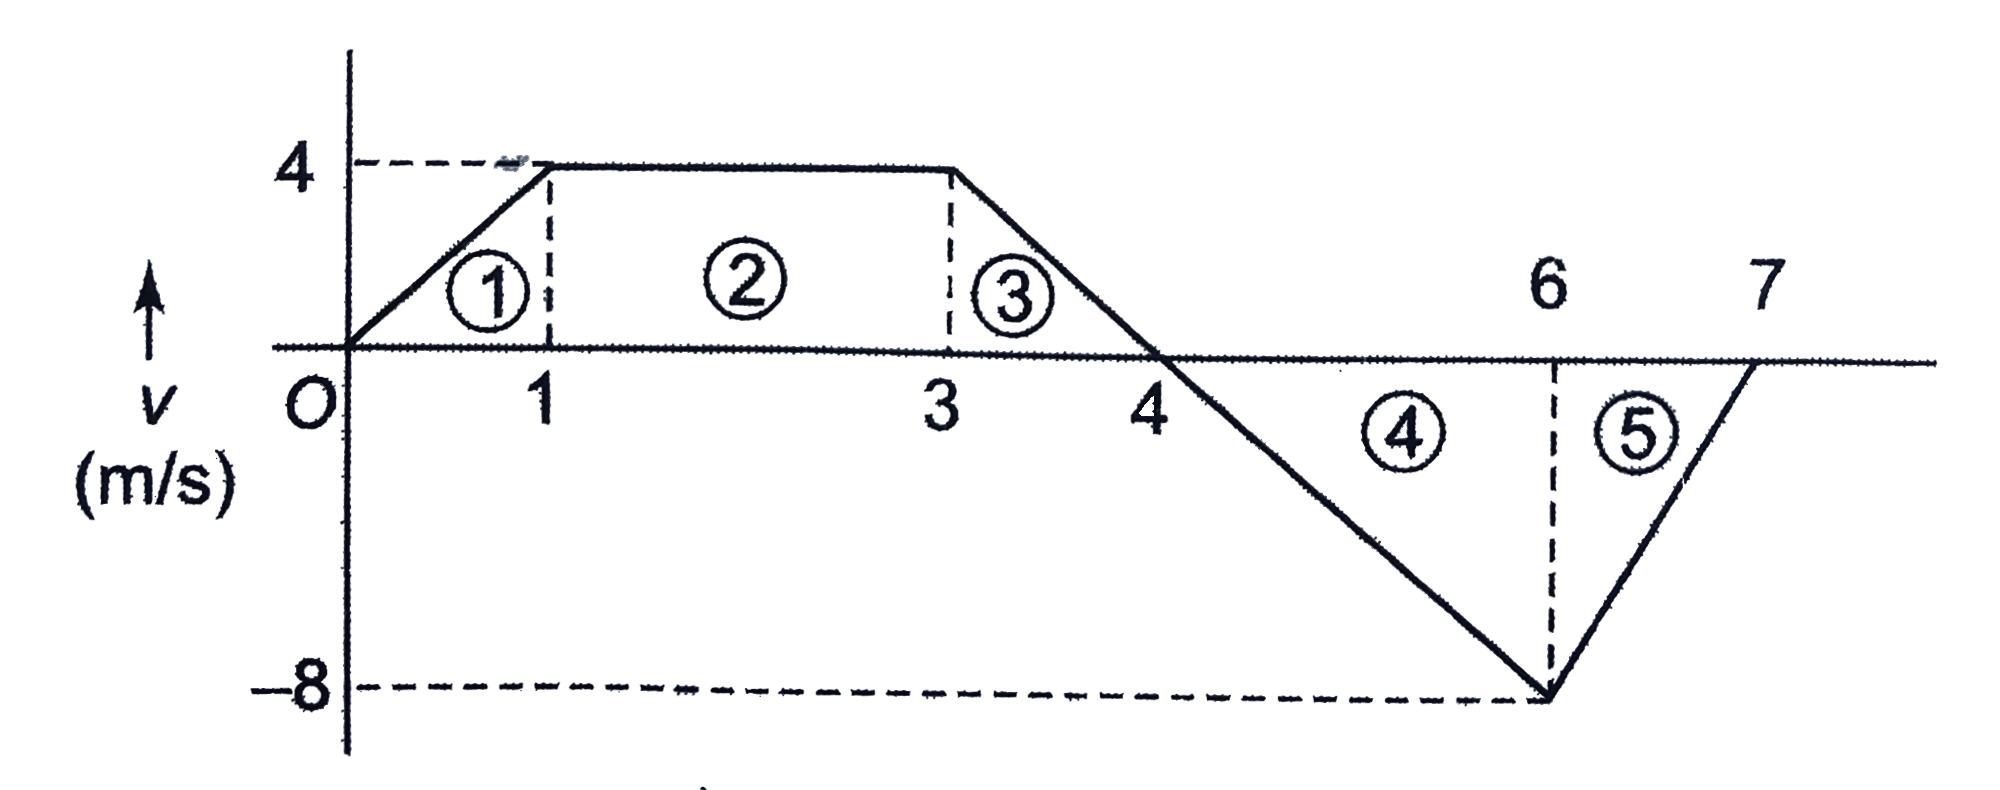
A particle is moving in a straight line along the xaxis. Its velocity-time graph is as shown. Sketch the displacement-time and distance-time grapgs.
 View Solution
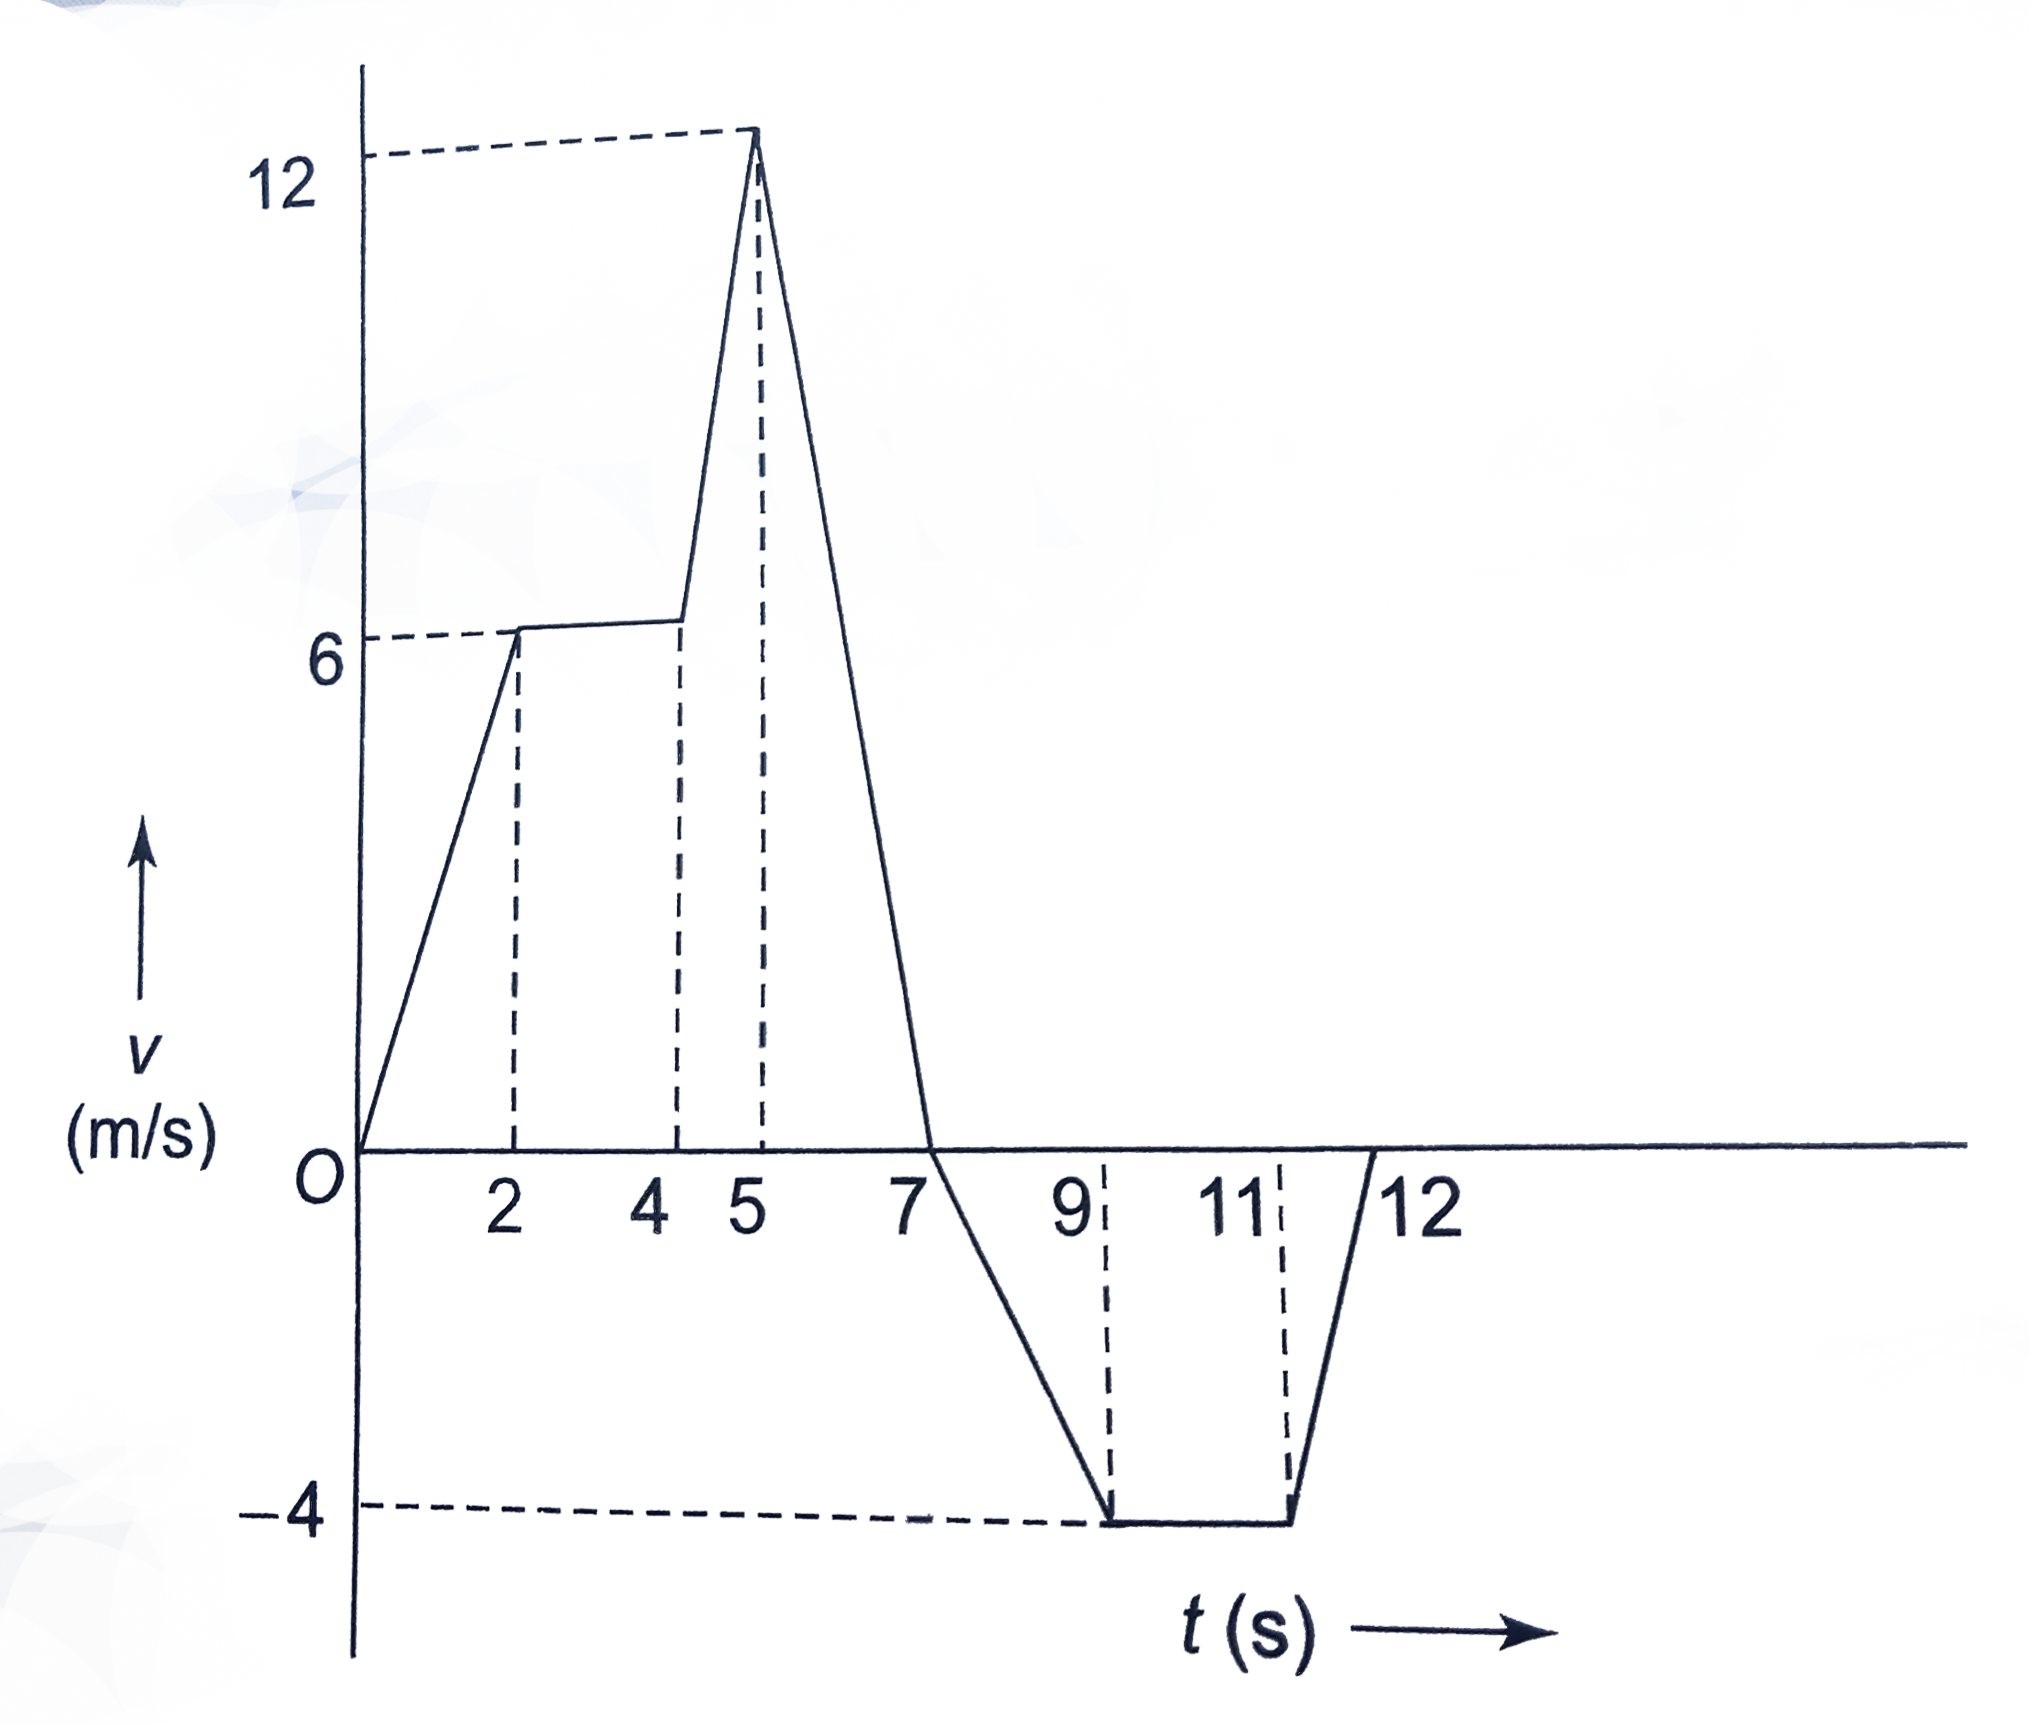
Study the following velocity-time graph. Determine the displacement and distance in the time interval t=0 to t=12s. Sketch the acceleration-time graph.
 View Solution
The velocity-time graph of a moving particle is given below. The acceleration of the particle at t = 5 s will be
View SolutionThe velocity -time (v−t) graph of a particle moving in a straight line is shown in figure. The acceleration of the particle at t=9 is:
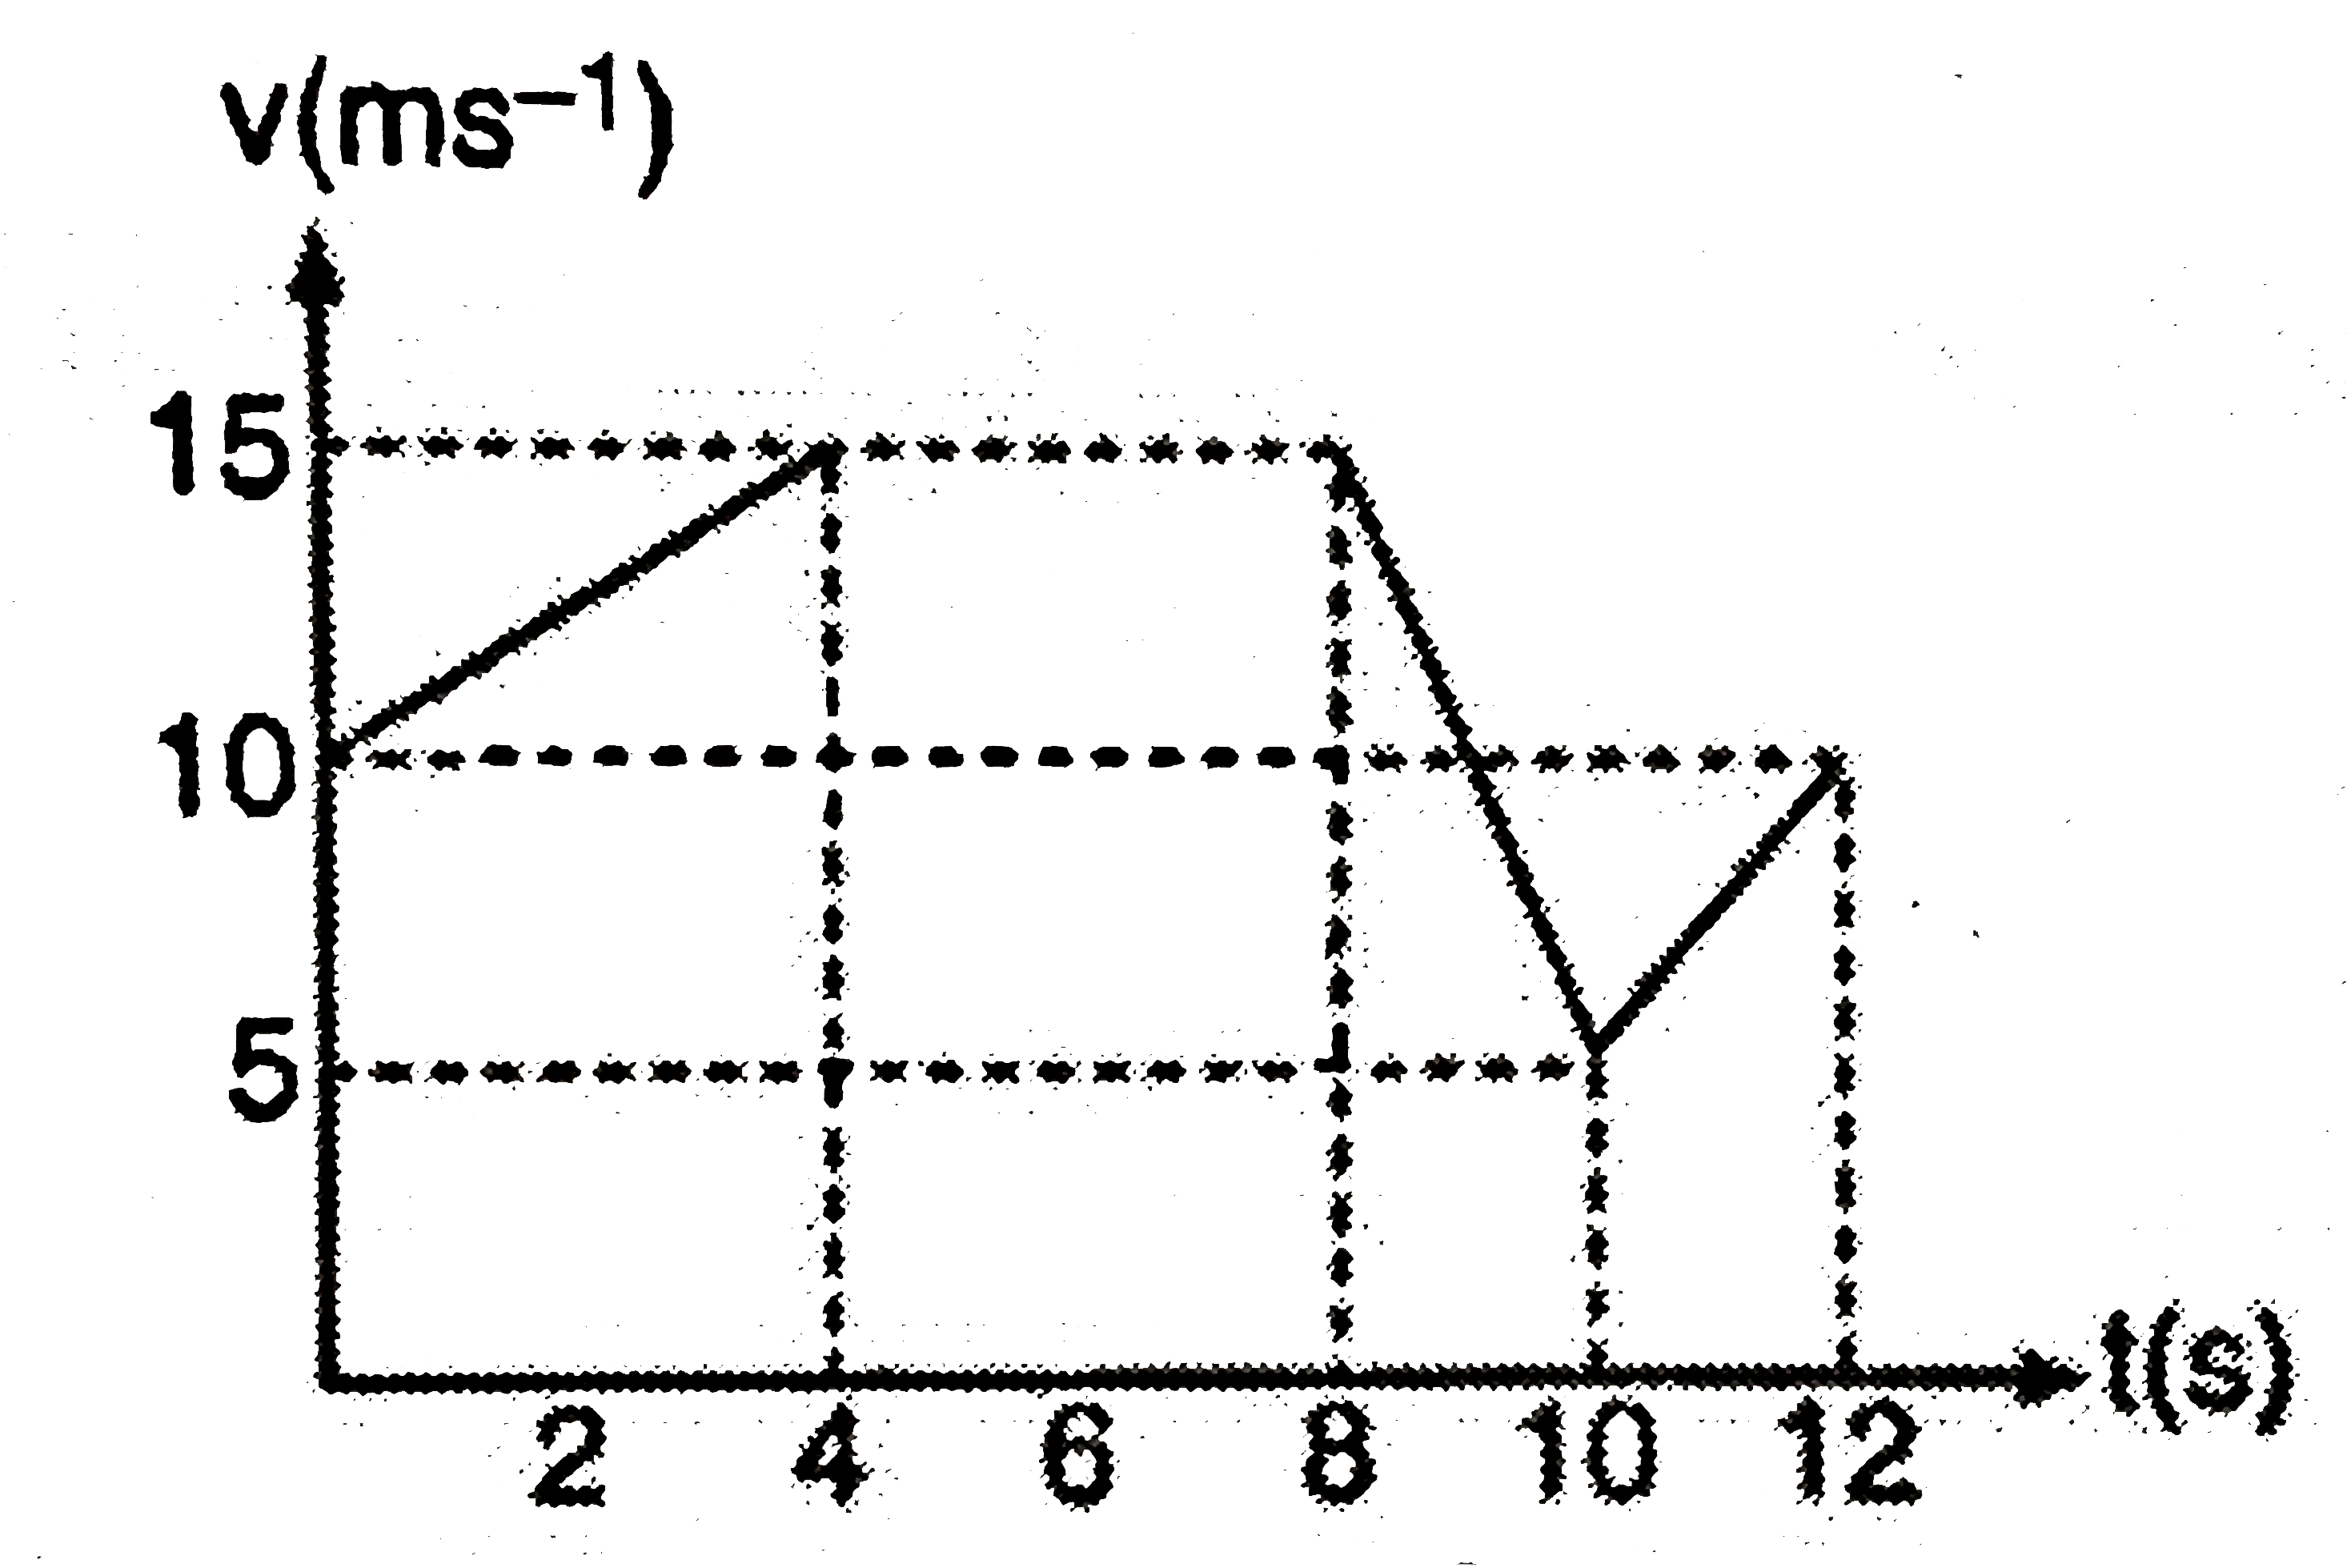 View Solution
