Consider the following a-t graph for a particle moving along the x-axis. If the initial velocity is zero, sketch the v-t graph.
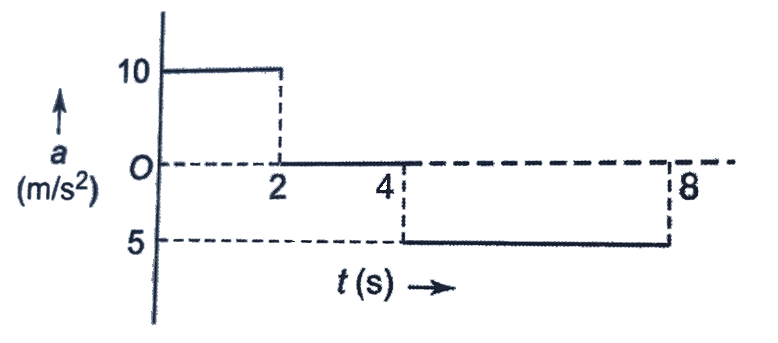
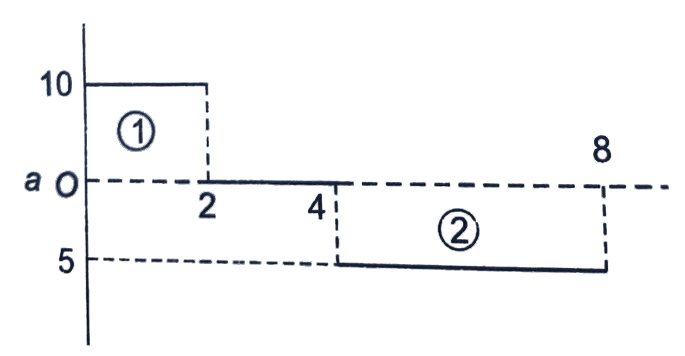
Area(1)=20,Area(2)=−20
t=0,vt=0=0
vt=2−vt=0=Area(1)=20⇒vt=2=20m/s
From t=2 to t=4s , a=0, velocity remains the same and hence, vt=4=20m/s.
vt=8−vt=4=Area(2)=−20
vt=8−20=−20⇒vt=8=0
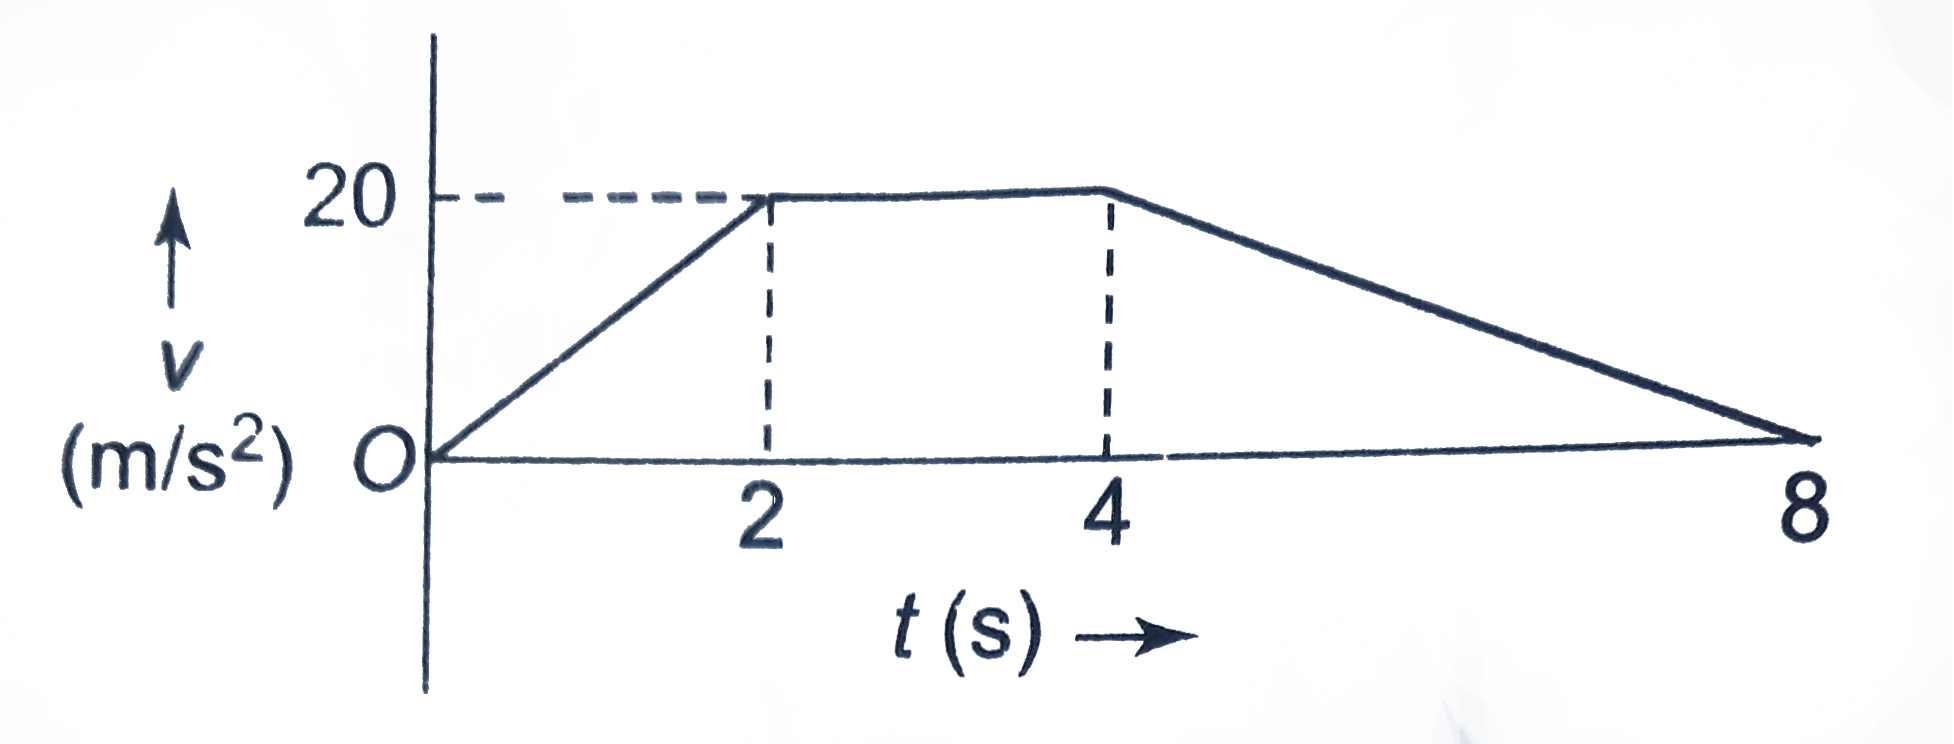
From t=0 to t=2s, velocity increases from 0 to 20m/s.
From t=2 to t=4s, velocity remains constant and equal to 20m/s.
From t=4 to t=8s, velocity decreases from 20m/s to zero.
Topper's Solved these Questions
Similar Questions
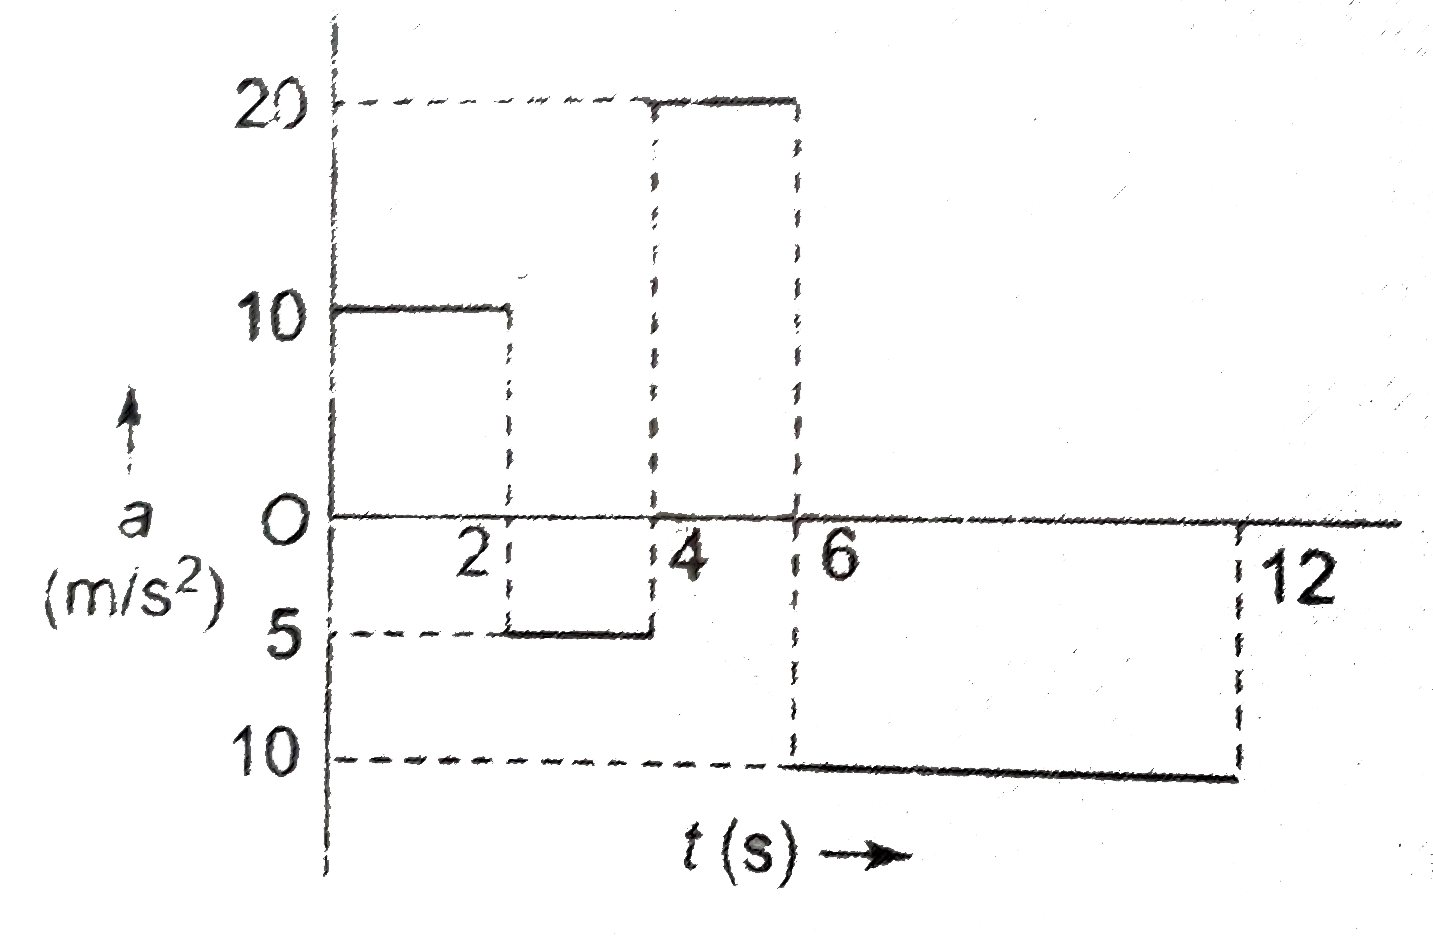
A particle is moving along the x-axis. Consider it’s a-t graph. If initial velocity is 10 m//s, sketch the v-t graph and calculate the displacement in the time interval t=0 to 12 s.
 View Solution
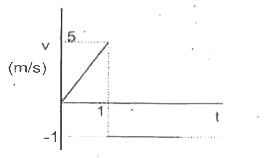
Consider the v-t diagram of a particle moving along x axis as shown below.Velocity is in m/s and time is in seconds
View Solution
Knowledge Check
- Question 1 - Select One
The acceleration - time graph for a particle moving along x - axis is shown in figure, If the initial velocity of particle is −5m/s, the velocity at t = 8 s is
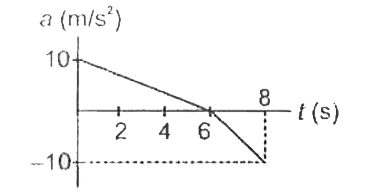 A+15m/sB+20m/sC−15m/sD−20m/s
 - Question 2 - Select One
Acceleration (a)-displacement(s) graph of a particle moving in a straight line is shown here. The initial velocity of the particle is zero. The v-s graph of the particle would be
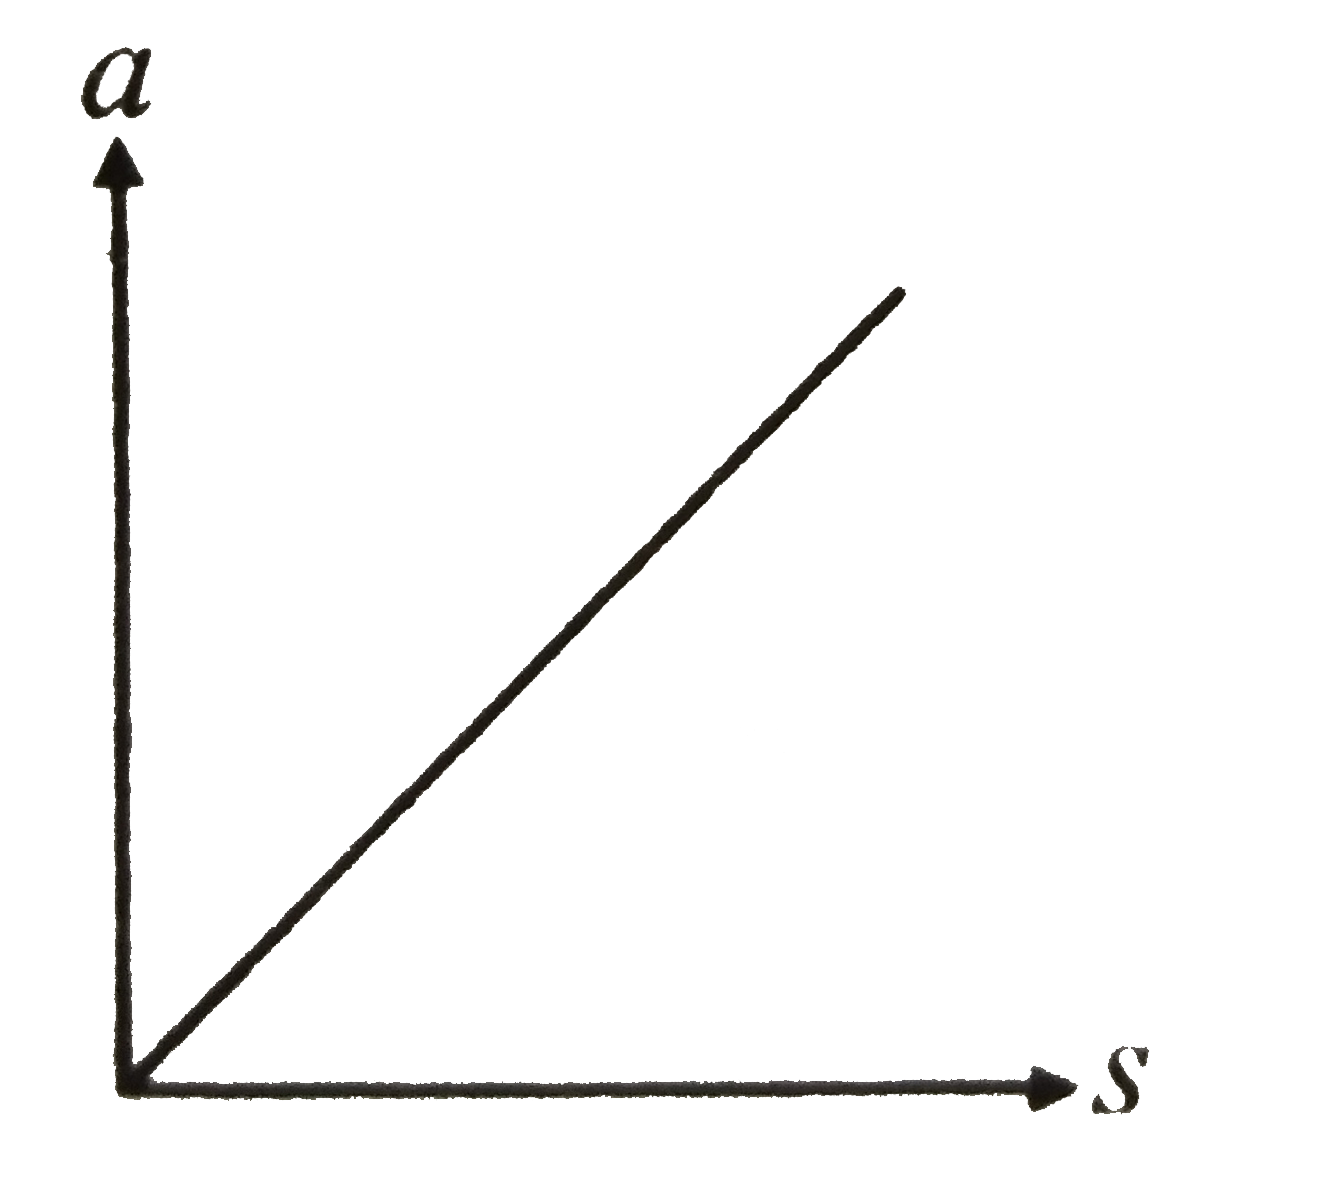 A
A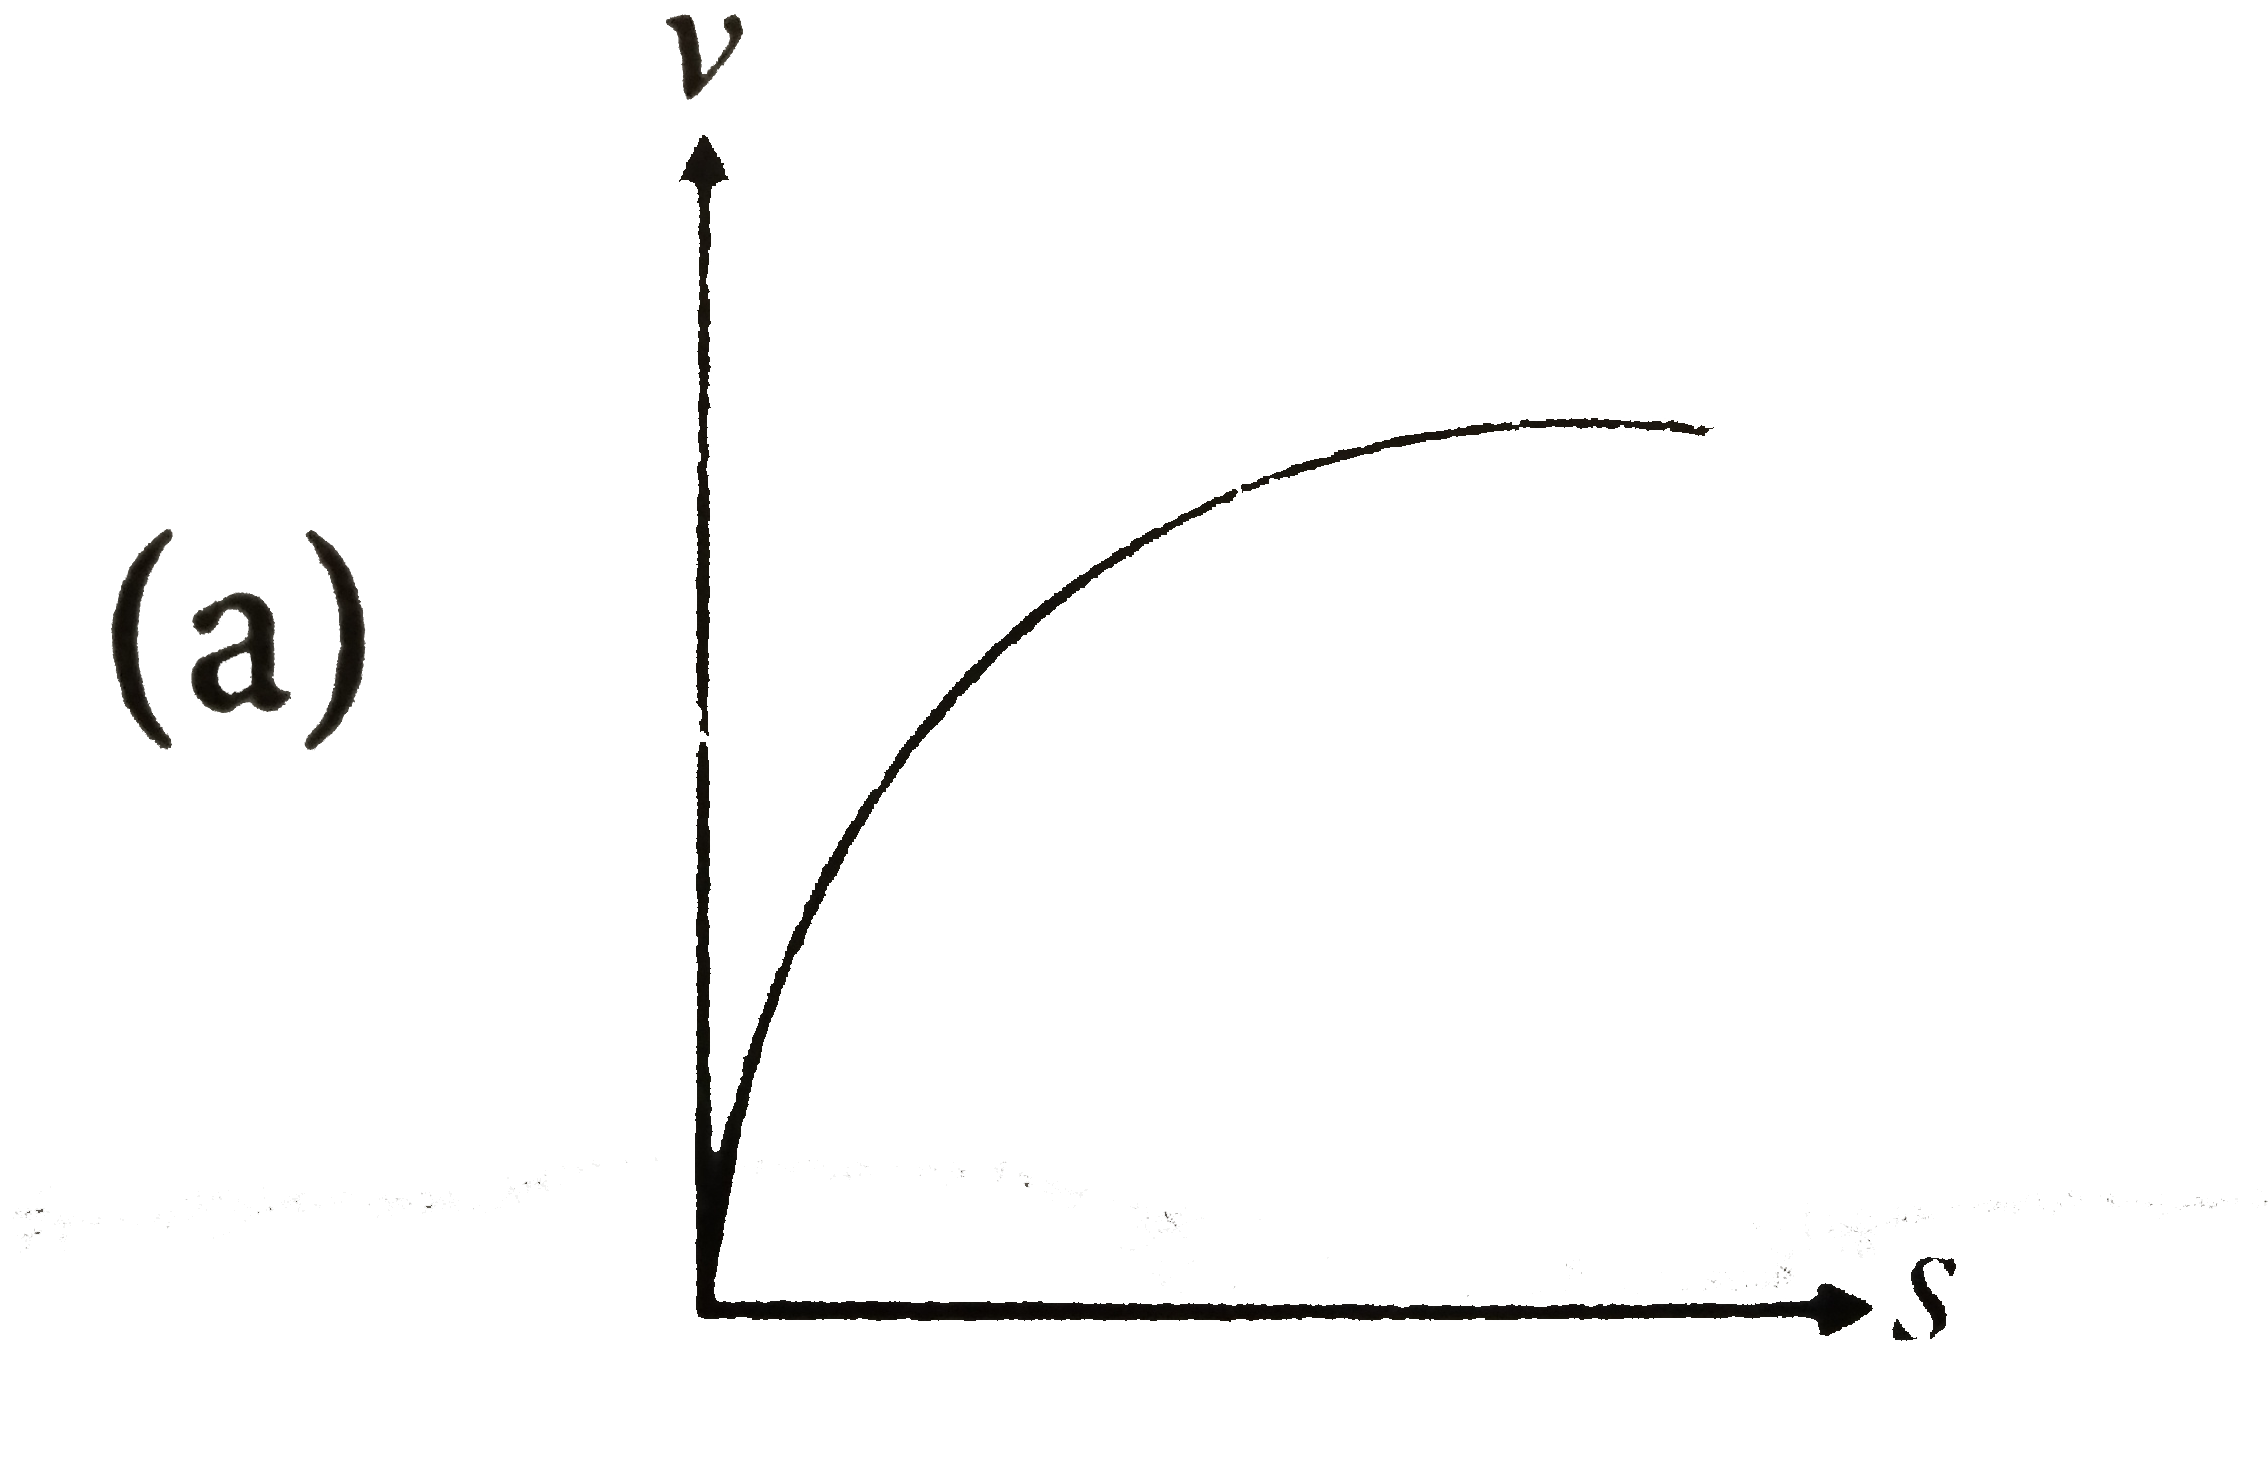 B
B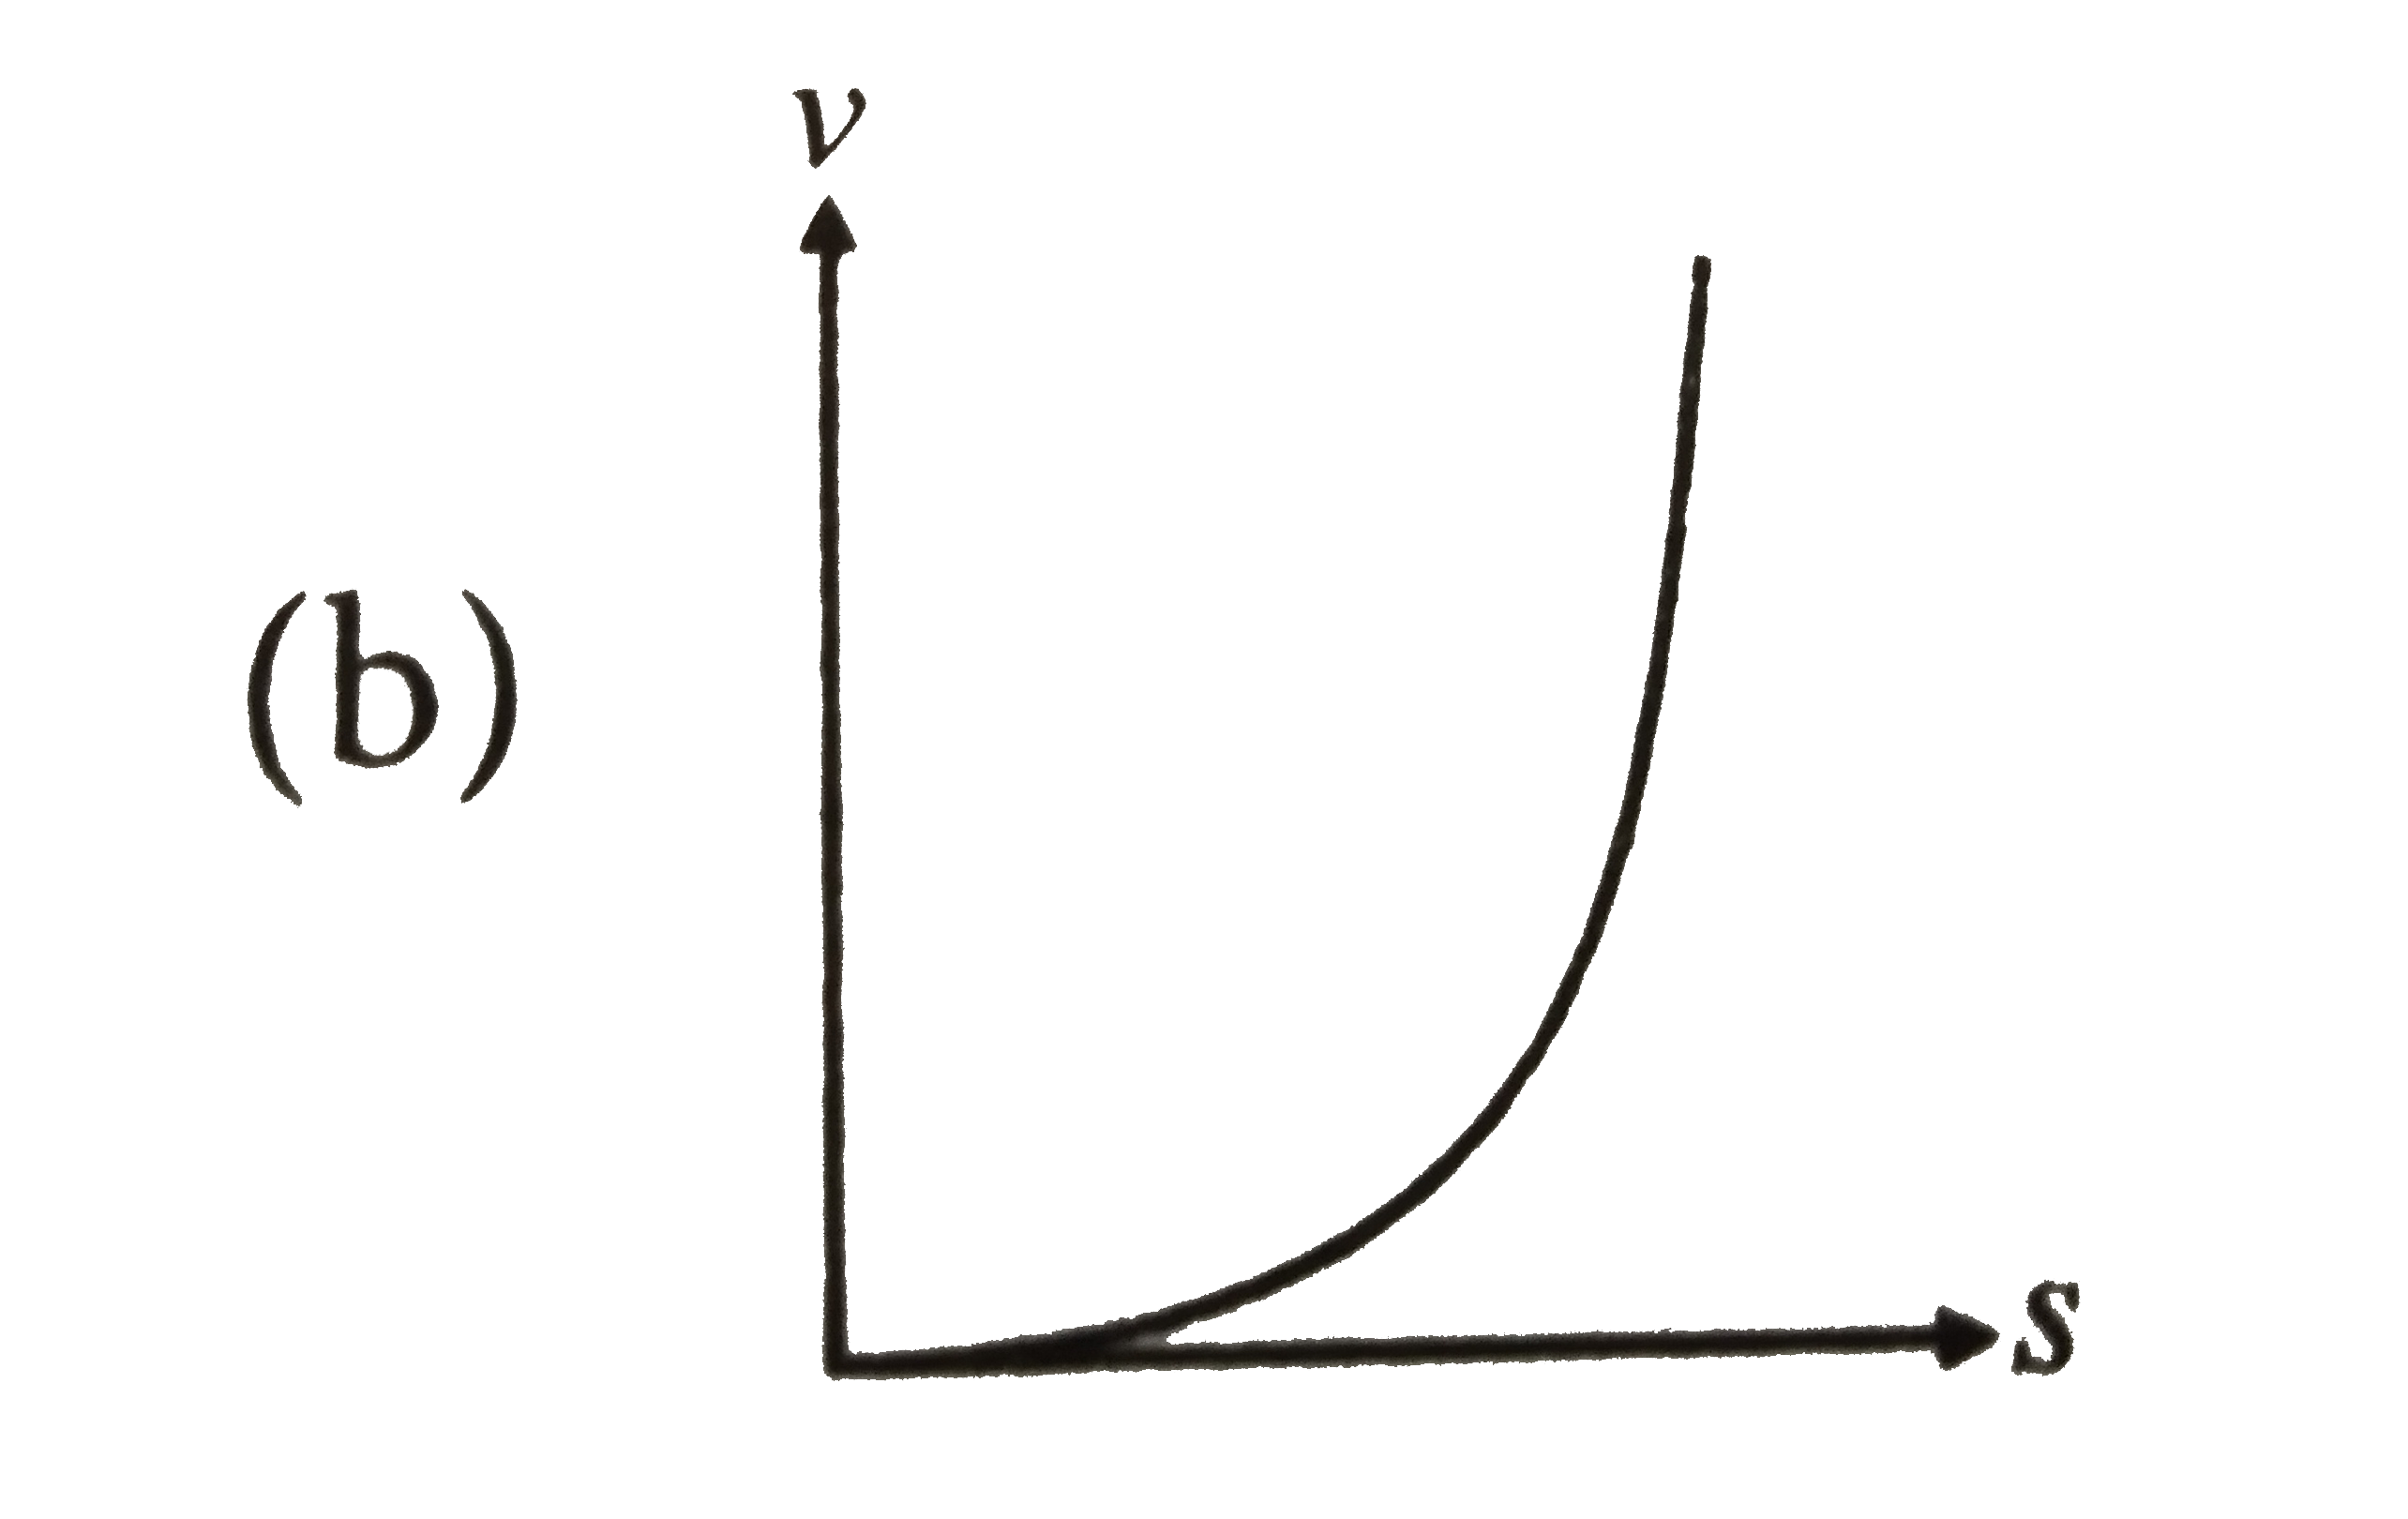 C
C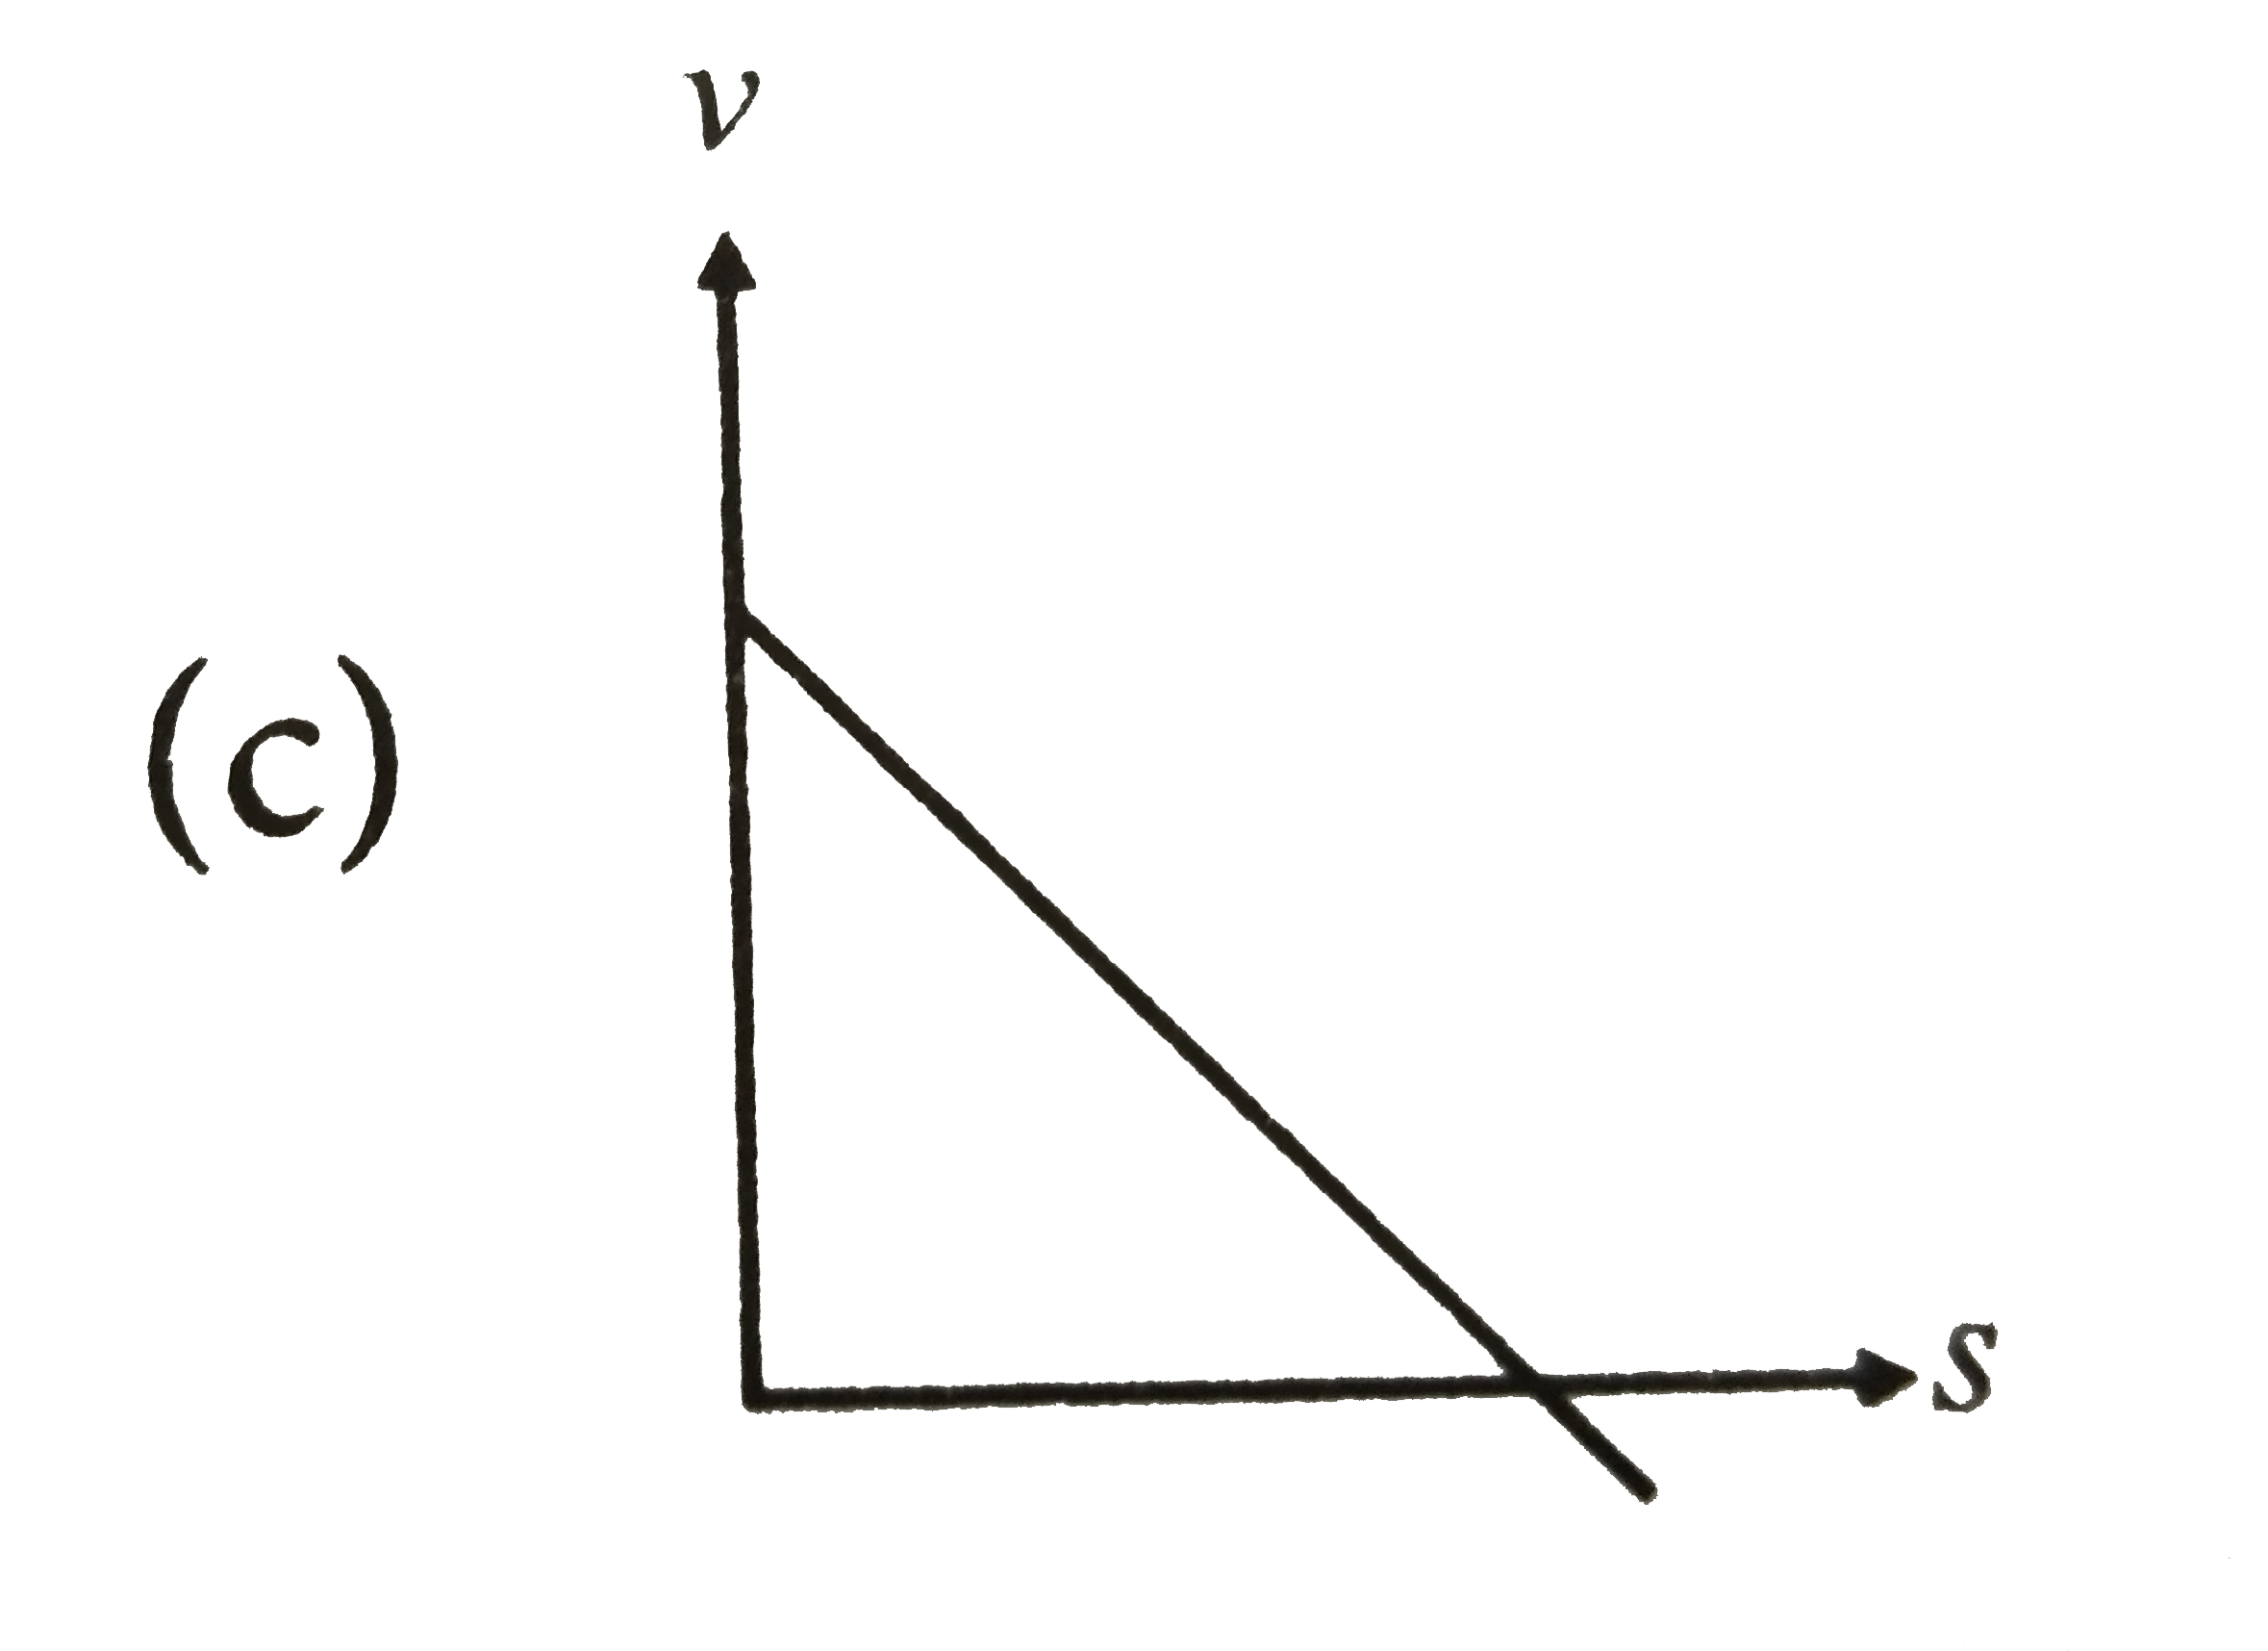 D
D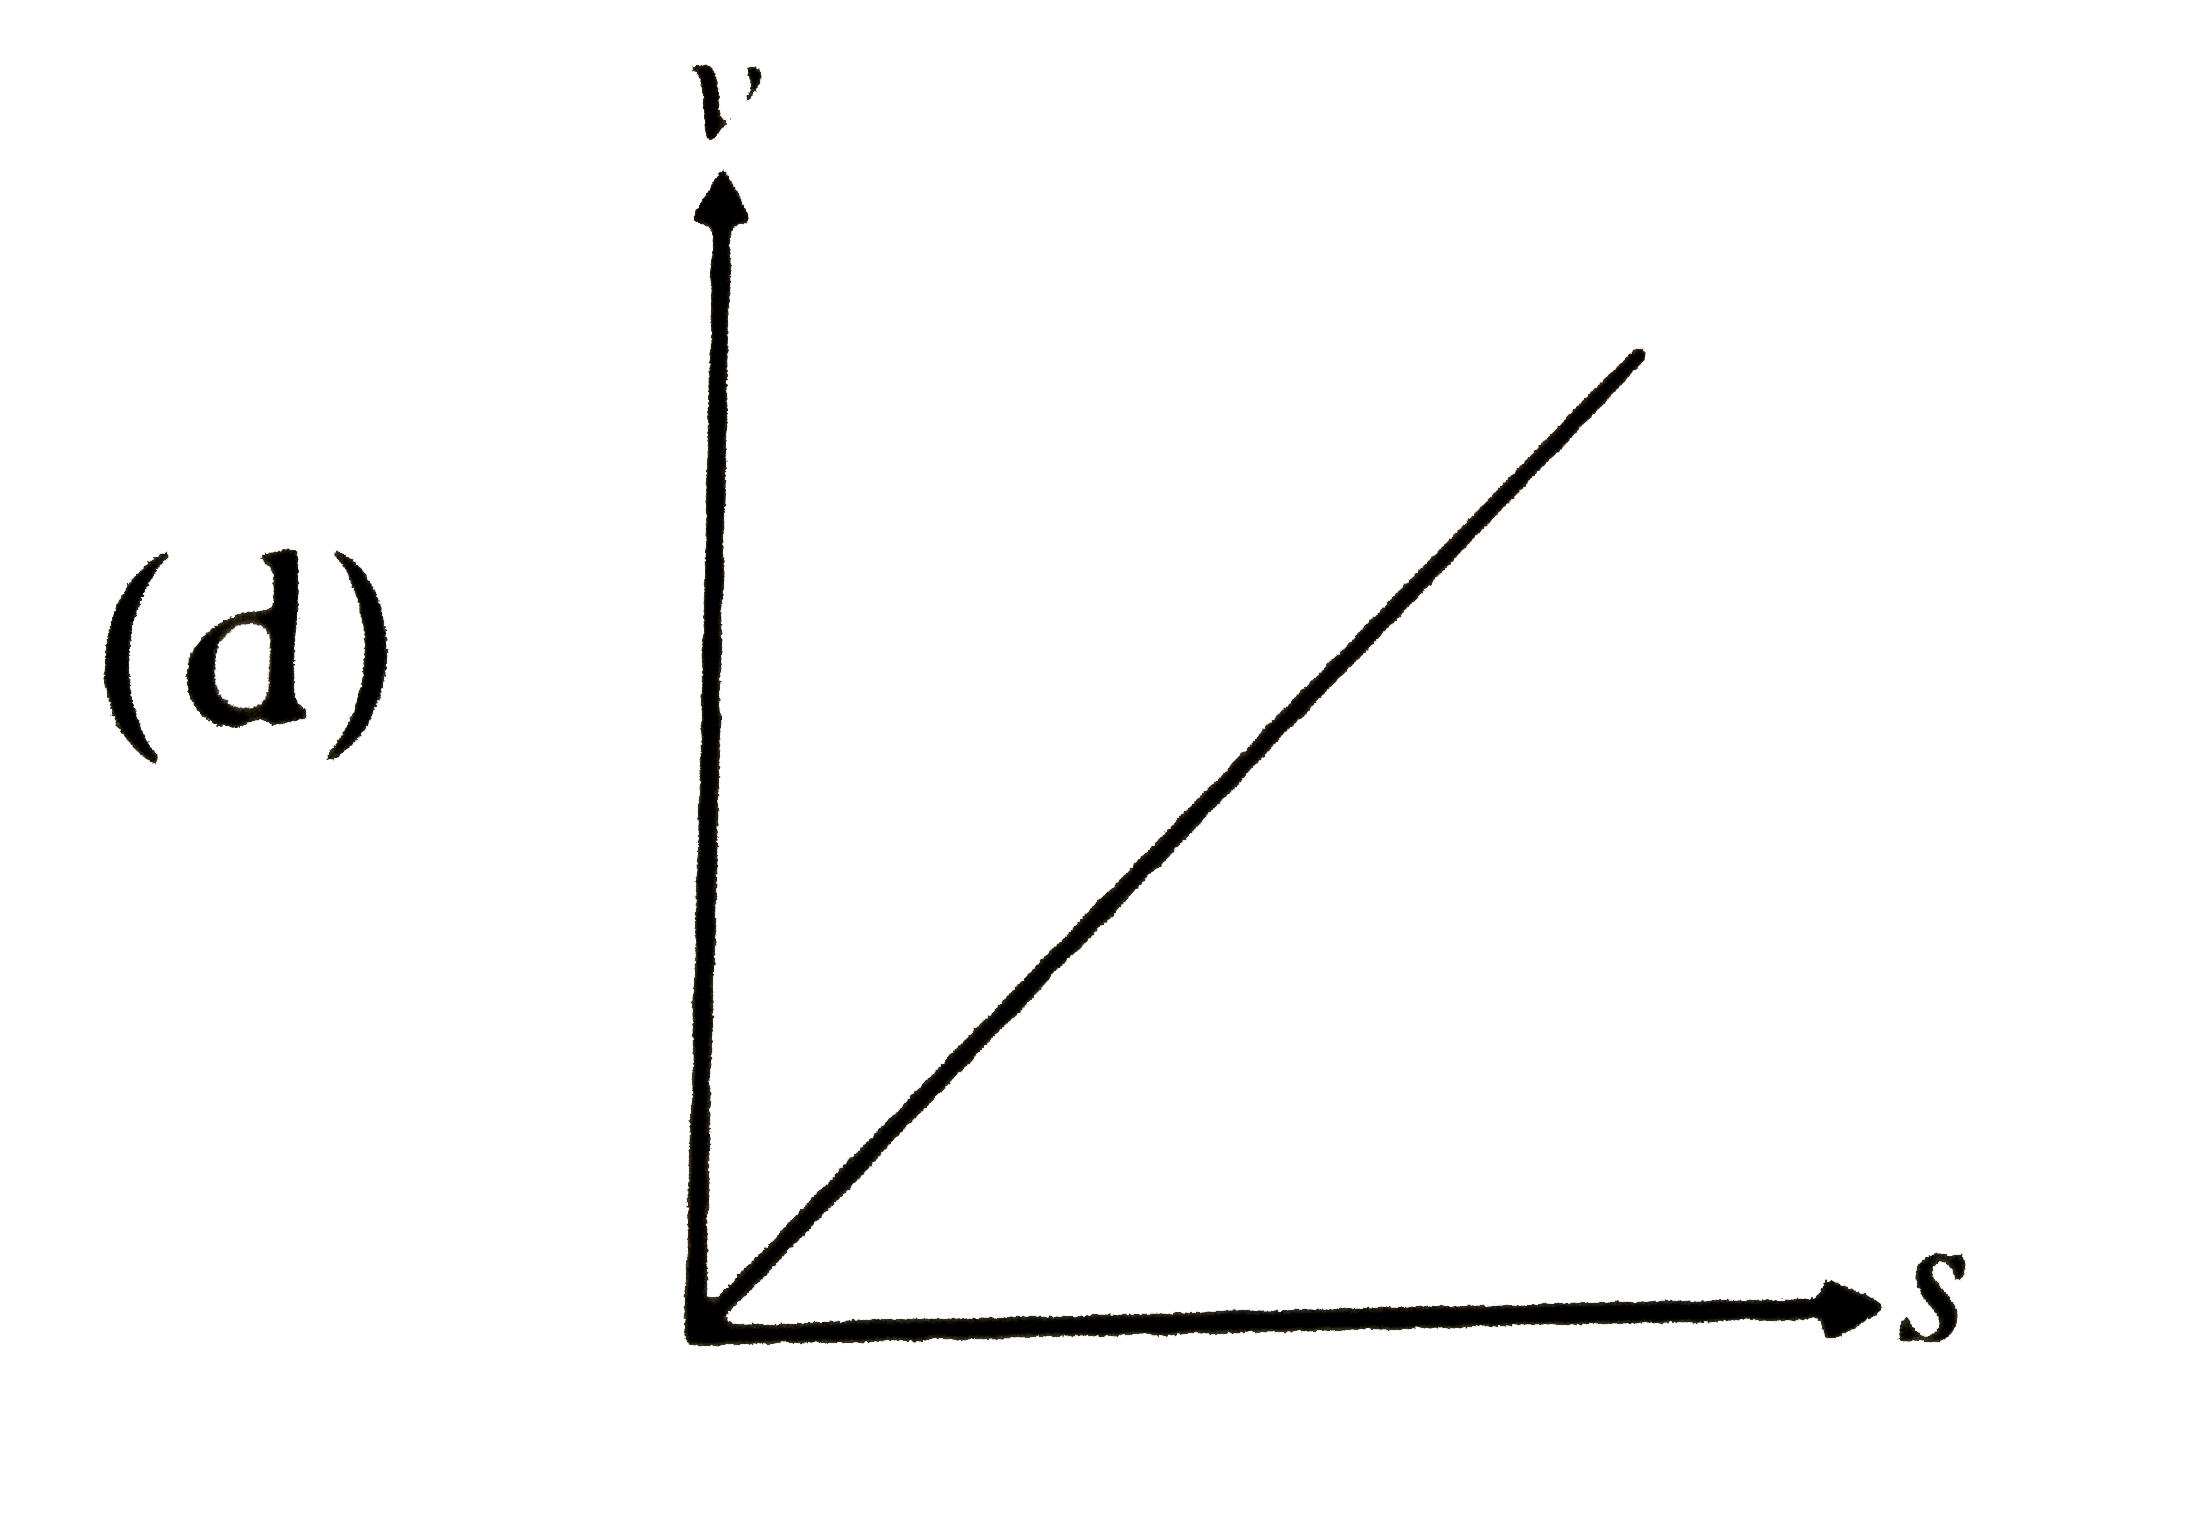
- Question 3 - Select One
The velocity time graph for a particle moving along x-axis is shown in the figure. The corresponding displacement time graph is correctly shown by
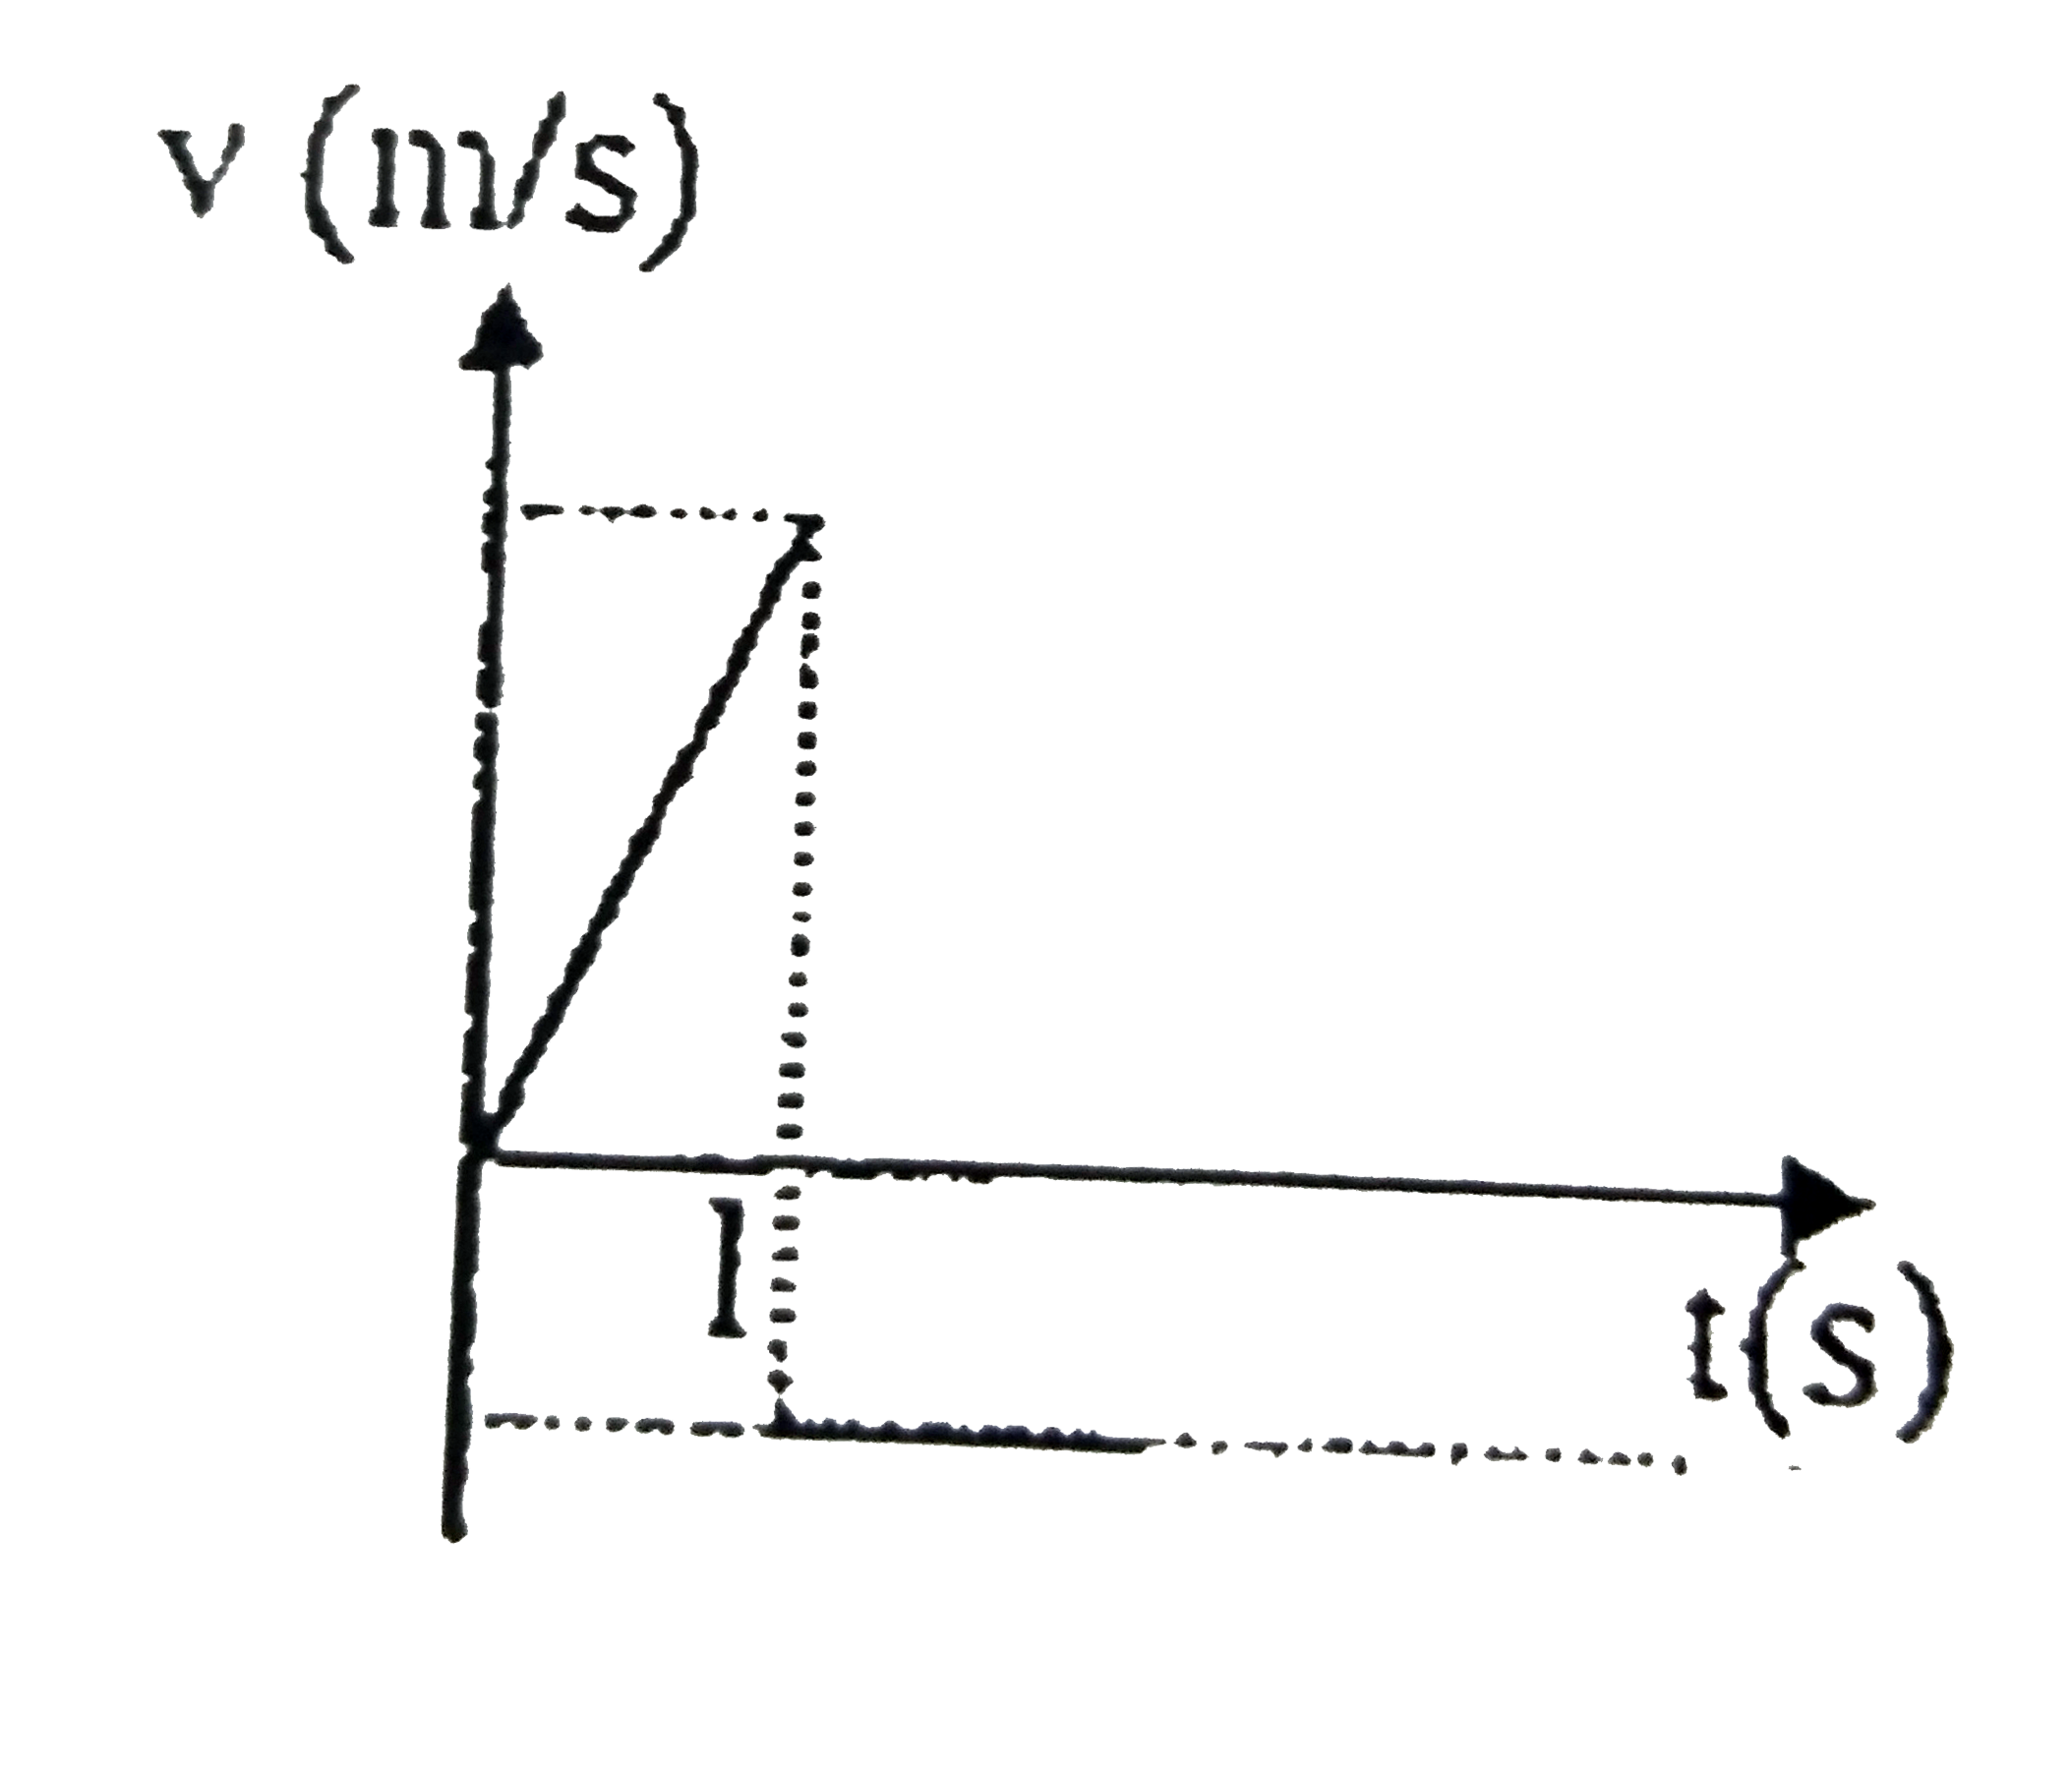 A
A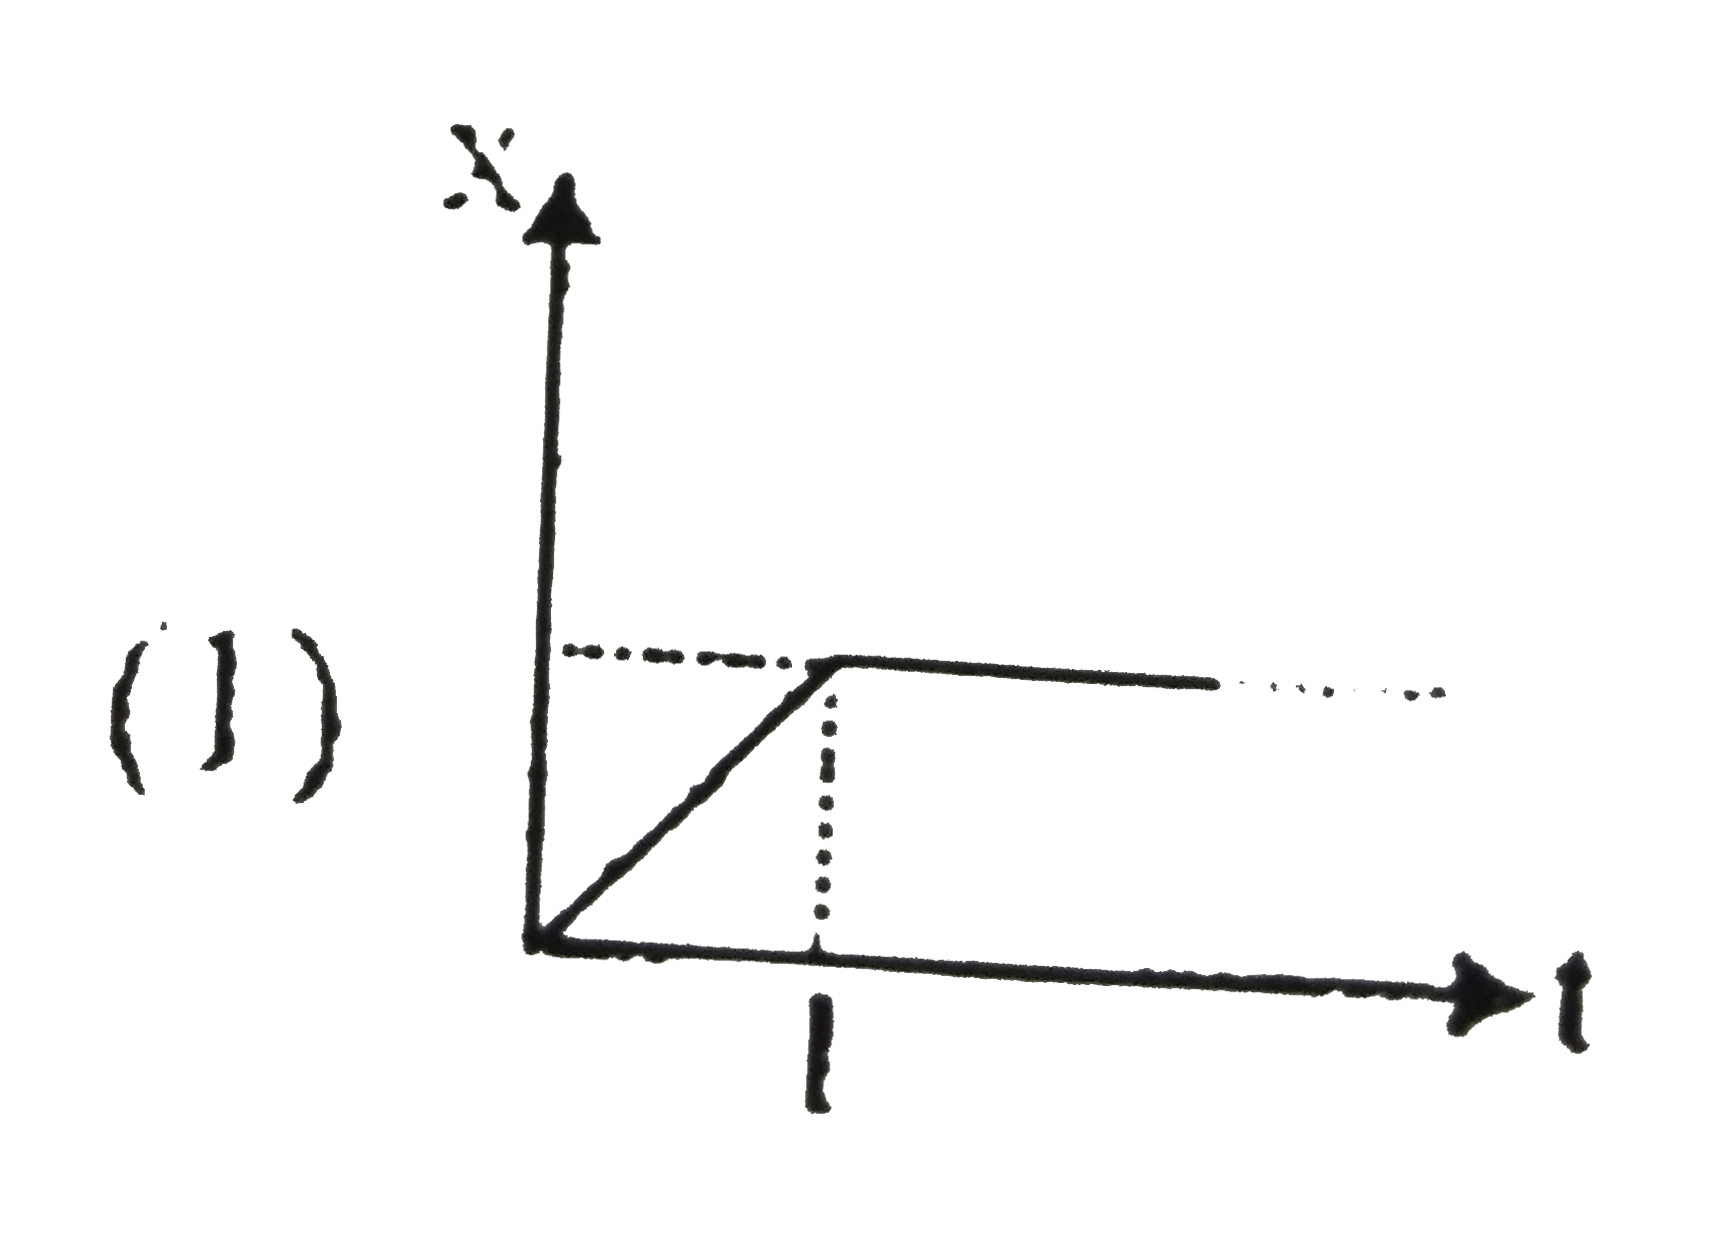 B
B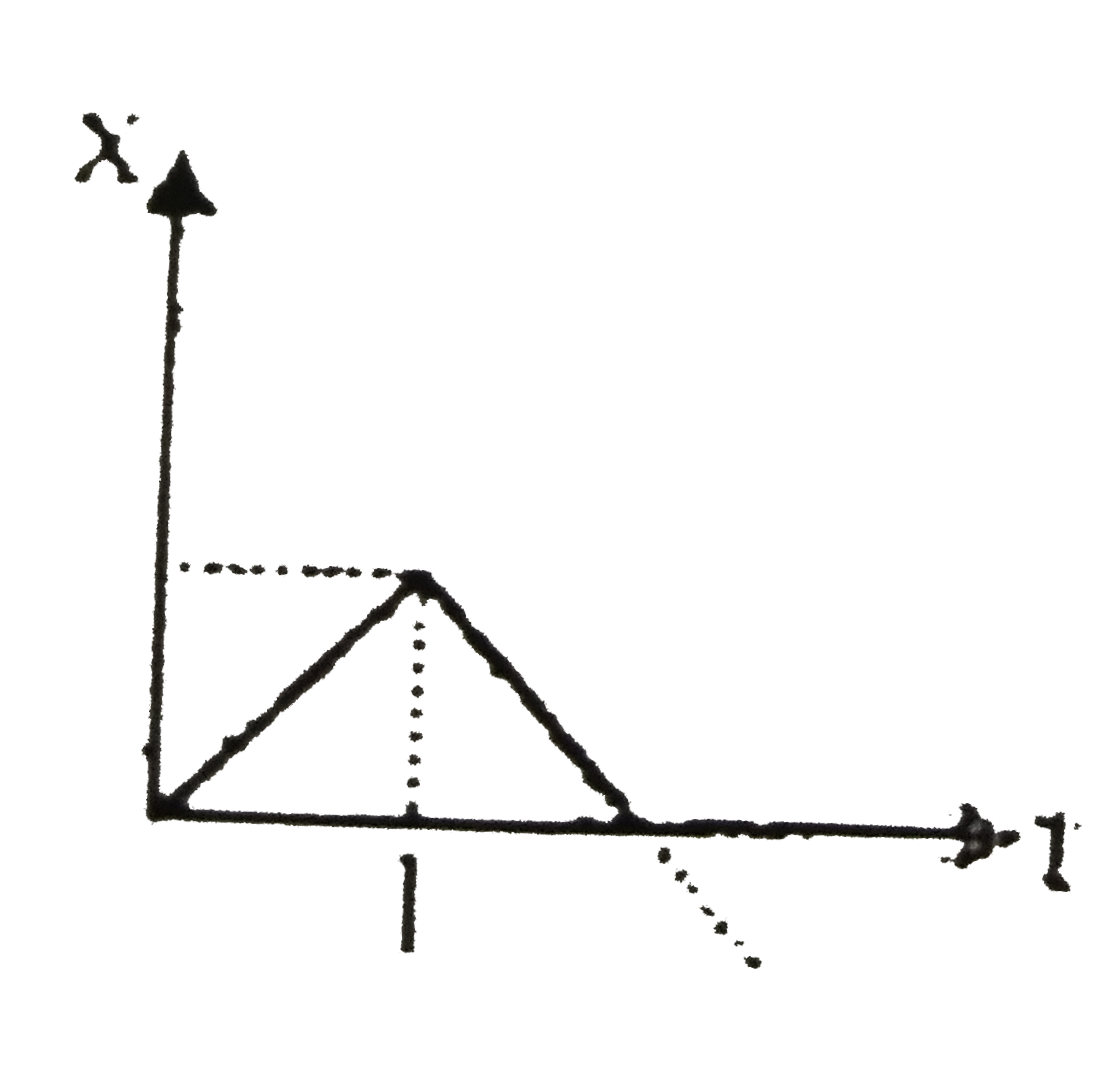 C
C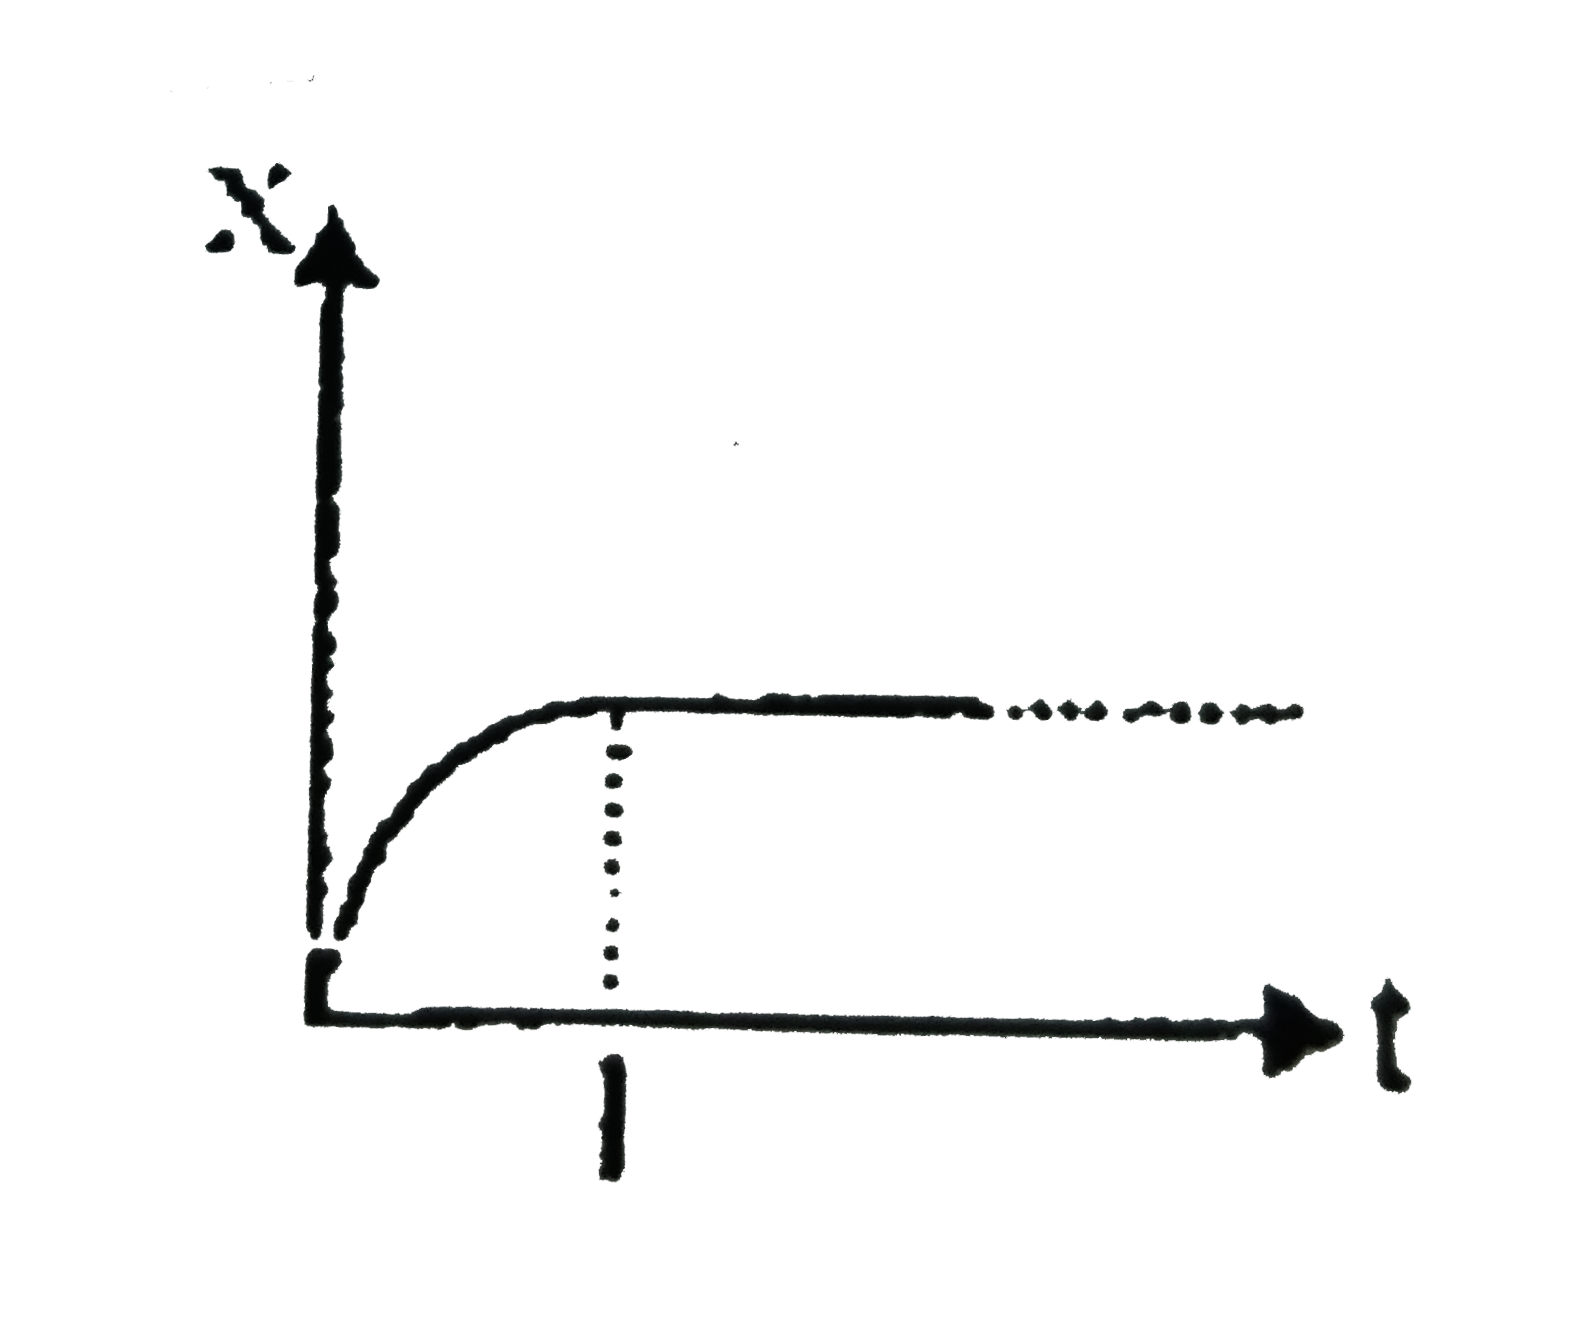 D
D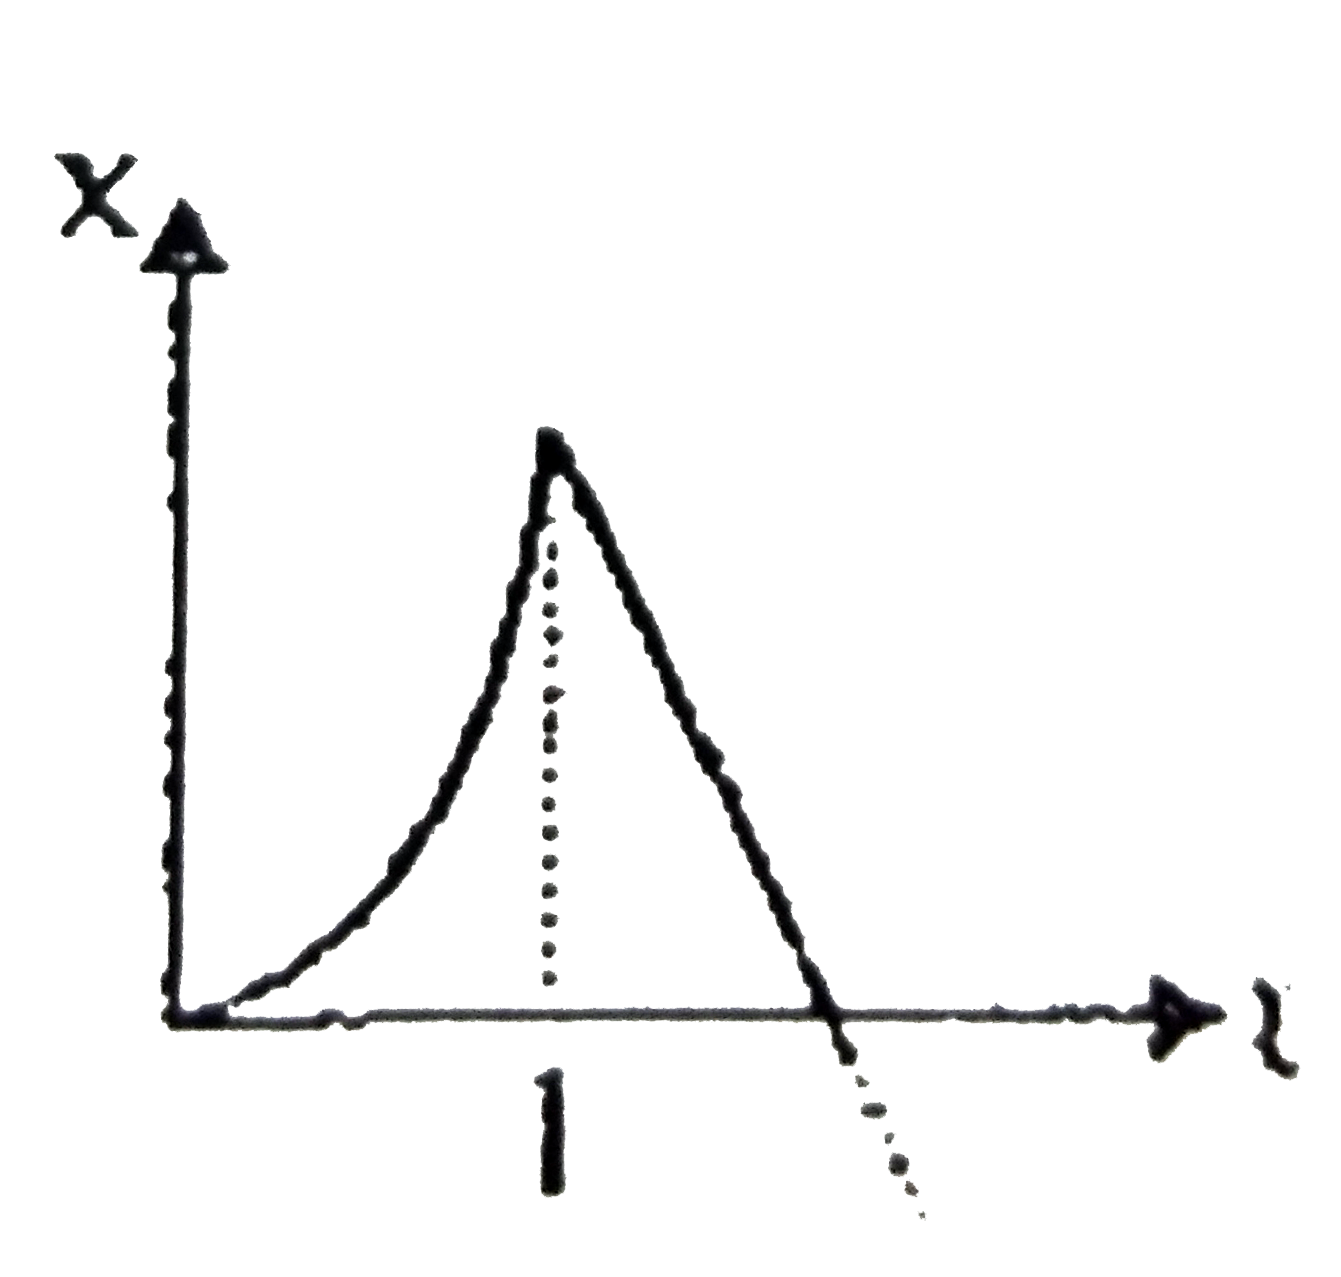
Consider the v-t diagram of a particle moving along x axis as shown below.Velocity is in m/s and time is in seconds v 4
View SolutionA particle is moving in a straight line under constant acceleration alpha. If the intial velocity is v0, sketch the v-t and s-t graphs. (v0>0).
View SolutionConsider the v-t diagram of a particle moving along x axis as shown below.Velocity is in m/s and time is in seconds y 4
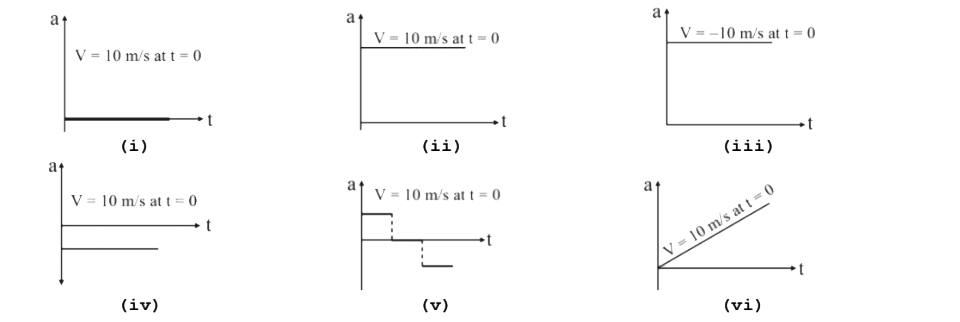
View SolutionDraw the v-t graphs for the given a-t graphs for a particle moving in one dimension.
 View Solution
The velocity time graph for a particle moving along X-axis is shown in the figure. The corresponding displacement time graph is correctly shown by
 View Solution

