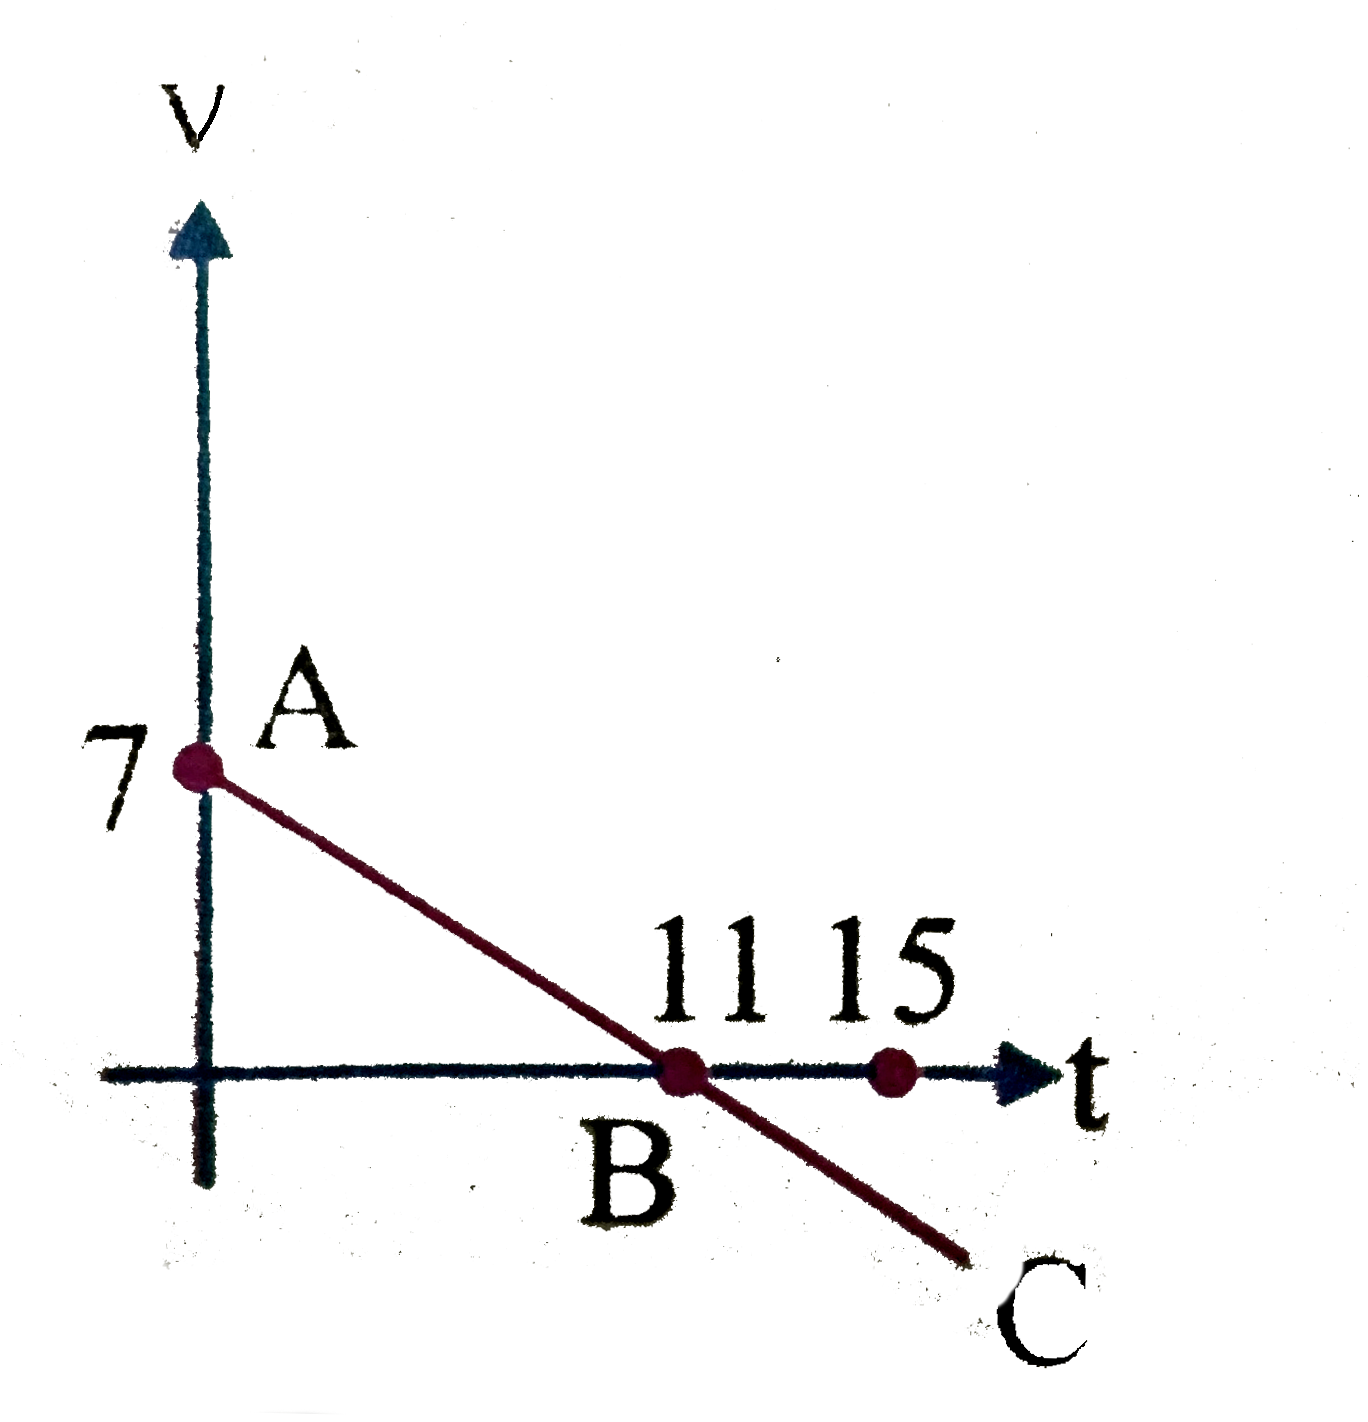
Velocity-time graph for the motion of a certain body is shown in fig. Explain the nature of this motion. Find the initial velocity and acceleration and write the equation for the variation of displacement with time. What happens to the moving body at point B? how will the body more after this moment?
Video Solution
Text Solution
The velocity-time graph is a straight line with -ve slope, the motion is uniformly retarding one upto point B and uniformly accelerated after with -ve side of velocity axis.
At point B the vody stops and then it direction of velocity reversed.
The initial velocity at point A is v0=7ms−1
a=ΔvΔt=vt−v0Δt=0−711=−0.6364km−2≈−0.64ms−2
The equation of motion for the variation of displacement with time is
s=7t−120.64t2=7t−0.32t2
|
Updated on:21/07/2023
Topper's Solved these Questions
- BOOK - NARAYNACHAPTER - MOTION IN A STRAIGHT LINEEXERCISE - C.U.Q42videos
MOTION IN A STRAIGHT LINE
- BOOK - NARAYNACHAPTER - MOTION IN A STRAIGHT LINEEXERCISE - Level 1 C.W20videos
MOTION IN A STRAIGHT LINE
- BOOK - NARAYNACHAPTER - MOTION IN A PLANEEXERCISE - Level-II(H.W)31videos
MOTION IN A PLANE
- BOOK - NARAYNACHAPTER - NEWTONS LAWS OF MOTIONEXERCISE - PASSAGE TYPE QUESTION6videos
NEWTONS LAWS OF MOTION
Similar Questions
Knowledge Check
- Question 1 - Select One
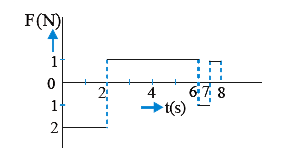
A force-time graph for the motion of a body is shown in fig. change in linear momentum between 0 and 8 s is:-
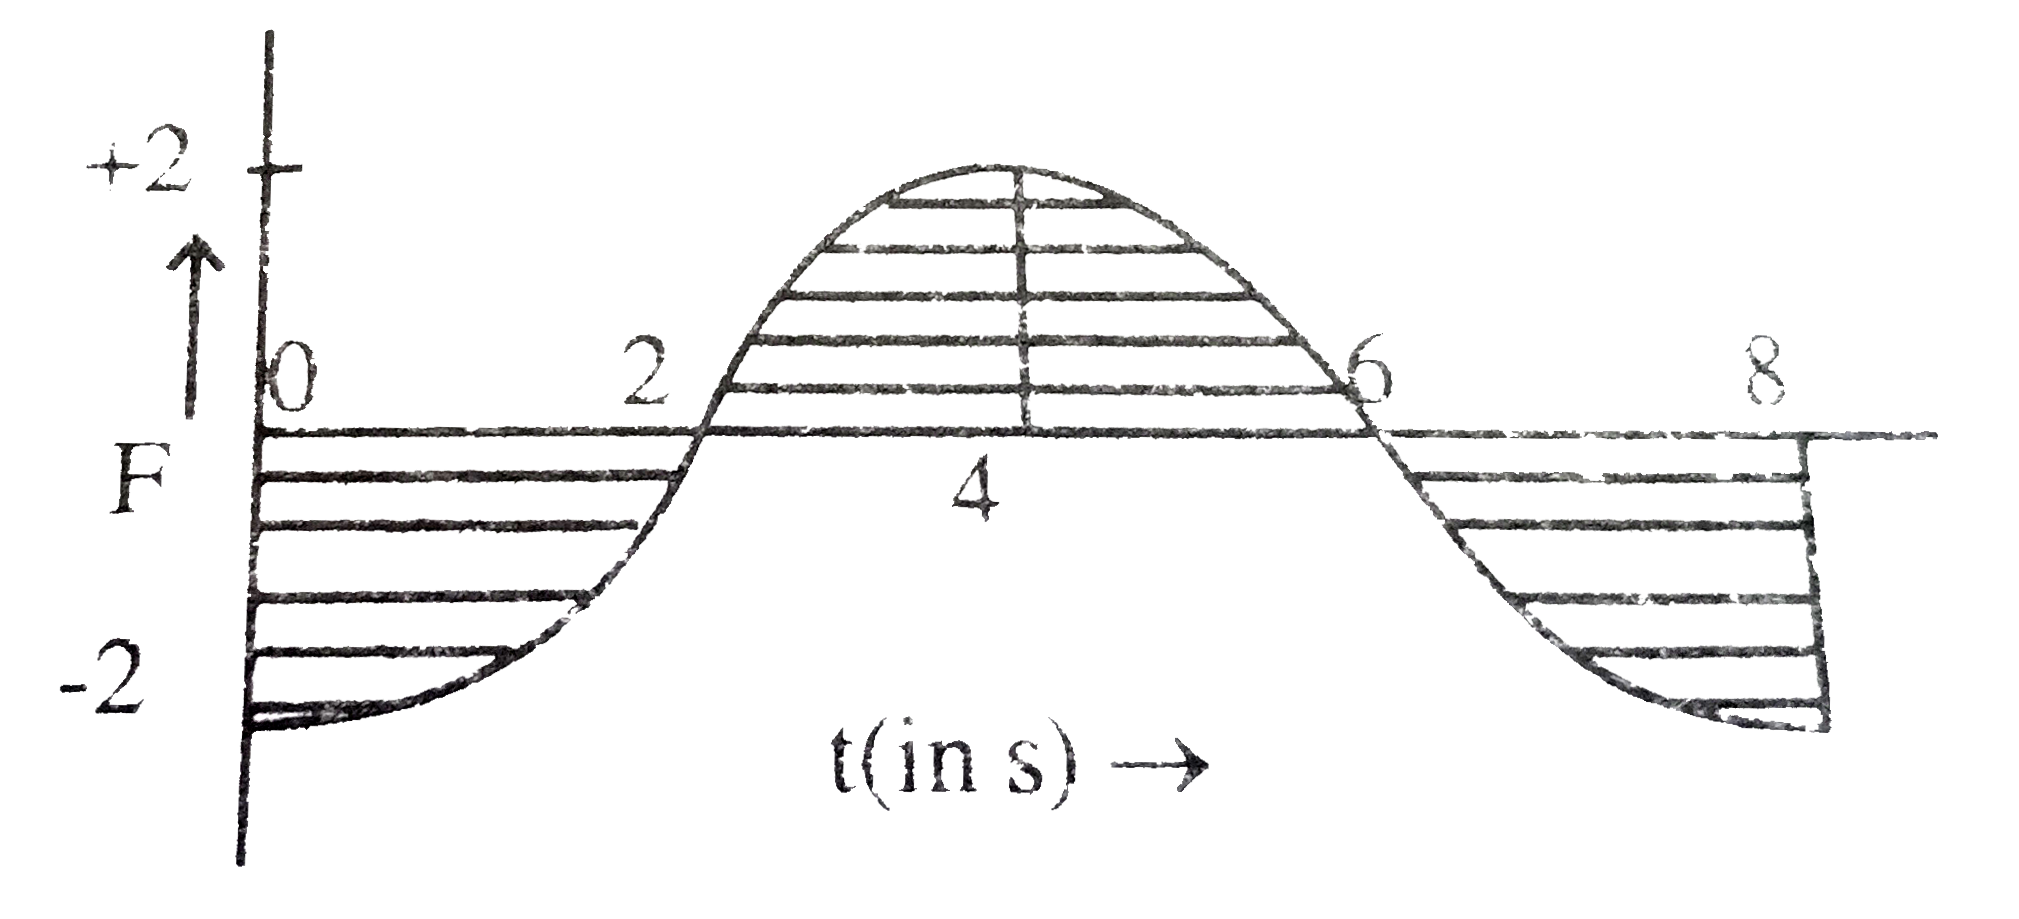 AZeroB4N-sC8NsDNone
 - Question 2 - Select One
The velocity-time graph of a body is shown in the figure, it implies that at point B
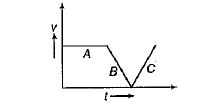 Athe force Is zeroBthere is a force toward motionCthere Is a force which opposes motionDthere is only gravitational force
 - Question 3 - Select One or More
The velocity-time graph of a body moving in a straight line is shown in the figure.
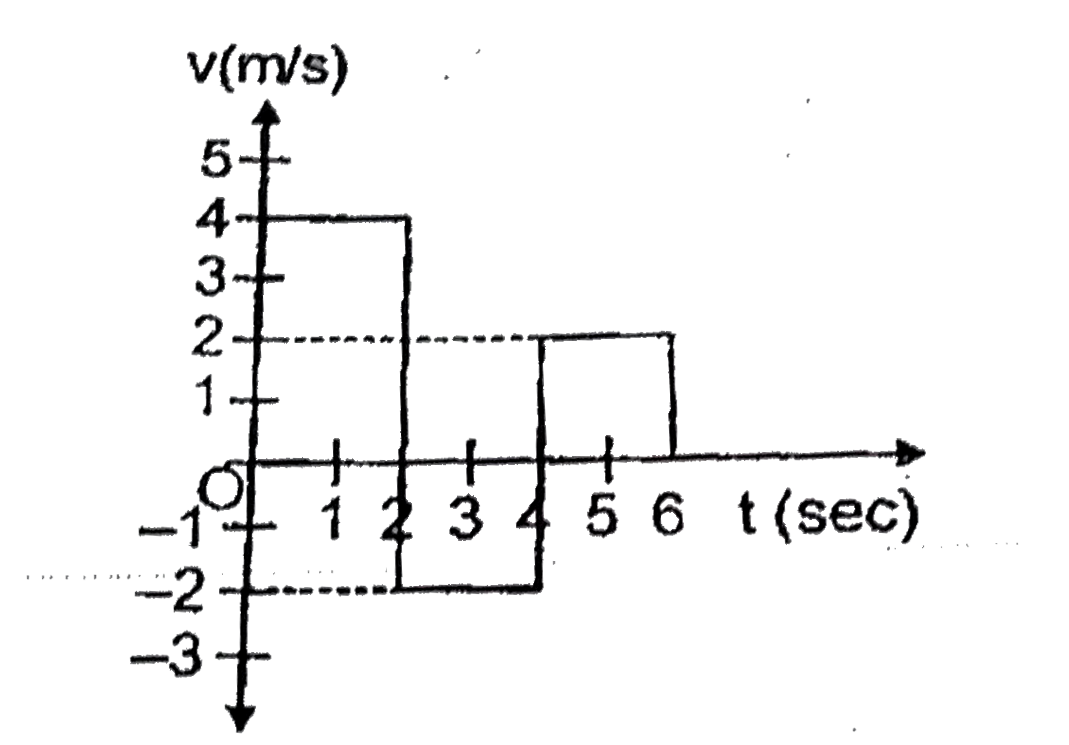 AThe magnitude of displacement of the body in 1st 2 sec is 8 mBThe magnitude of displacement of the body in 1st 4 sec is 4 mCThe distance travelled in 1st 2 sec is 8 mDThe distance travelled in 1st 4 sec is 12 m
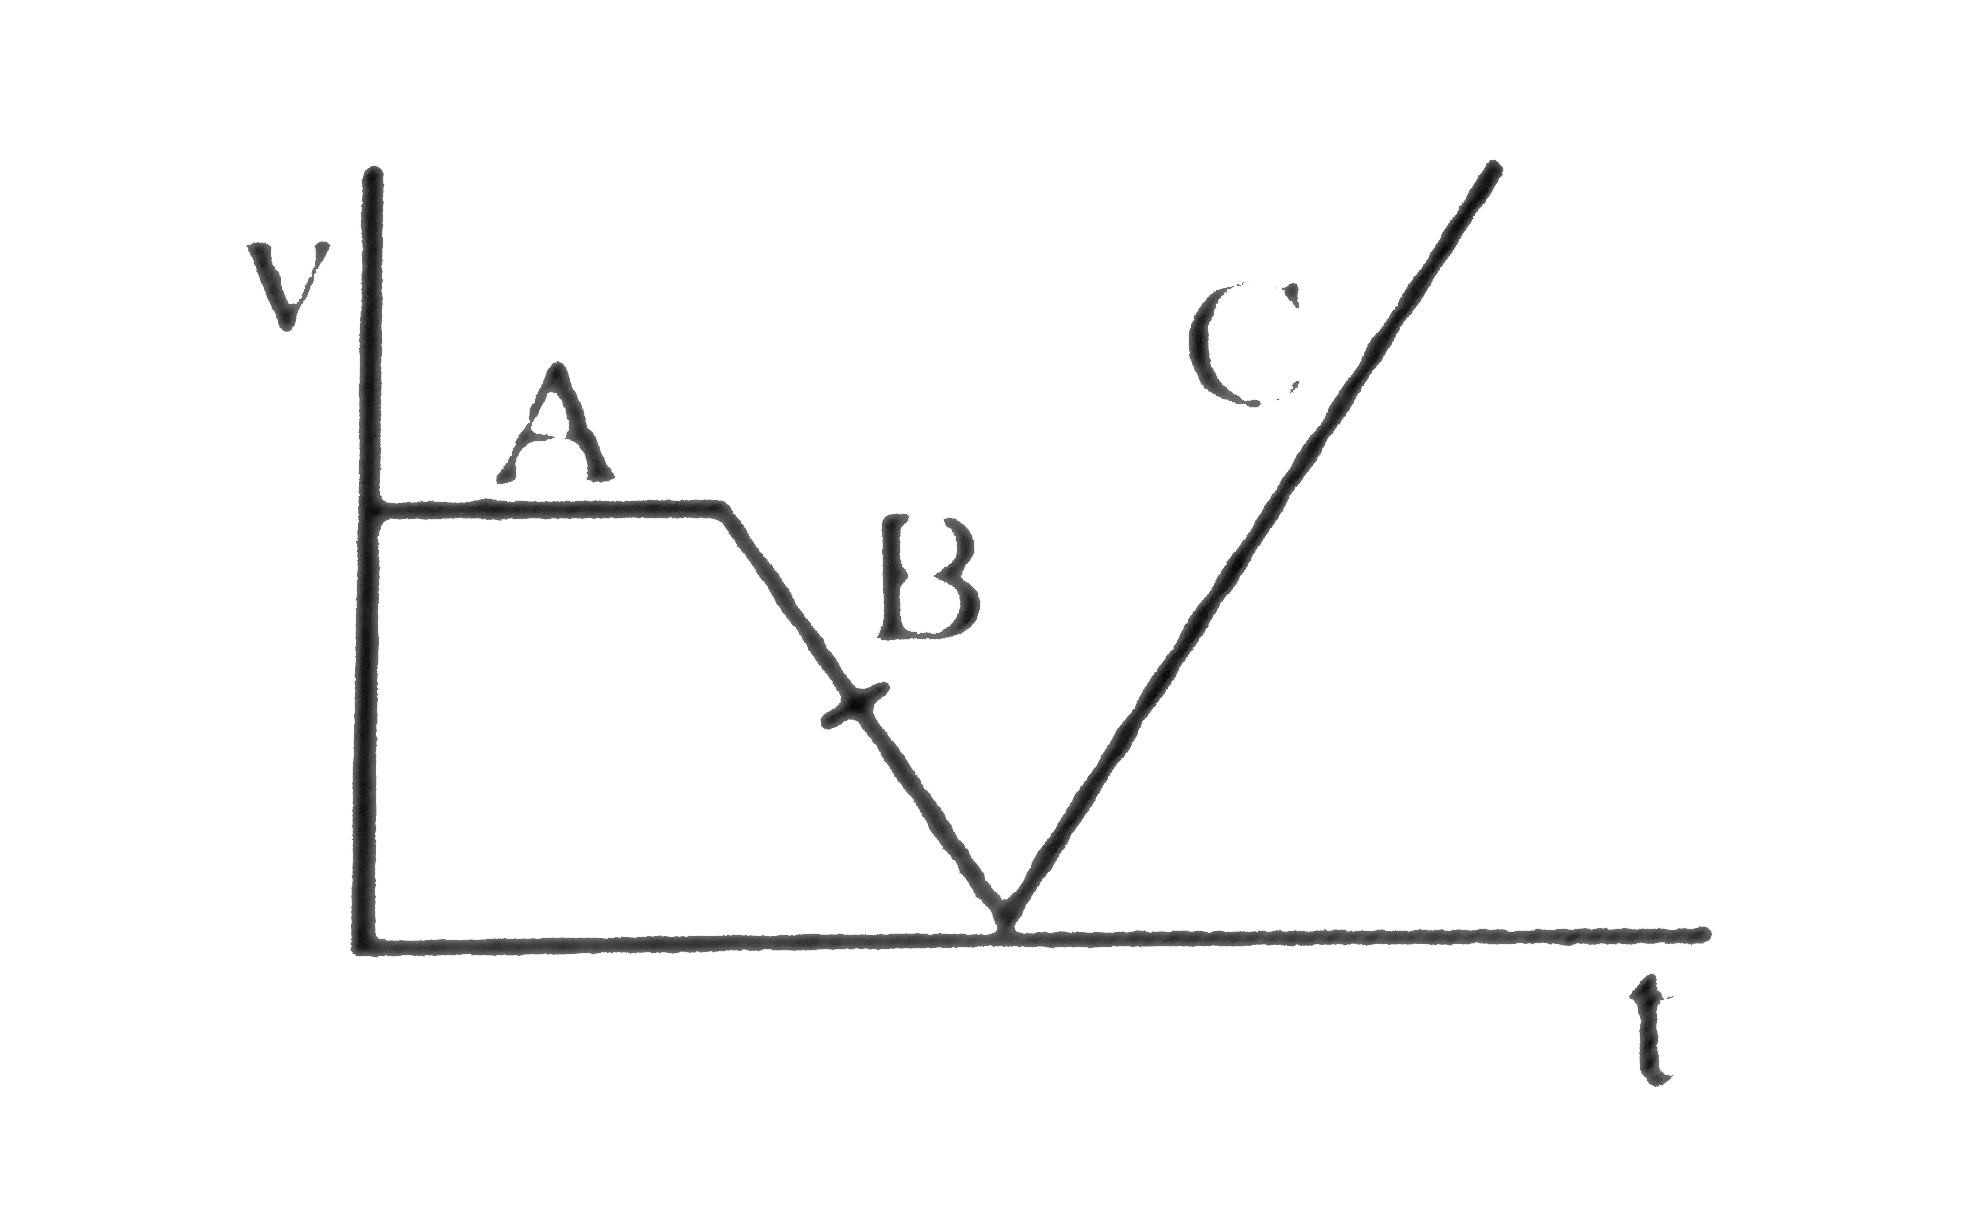
Velocity versus time graph of a body is shown in figure. It explains that
 View Solution
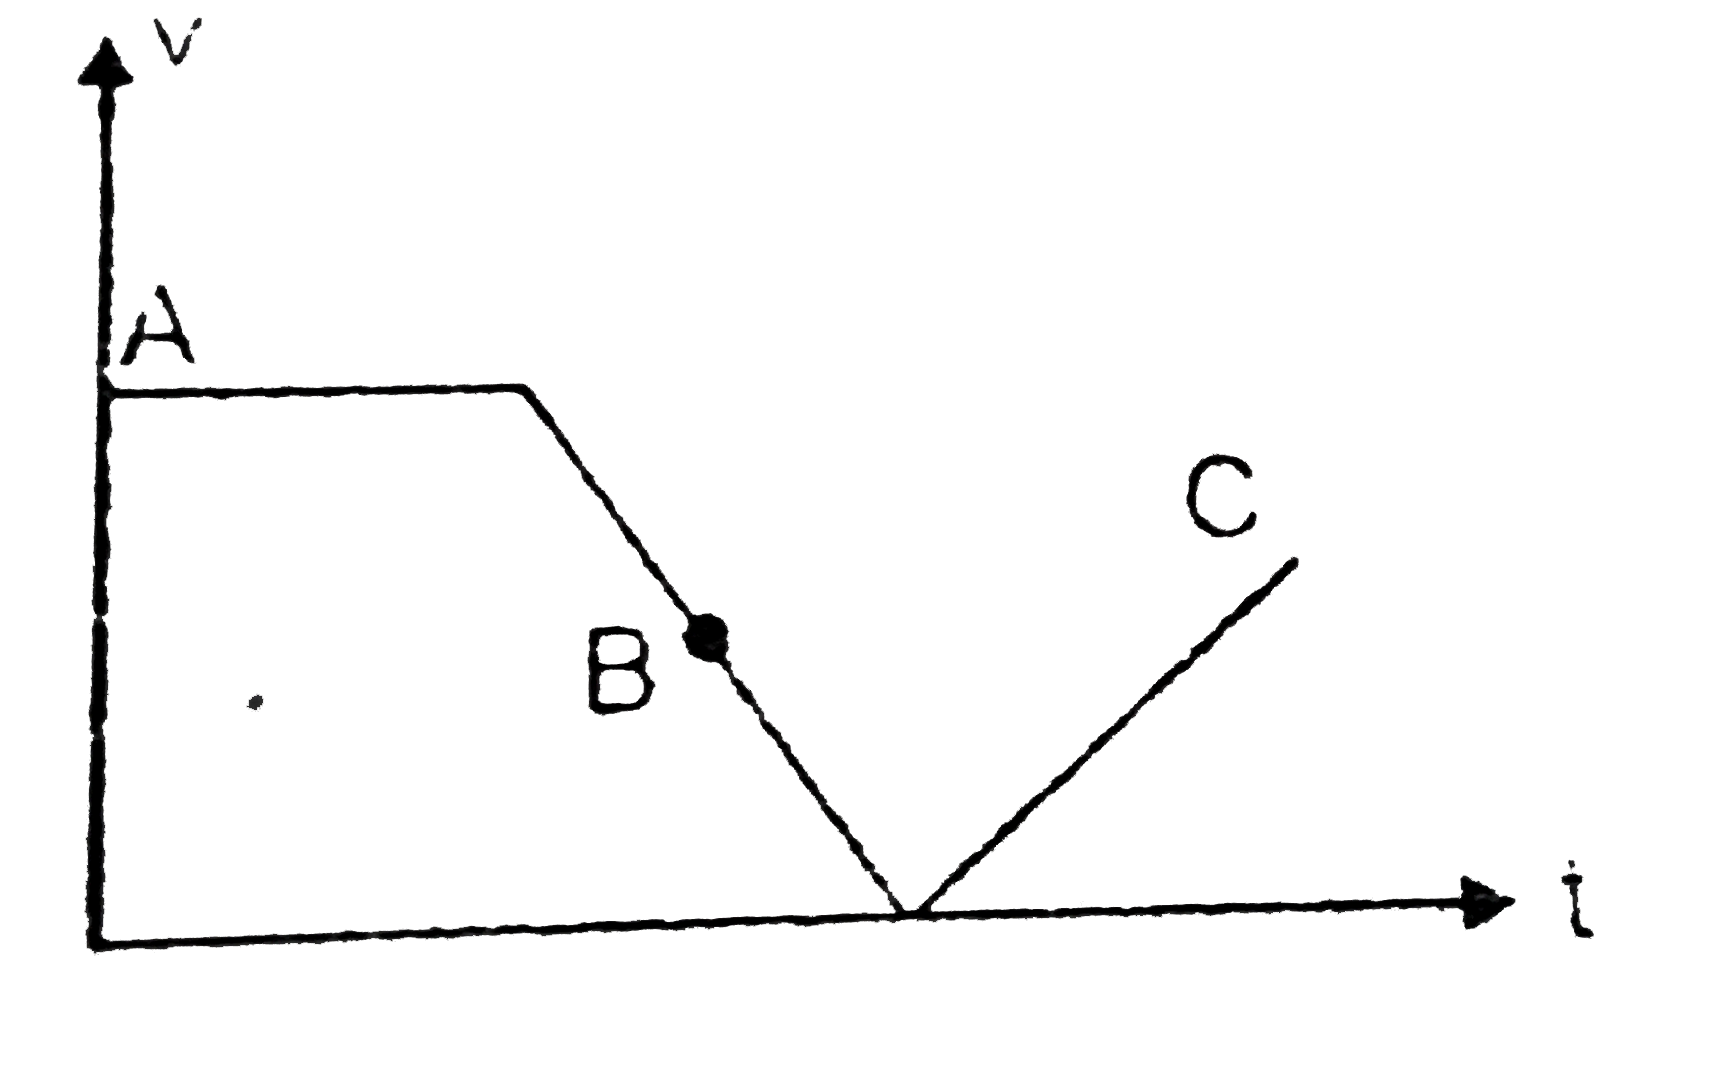
The velocity time graph of a body is shown in fig. it indicates that :
 View Solution
The veloctiy - time graph of a body is shown in the fig. It implies that at point B.
 View Solution
The velocity -time graph for a body with non-uniform motion is a
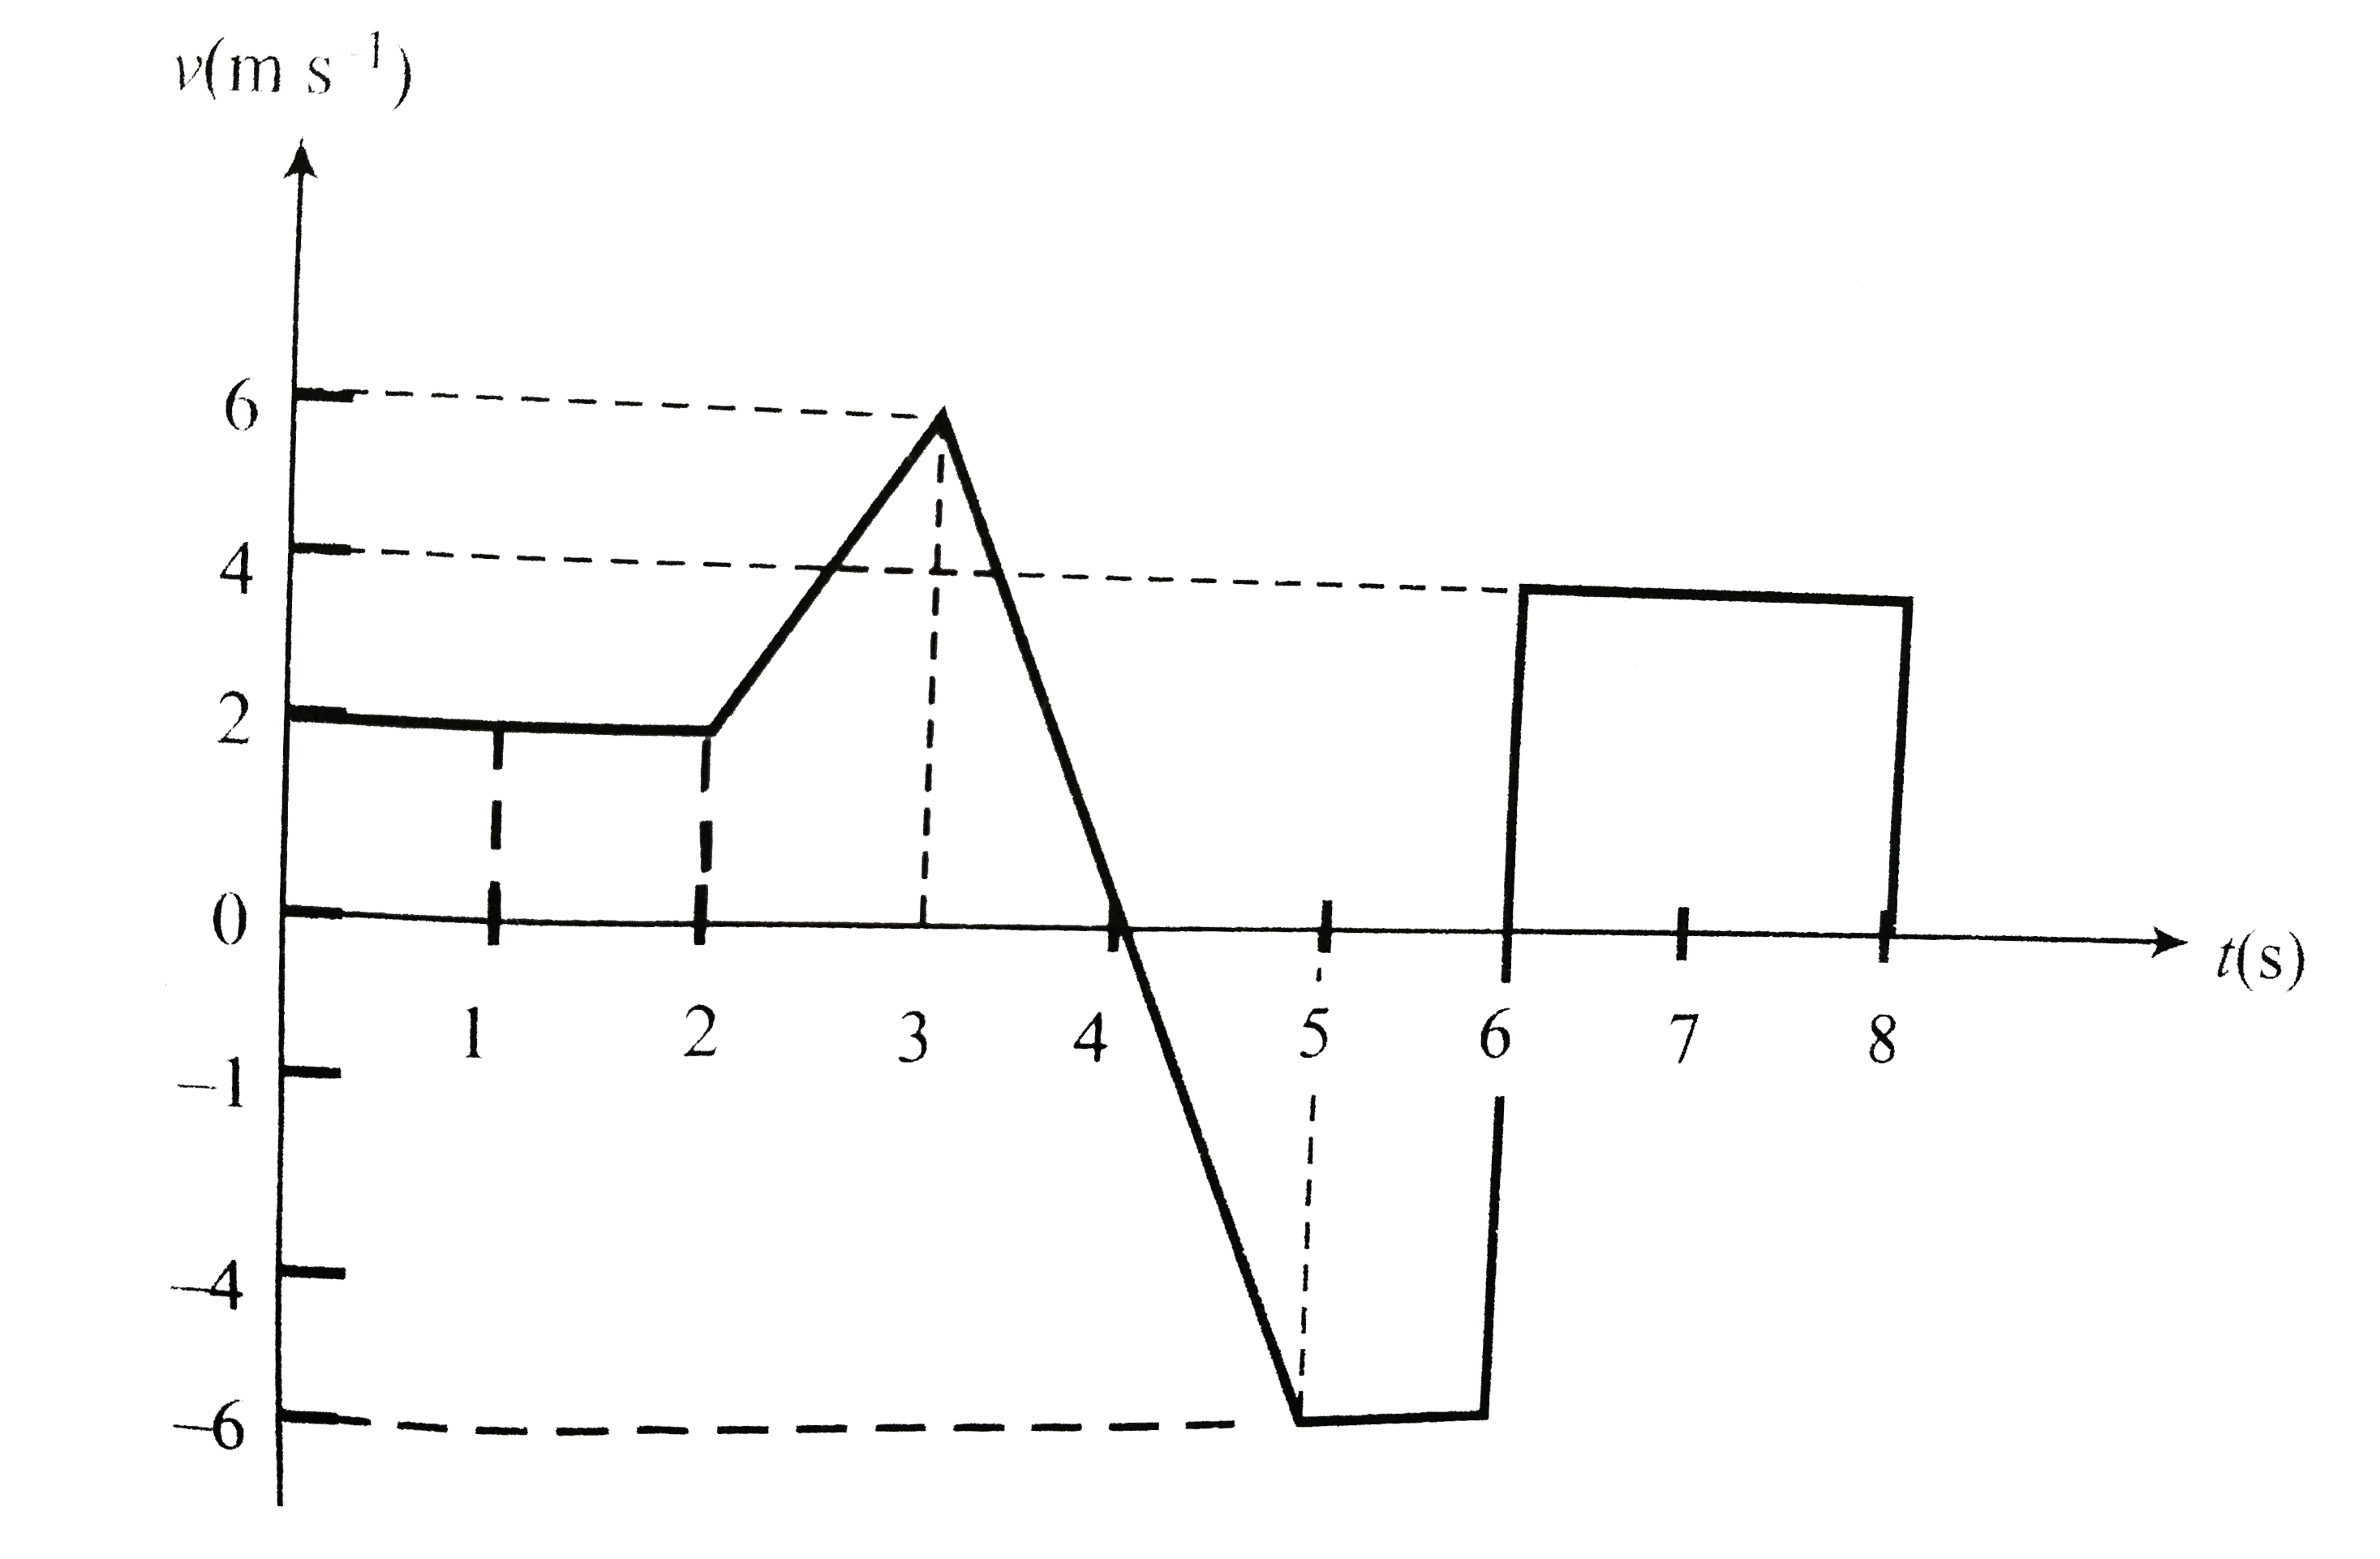
View SolutionThe velocity-time graph of a body is shown in .
The displacement of the body in 8s is.
 .View Solution


