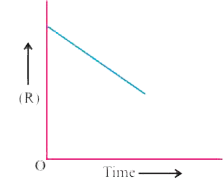
For a certain chemical reaction, variation in the concentration in [R]
vs time (s) plot is given in the Fig. :
For this reaction write/draw
(i) what is the order of the reaction ?
(ii) what are the units of rate constant k ?
(iii) give the relationship between k and t1/2 (half life period)
(iv) what does the slope of the line indicate ?
(v) draw the plot log {[R]0/[R]} vs time (s).
![For a certain chemical reaction, variation in the concentration in [R] vs time (s) plot is given in the Fig. : For this reaction write/draw (i) what is the order of the reaction ? (ii) what are the units of rate constant k ? (iii) give the relationship between k and t(1//2) (half life period) (iv) what does the slope of the line indicate ? (v) draw the plot log {[R](0)//[R]} vs time (s).](https://d10lpgp6xz60nq.cloudfront.net/physics_images/PR_CHE_V01_XII_C04_E05_012_Q01.png)
(i) Reaction is of first order. (ii) s−1 (iii) t1/2=0.693/k
(iv) For 1 st order reactions, ln [R]=−kt+log[R]0
Slope of the line = -k, i.e., it has a negative slope equal in magnitude to rate constant.
Topper's Solved these Questions
- CHEMICAL KINETICSBOOK - PRADEEPCHAPTER - CHEMICAL KINETICSEXERCISE - CONCEPTUAL QUESTIONS (V. First order reactions, pseudo first order reactions and radioactive disintegration)
3 Videos
- CHEMICAL KINETICSBOOK - PRADEEPCHAPTER - CHEMICAL KINETICSEXERCISE - CONCEPTUAL QUESTIONS (VI. Activation energy, effect of temp. on rate (Arrhenius eqn.) and effect of catalyst on rate)
9 Videos
- CHEMICAL KINETICSBOOK - PRADEEPCHAPTER - CHEMICAL KINETICSEXERCISE - CONCEPTUAL QUESTIONS (III. Molecularity of a reaction, its mechanism and difference between order and molecularity)
2 Videos
- BIOMOLECULES BOOK - PRADEEPCHAPTER - BIOMOLECULES EXERCISE - IMPORTANT QUESTIONS (FOR BOARD EXAMINATION)
25 Videos
- CHEMISTRY IN EVERYDAY LIFE BOOK - PRADEEPCHAPTER - CHEMISTRY IN EVERYDAY LIFE EXERCISE - IMPORTANT QUESTION FOR BOARD EXAMINATION
30 Videos
Similar Questions
For a chemical reactio , variation in the concentration [R] Vs time (s) plot is given:
For this chemical reaction, write/draw:
i) What is the order of the reaction?
ii) What are the units of the rate constant (k)?
iii) Give the relationship between k and t1/2 (half life period)
iv) What does the slope of the above line indicate?
v) Draw the plot log [R]0R Vs time (s).

View SolutionFor a chemical reaction R → P, the variation in the concentration (R) vs time (t) plot is given :

Predict the order of reaction.
View SolutionFor a chemical reaction R → P, the variation in the concentration (R) vs time (t) plot is given :

Write down its rate law.
View SolutionFor a chemical reaction R → P, the variation in the concentration (R) vs time (t) plot is given :

What is the slope of the curve ?
View SolutionFor a chemical reaction, variation in concentration [A] vs time (s) plot in given below:
i) Predict the order of the reaction.
ii) What does the slope of the line and intercept indicate ?
iii) What is the unit of rate constant(k)?
View Solution
For a certain chemical reaction variation in concentration [A] vs. time (s) plot is given below :
(i) Predict the order of the given reaction ?
(ii) What does the slope of the time and intercept indicate ?
(iii) What is the unit of rate constant k?
View Solution
For a certain chemical reaction variation in concentration [A] vs. time (s) plot is given below :
(i) Predict the order of the given reaction ?
(ii) What does the slope of the time and intercept indicate ?
(iii) What is the unit of rate constant k?
View SolutionFor a chemical reactin R → P, variation of concentration of R vs time plot is given below : For this reaction :
(i) Predict the order of reaction.
(ii) What is the unit of rate constant (k) ?
View SolutionFor a chemical reactin R → P, variation of concentration of R vs time plot is given below : For this reaction :
(i) Predict the order of reaction.
(ii) What is the unit of rate constant (k) ?
View SolutionFor chemical reaction R→P the variation in the concentration (R ) vs .Time (t) plot given as
(i) predict the order of the reaction
(ii) what is he slope of the curve?
View Solution
