A student draws a cumulative frequency curve for the marks obtained by 40 students of a class as shown below. Find the median marks obtained by the
students of the class.
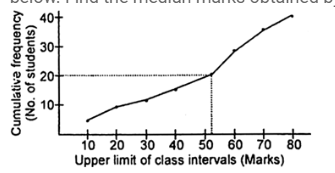
Step by step video & image solution for A student draws a cumulative frequency curve for the marks obtained by 40 students of a class as shown below. Find the median marks obtained by the students of the class. by Maths experts to help you in doubts & scoring excellent marks in Class 10 exams.
Updated on:21/07/2023Topper's Solved these Questions
Similar Questions
Knowledge Check
The table shows the marks obtained by 25 students in a class test. Find the mean of the marks obtained
 A7.72B7.65C7.4D7
The marks (maximum marks 100) obtained by 20 students in a test are given below :
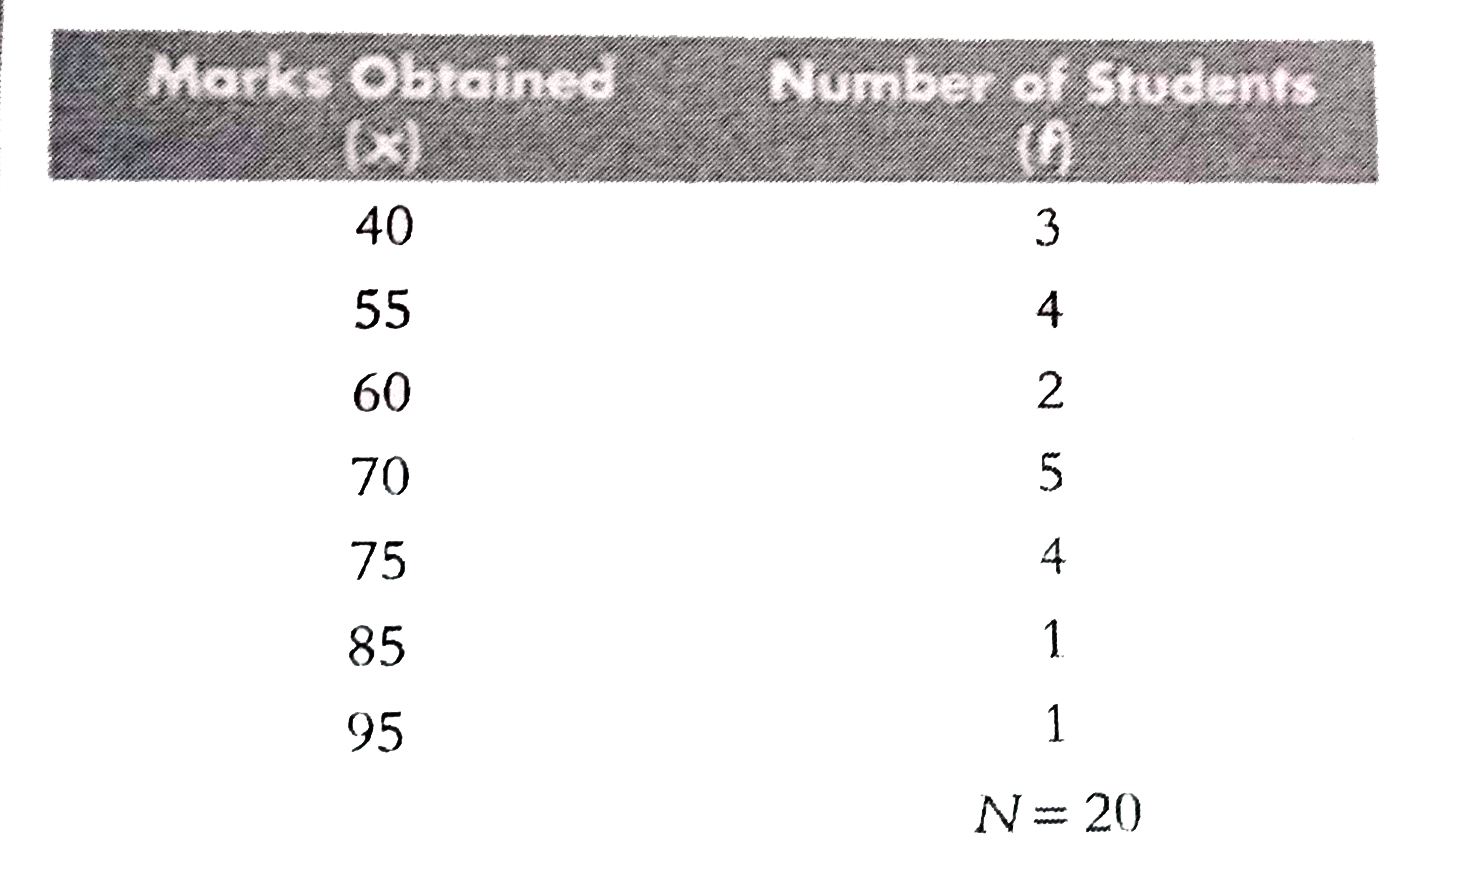
Find the mean marks of the 20 students.A64B64.5C54D54.5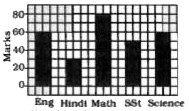
The above bar graph show the marks obtained by a students in an examination. What is the average marks obtained by the student ?A55B56C57D58
The table given below shows the marks obtained by 6 students in 3 subjects.
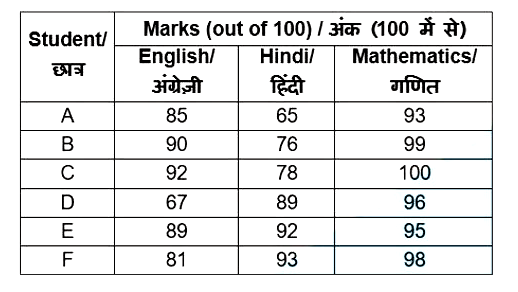
In which subject the total marks obtained by the given six students are highest?
View SolutionThe frequency distribution of marks obtained by students in a class test is given below .
Draw frequency polygon and ogive.

View SolutionGiven below are the marks obtained by the students of a class. Calculate mean deviation, and its coefficient, median of data:

View SolutionThe marks obtained by a student in examinations are given below :
80, 72, 84, 79, 90
find the average marks of the student
View SolutionThe histogram depicts the marks obtained by 45 students of a class. How many students obtained 50 or more marks and less than 70?
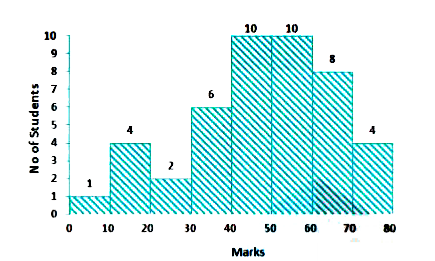
View Solution


