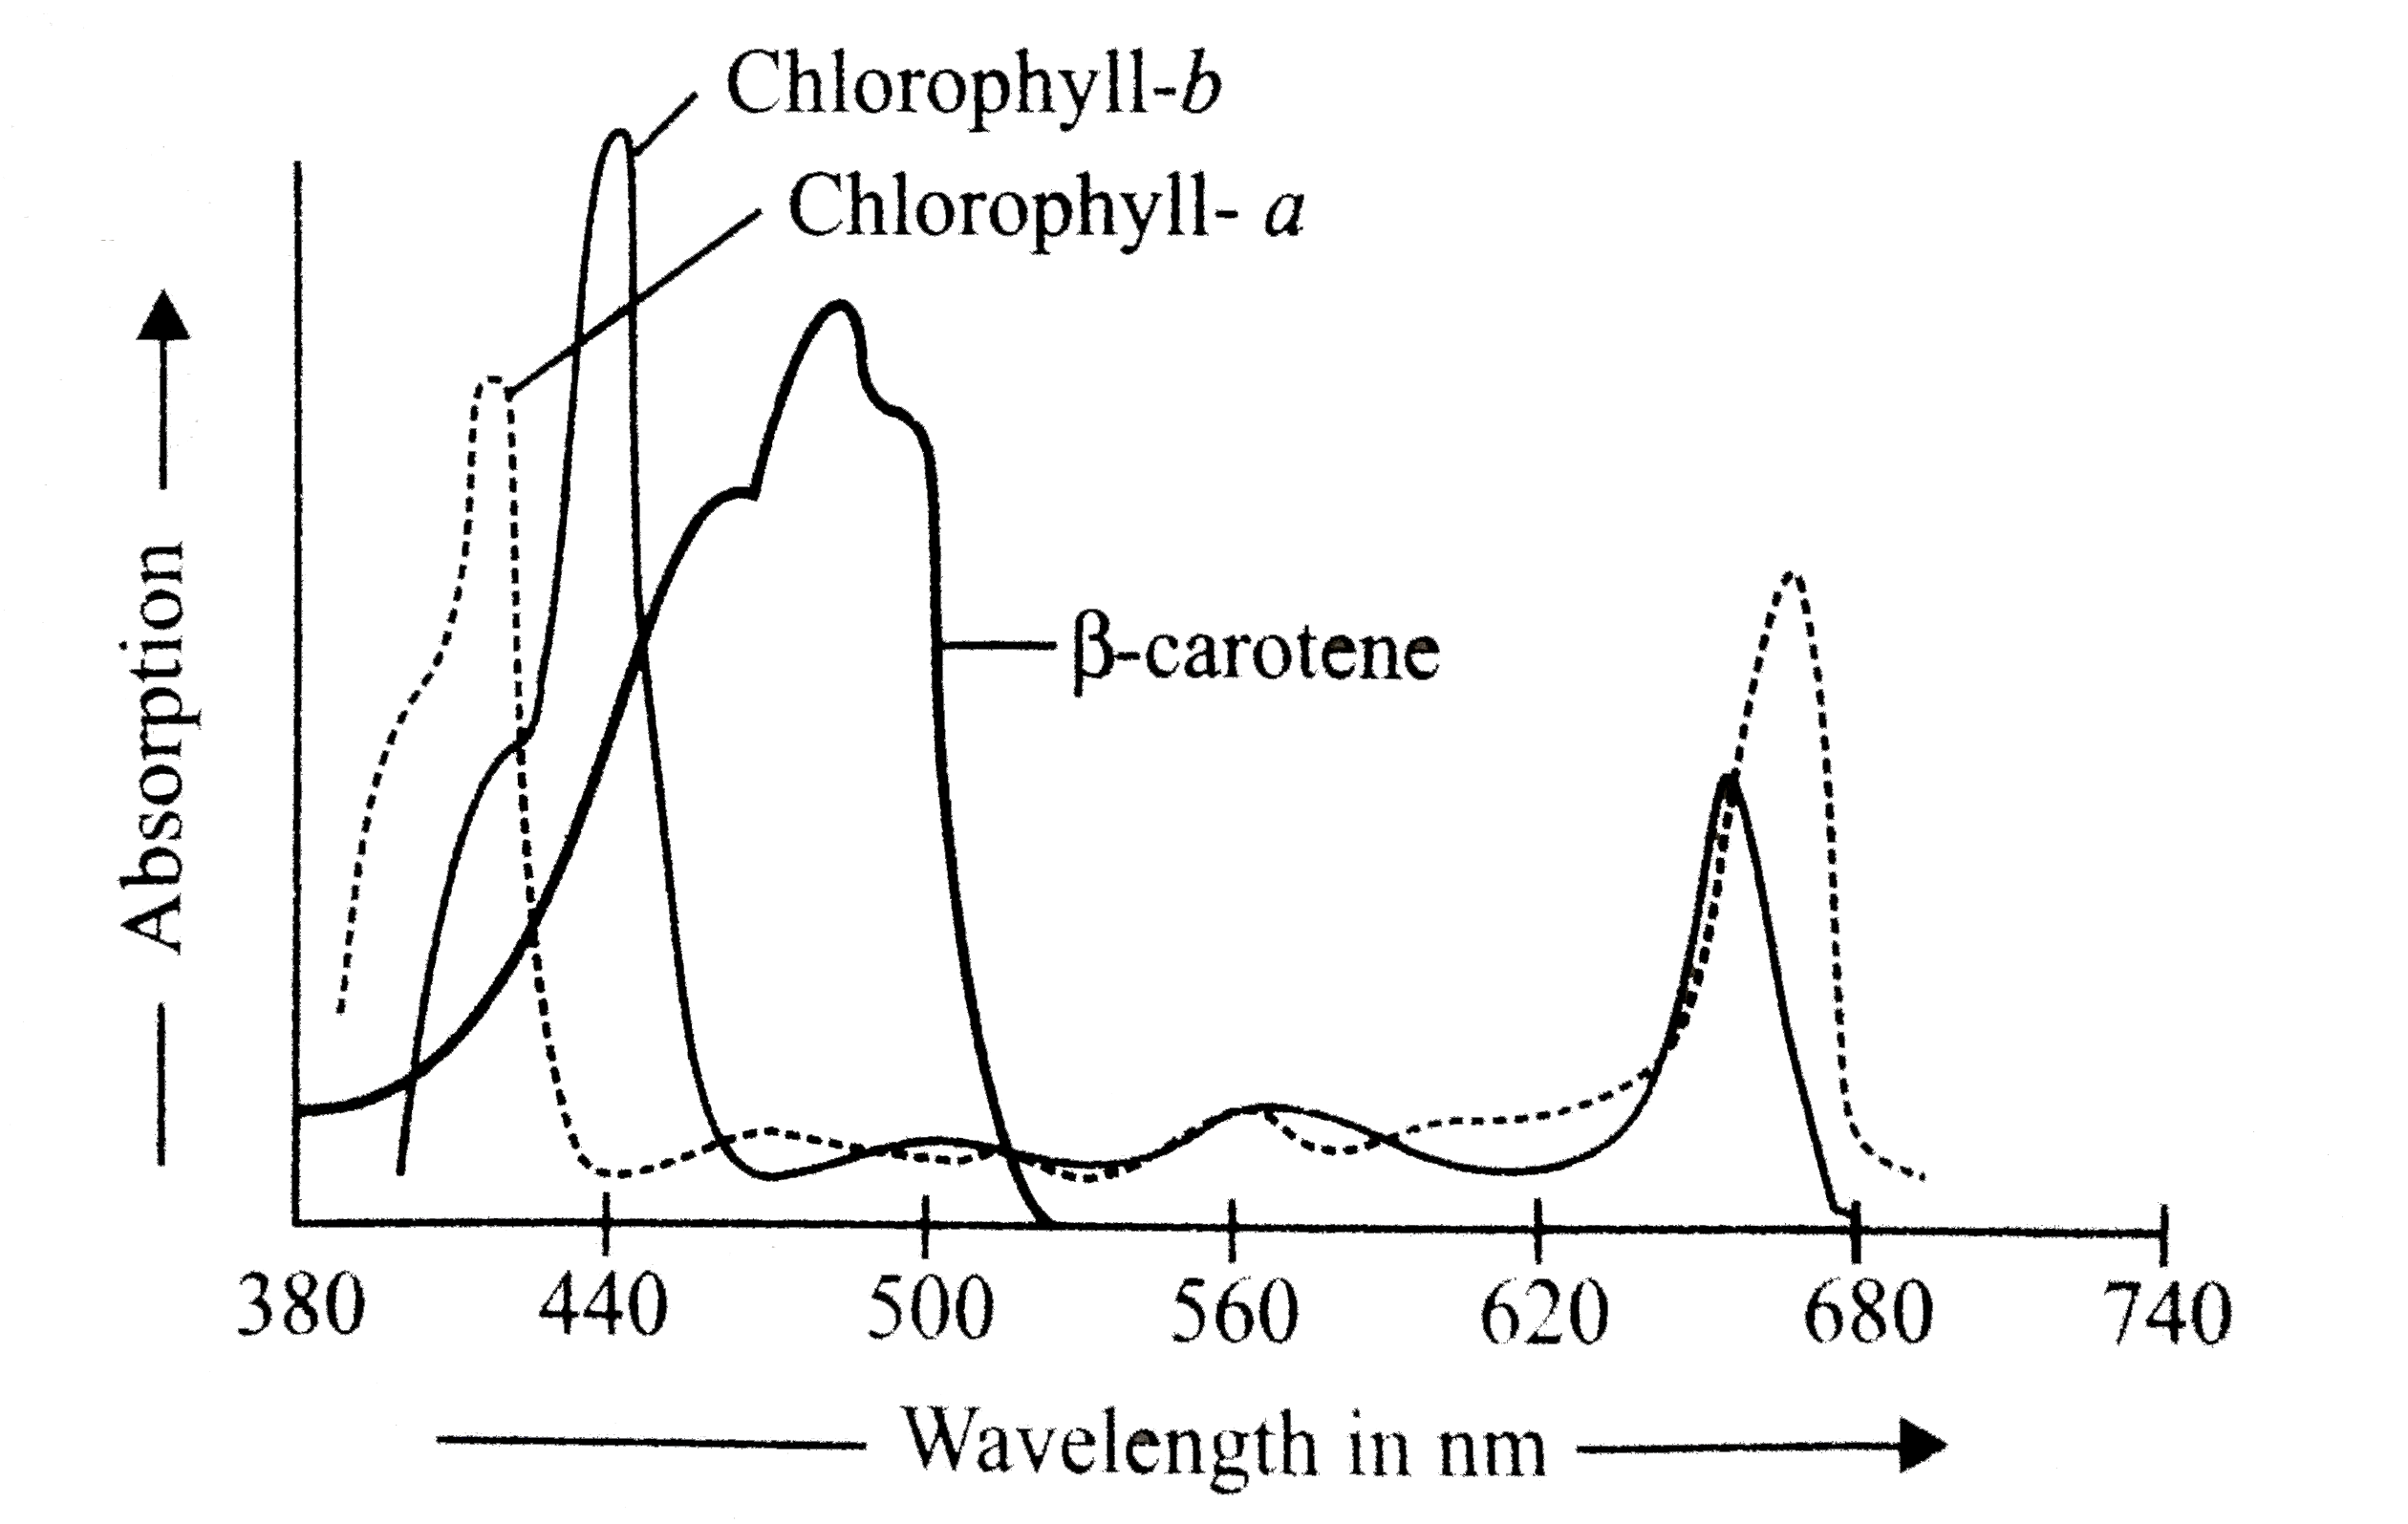
Given graph represents the absorption specra of three photosynthetic pigments chl a, chl b and β-carotene.

Select the correct statement regarding this.
A
The curve showing the amount of absorption of different wavelengths of light by a photosynthetic pigment is called as absorption spectrum
B
chl a and chl b absorb maximum light in blue and red wavelengths of light.
C
Rate of photosynthesis is maximum in blue and red wvelengths of light.
D
All of these
Video Solution
Text Solution
The correct Answer is:D
The graphical curve showing the amount of energy of different wavelengths of light absorbed by a pgment is called absorption spectrum,. It is studies with the help of spectrophotometer. The absorption spectra of chorophylls a and b show that they absorb maximum light in the blue-violet and red wavelengths. The pgments are often known after the wvelength which is absorbed to the maximum e.g., chl a673 Chl a683(P680), Chl a703(P700).
|
Updated on:21/07/2023
Topper's Solved these Questions
Similar Questions
Knowledge Check
- Question 1 - Select One
Select the correct statement regarding B2H6.
AIt has only 2c−2e− bondBIt is planarCIt does not react with NH3DHybridisation of boron is sp3 - Question 2 - Select One
Select correct statement(s) regarding given complexes:
A[Fe(CO)5] the orbitals used for hybridix=zation in Fe atom are s, Px,Py,Pz,dz2B[Pt(NH3)2Cl] the orbital used for hydrization on pt atom are s,Px,Py,dx2−y2 and it is low spin complexC[Cr(H2O)6]3+ the orbitals used for hybridiztion in cr atom are s PxPy,Pz,Dz2,Dx2−y2 and it si high spain complexDNi(CO4the orbitals used for hybrization in Ni atom s PX,Py,Pz and it low spin complex - Question 3 - Select One
Study the given graphs and select the correct statement regarding them.
 AGraph (A) represents physisorption isobar.BGraph (B) represents chemisorption isobar.CGraph (C) represents an adsorption isostere.DAll of these
Select correct statement(s) regarding given complexes:
View SolutionSelect correct statement(s) regarding given complexes:
View Solution
Select the correct statement(s) about given graph .View SolutionA P-T graph is shown for a cyclic process. Select correct statement regarding this
 View Solution
Study the age pyramids given below and select the correct statements regarding these.
 View Solution


