Given figures illustrate.
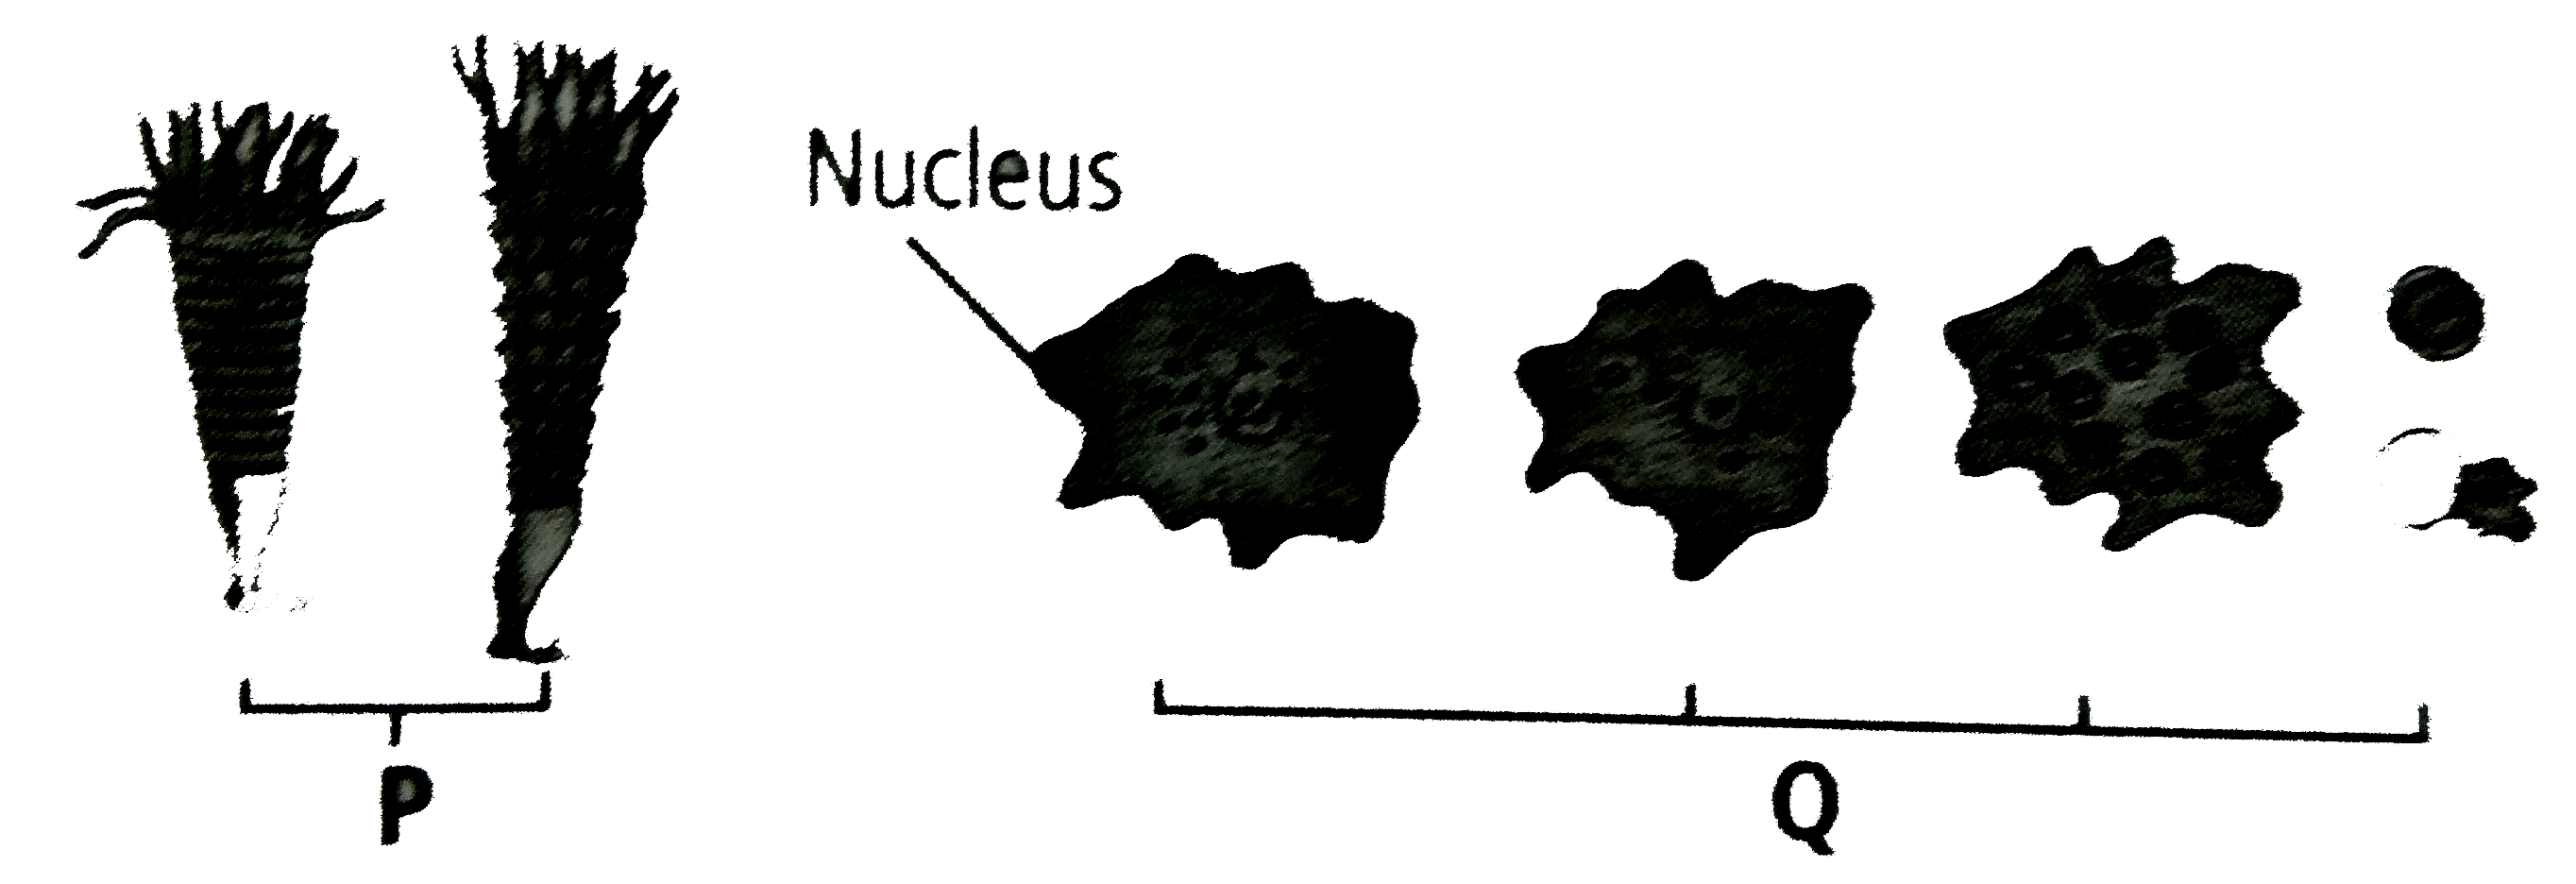
P QMetamerism by a cnidarianMultiple fission by a protist
P QStrobilation by a cnidarianMultiple fission by a protist
P QFragmentation by a platyhelminthInternal budding by a sponge
P QStrobilation by a platyelminthSporulation by a protis
The correct Answer is:b
Figure 'P' shows strobilation in Aurelia (a coelenterate/cnidarisn). Strobilation refers to repeated formation of similar segements by the process of budding figure 'Q' shows multiple fission in Amoeba (a protozoan protist), during which many daughter nuclei are produced by the repeated divisions of the parent nucleus.
Topper's Solved these Questions
Similar Questions
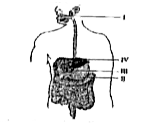
The given figure illustrates the human digestive system. Buccal cavity is marked as I, stomach as II, gall bladder as III, and liver as IV. Which part of human digestive system produces bile?
 View Solution
The given figure illustrates the changes in lung volume during the process of breathing.
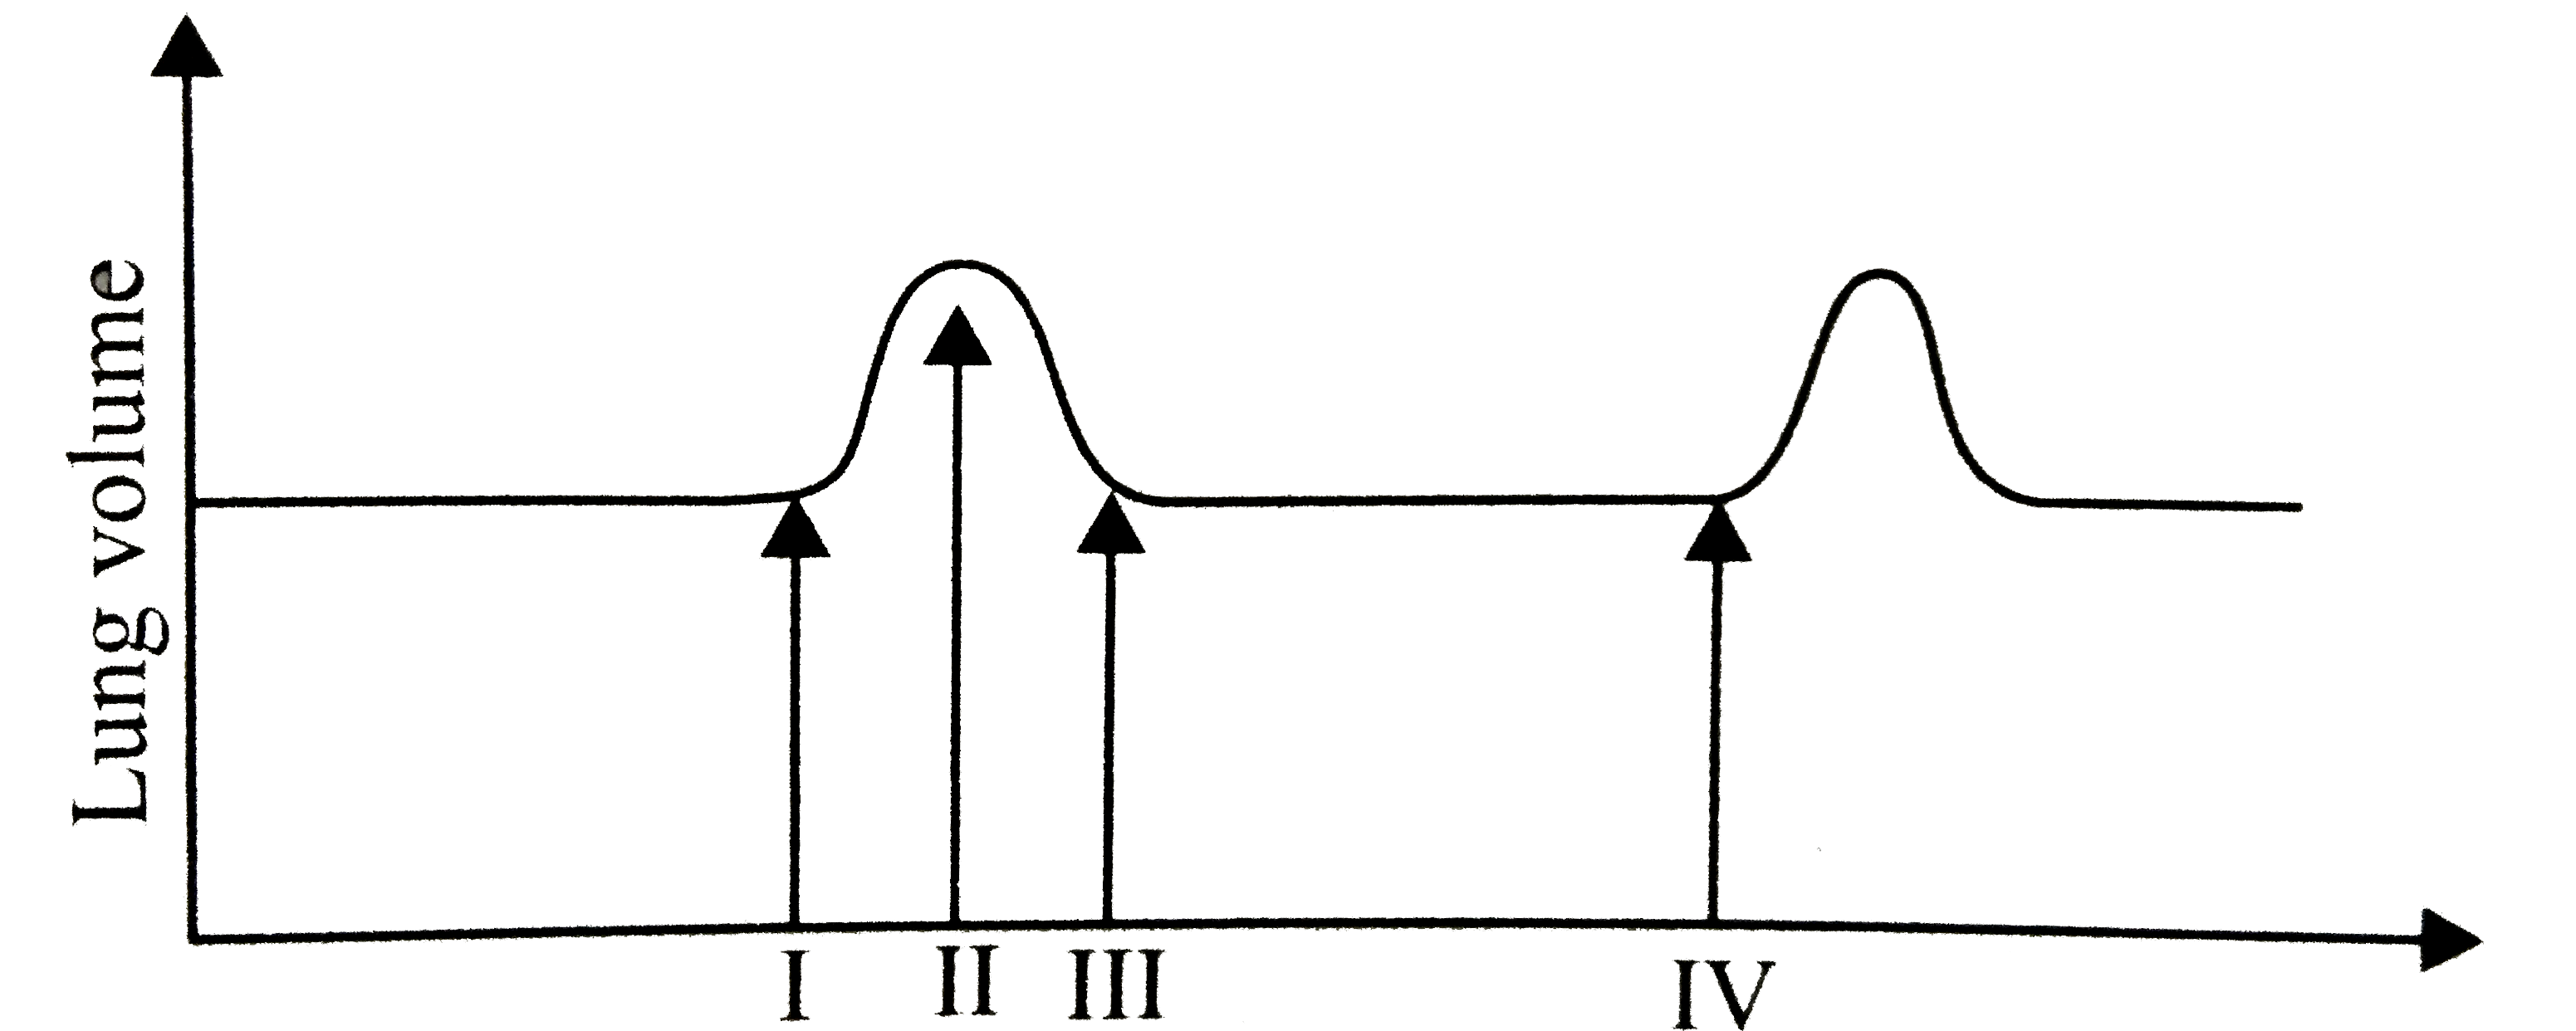
The changes from II to III indicates theView Solution
Knowledge Check
- Question 1 - Select One
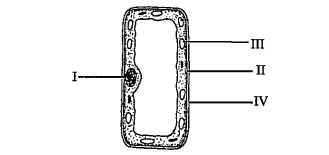
The given figure illustrates a plant cell an animal cell does not contain
 AI onlyBII onlyCI and II onlyDIII and IV only
 - Question 2 - Select One
The given figure illustrates a section through the human heart.
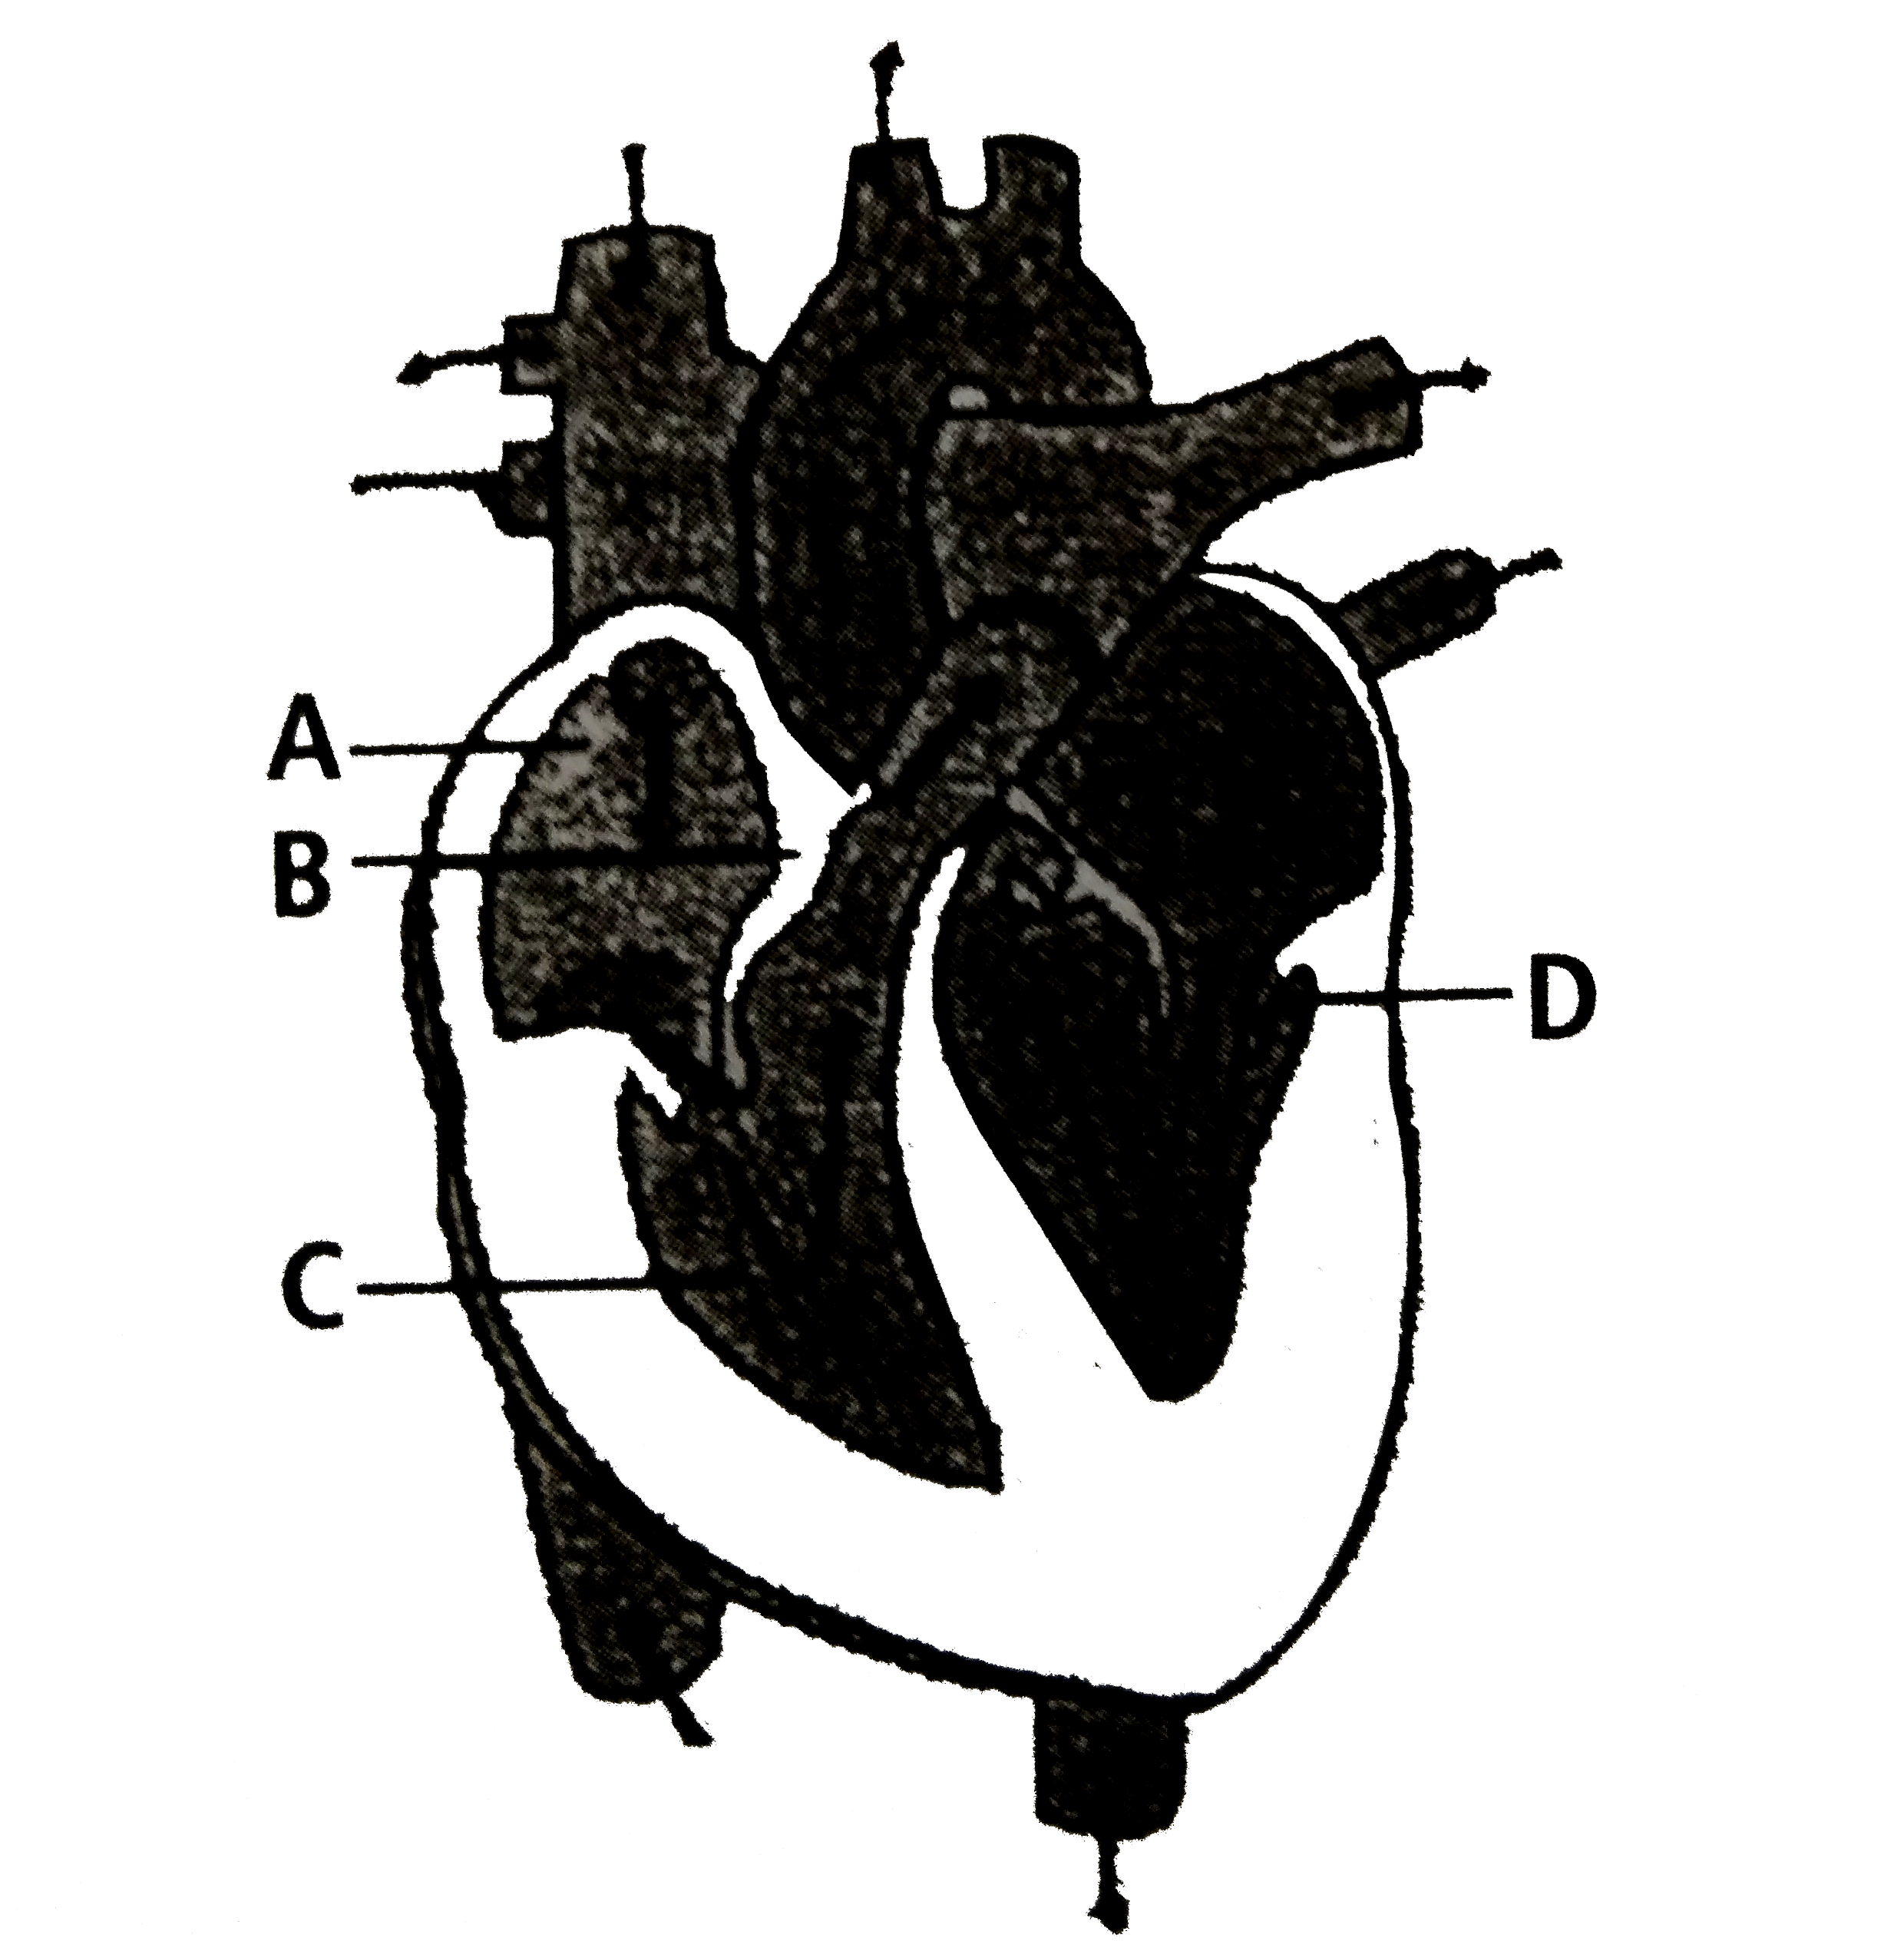
Which labelled part represents the site for the generation of action potential in human heart ?AABBCCDD - Question 3 - Select One
The given figure illustrates the changes in lung volume during the process of breathing. The change from II to III indicates the :-
AExpansion of ribsBMovement of air out of the thoracic cageCMovement of diaphragm away from the lungsDMovement of air out of the lungs
The given figure illustrates the structural components of a molecule.
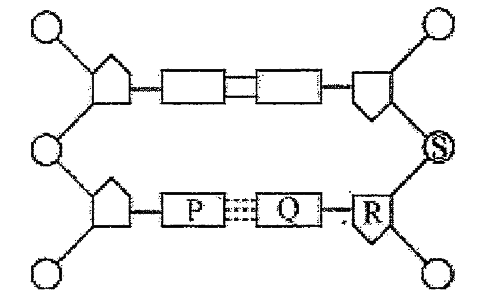
The names of the labels are identified in which alternative?View SolutionThe given figure illustrates montly changes in the human ovary during the reproduction cycle.
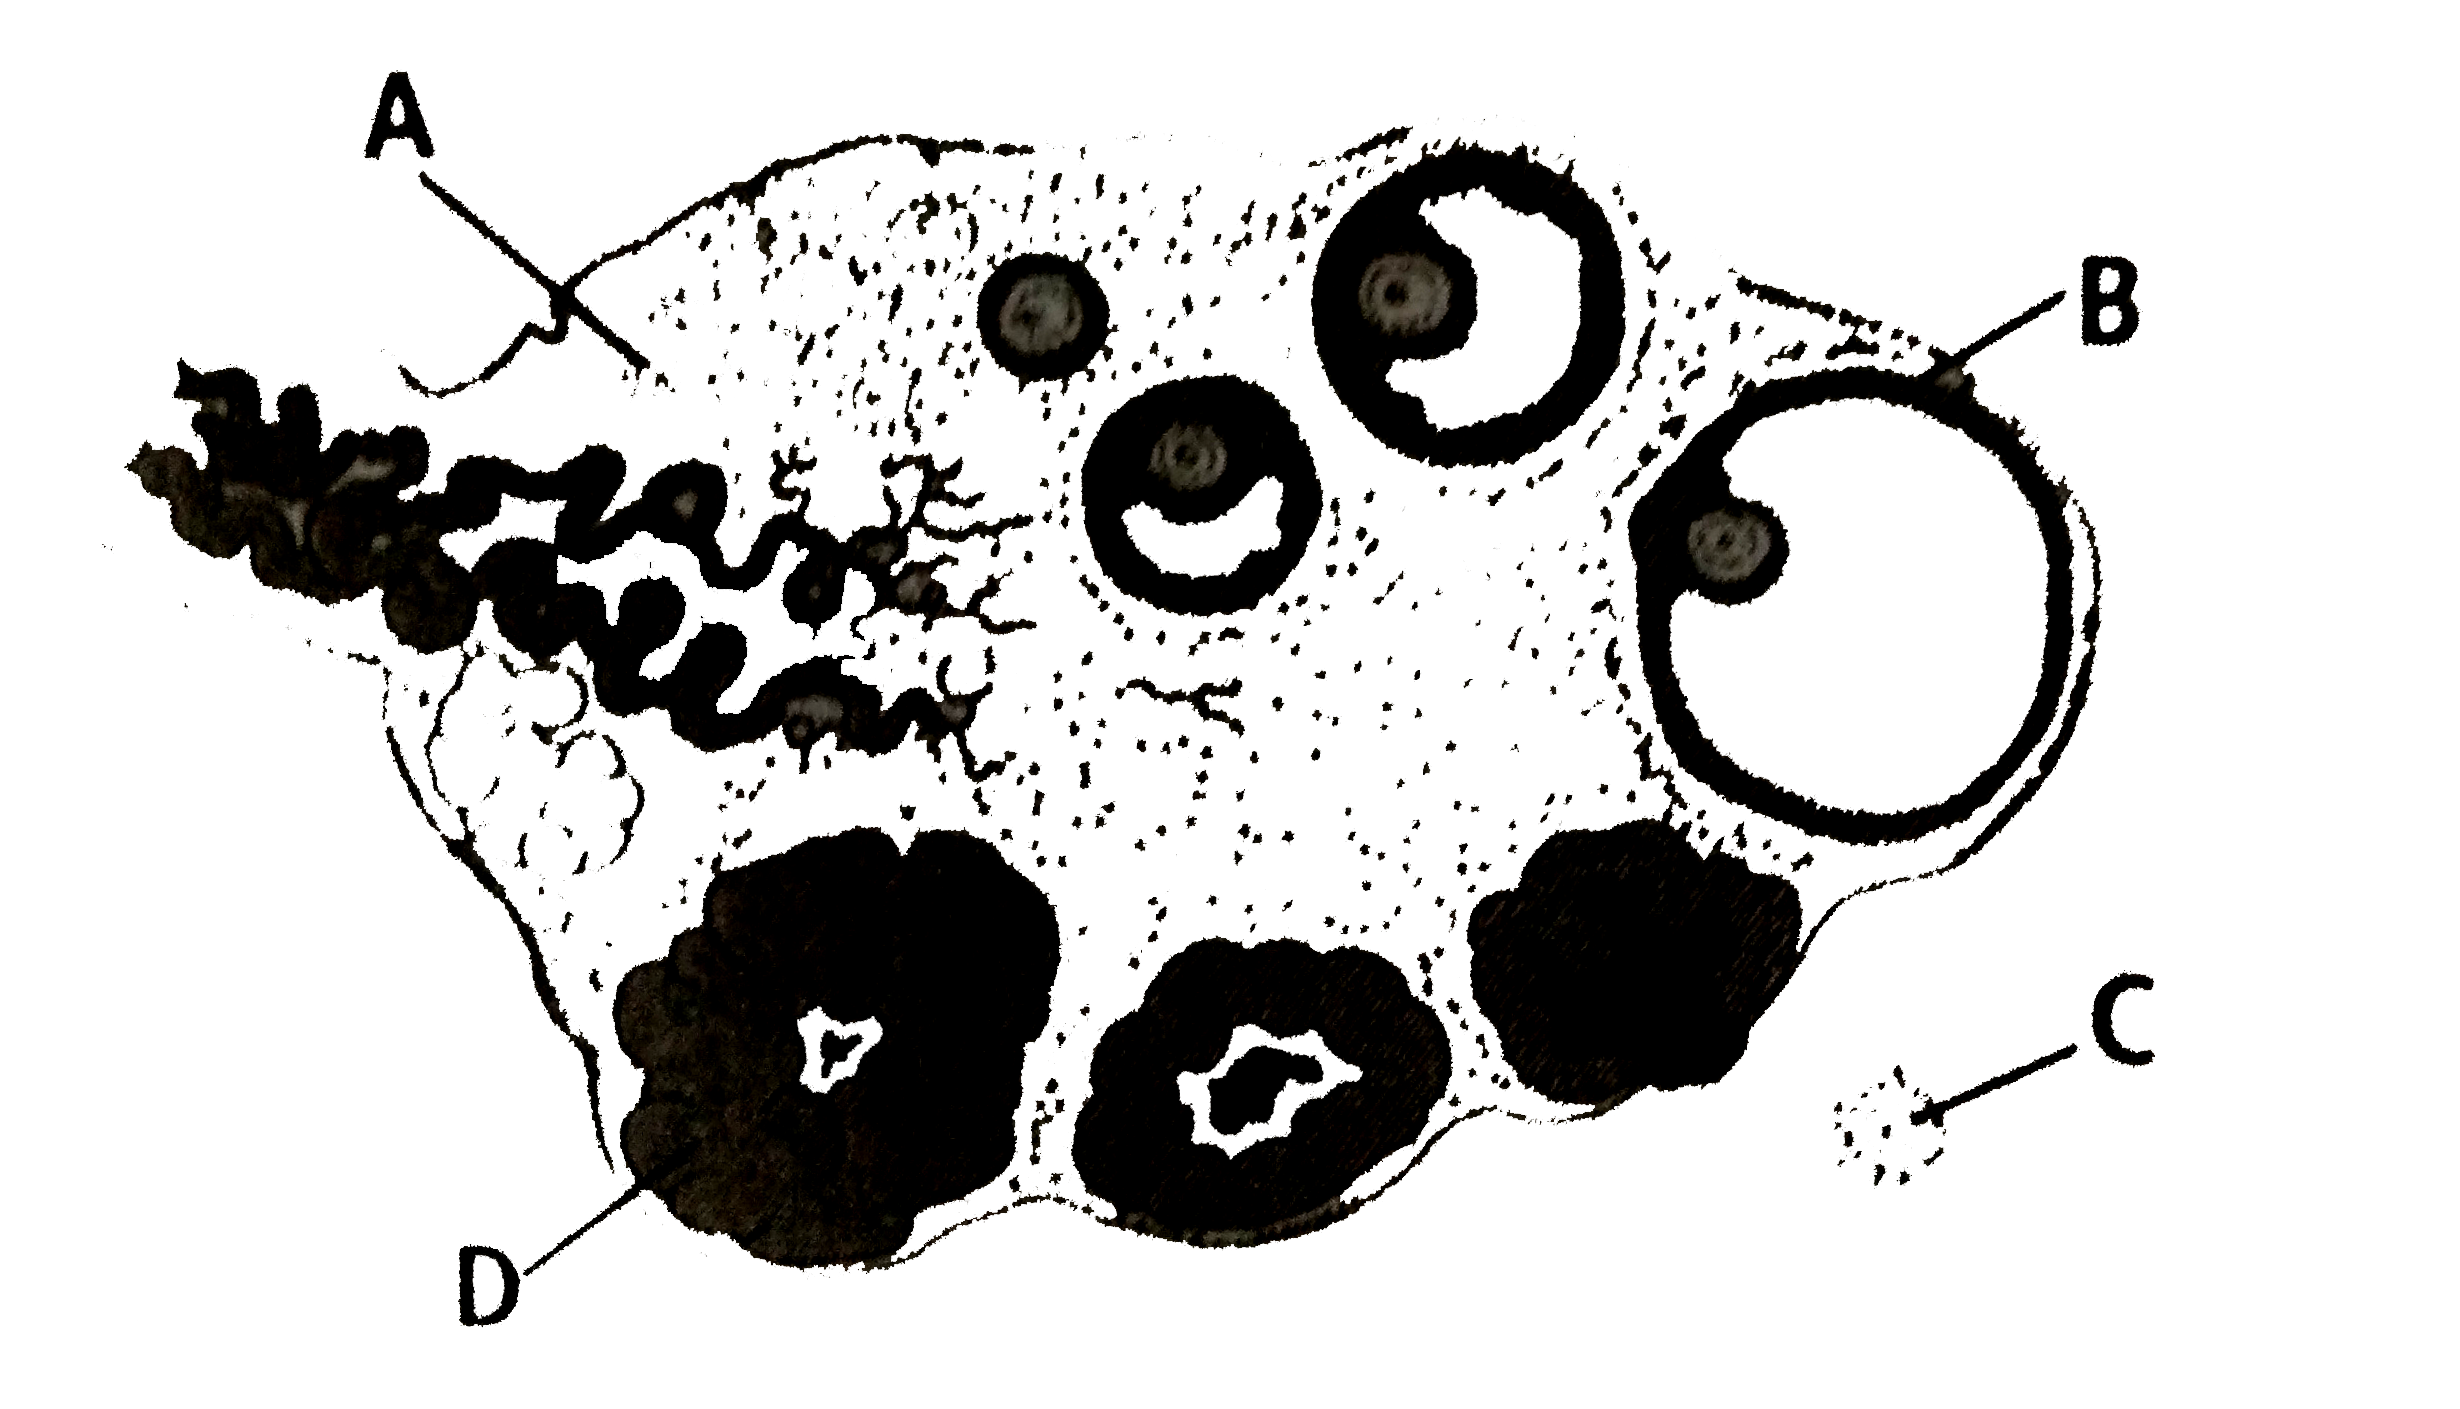
Which of the following statements most accurately describes each structure?View SolutionA farmer planted rice plants in his well-irrigated field season after season. The given figure illustrates the yield of rice in his field from 2003“ 2007.
Which of the following statements does not support the given observation?View SolutionThe given figure illustrate human female reproductive system in which region are sperms released during intercourse and where does the fusion of sperm and egg usually take place ?
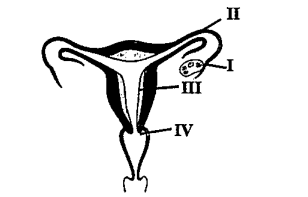 View Solution
Tammy added substrate I to a beaker containing equal amounts of enzymes E1 to E7. The given figure illustrates the metabolic pathway of the reaction. After 20 minutes, Tammy added a competitive inhibitor in the reaction mixture for enzyme E2.
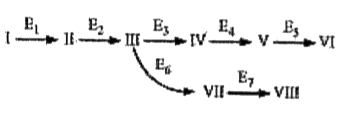
The addition of the competitive inhibitor increases the concentration of substanceView Solution

