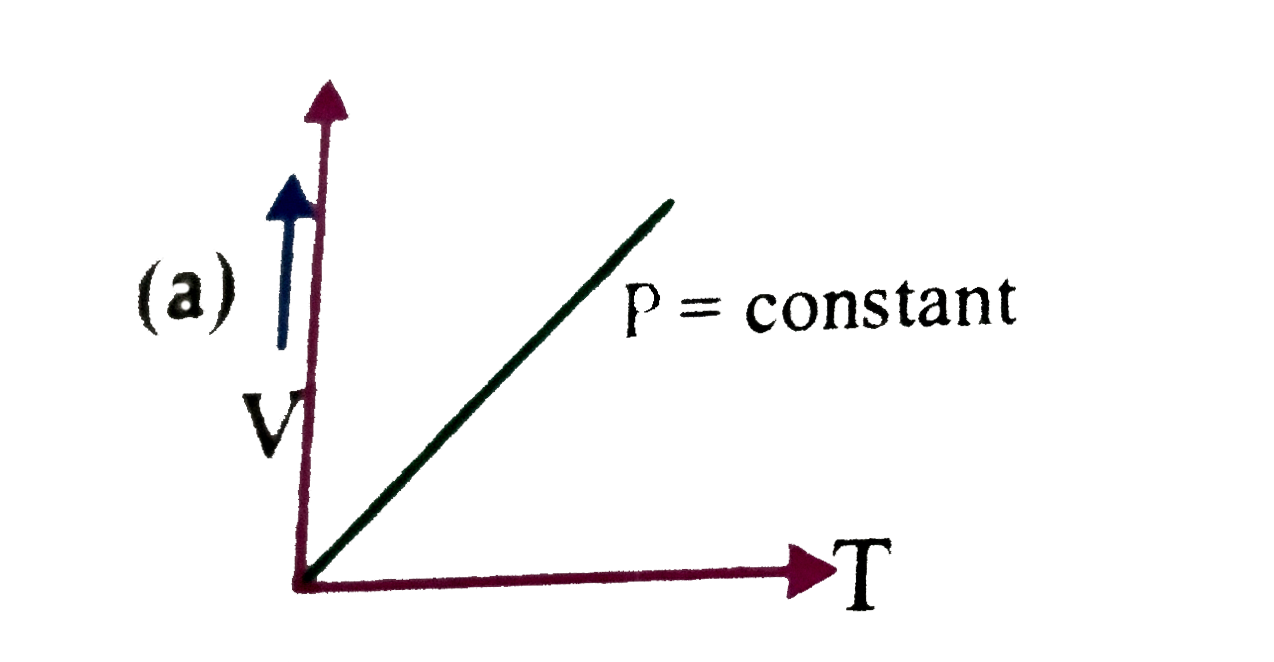
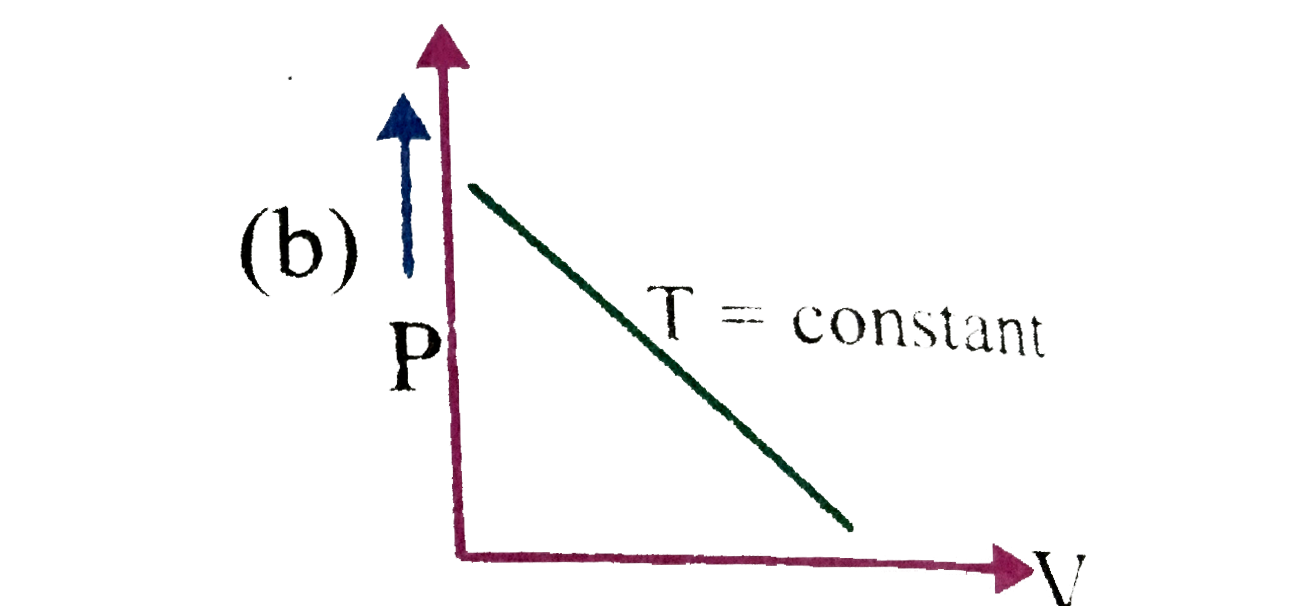
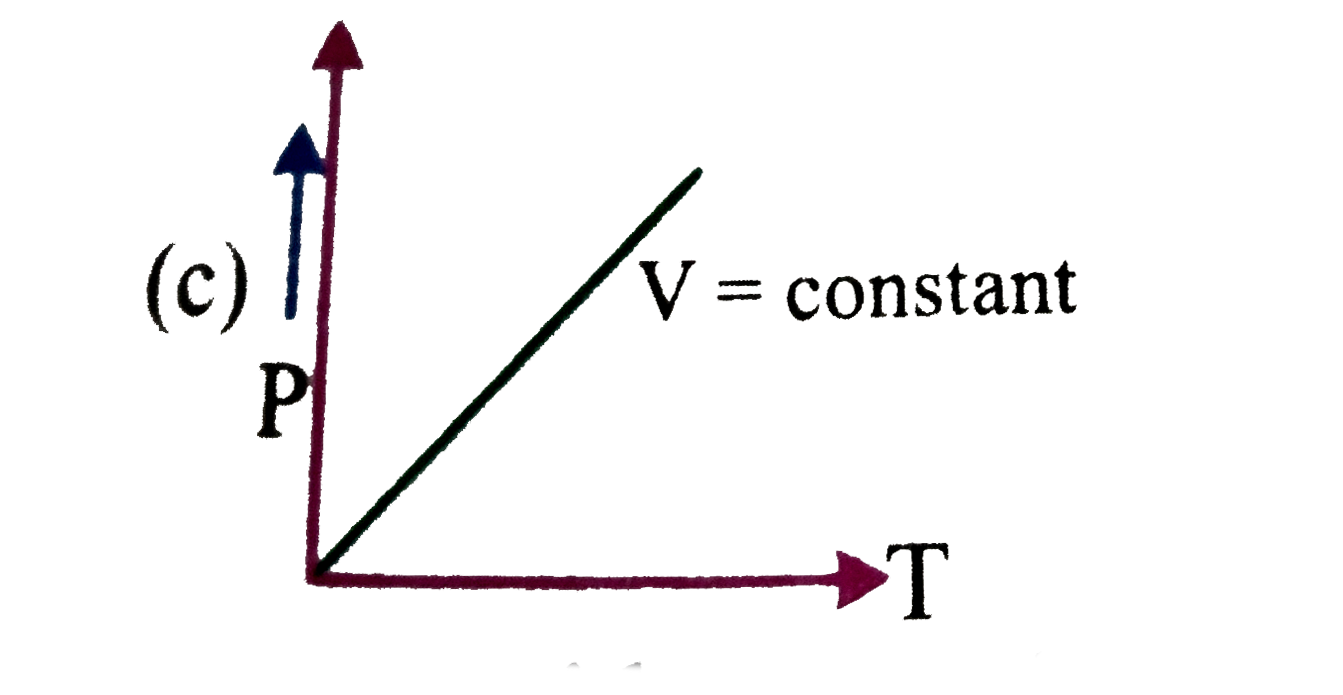
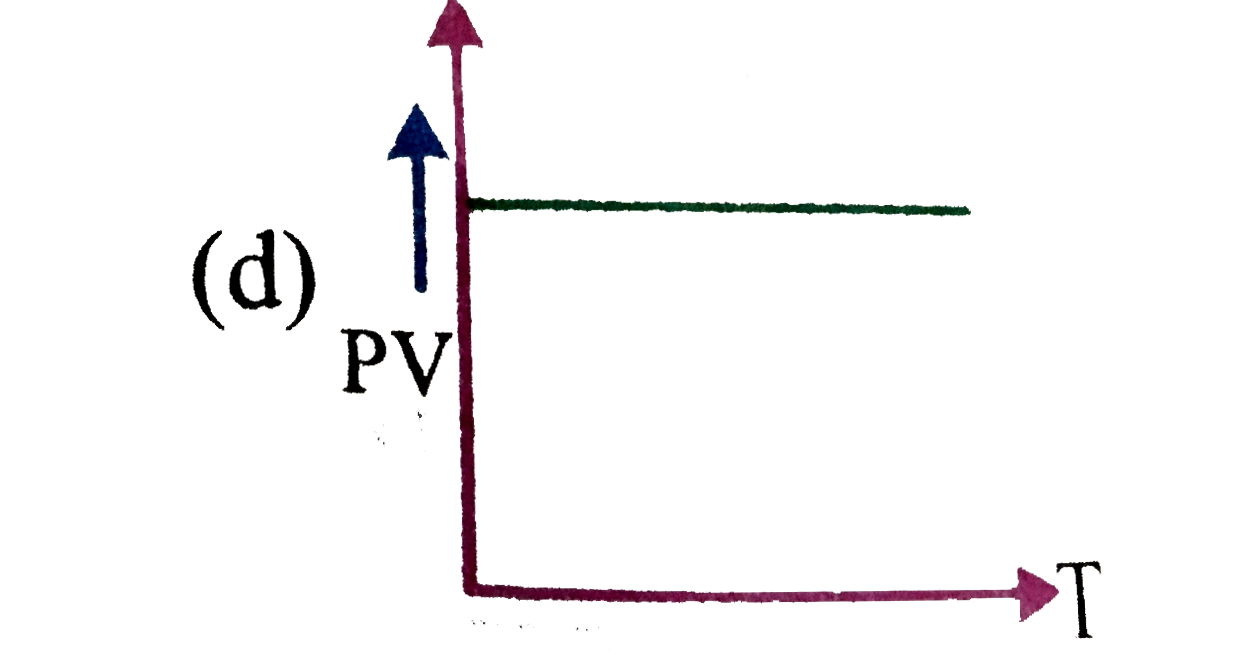
Which of the following diagrams, Fig. depicts ideal gas behaviour ?
A
B
C
D
Video Solution
Text Solution
The correct Answer is:A, C
Sol. (a,c) For ideal gass behaviour, PV=nRT (a) When pressure, P= constnat From (i) volume v α Temperature T graph of V versus T will be straight line.
(b) When T-Constant from From (i) PV= Cosntant So. graph of P versus V will be a rectangular hyperbola. Hence this graph is wrong. The correct graph is shown below:
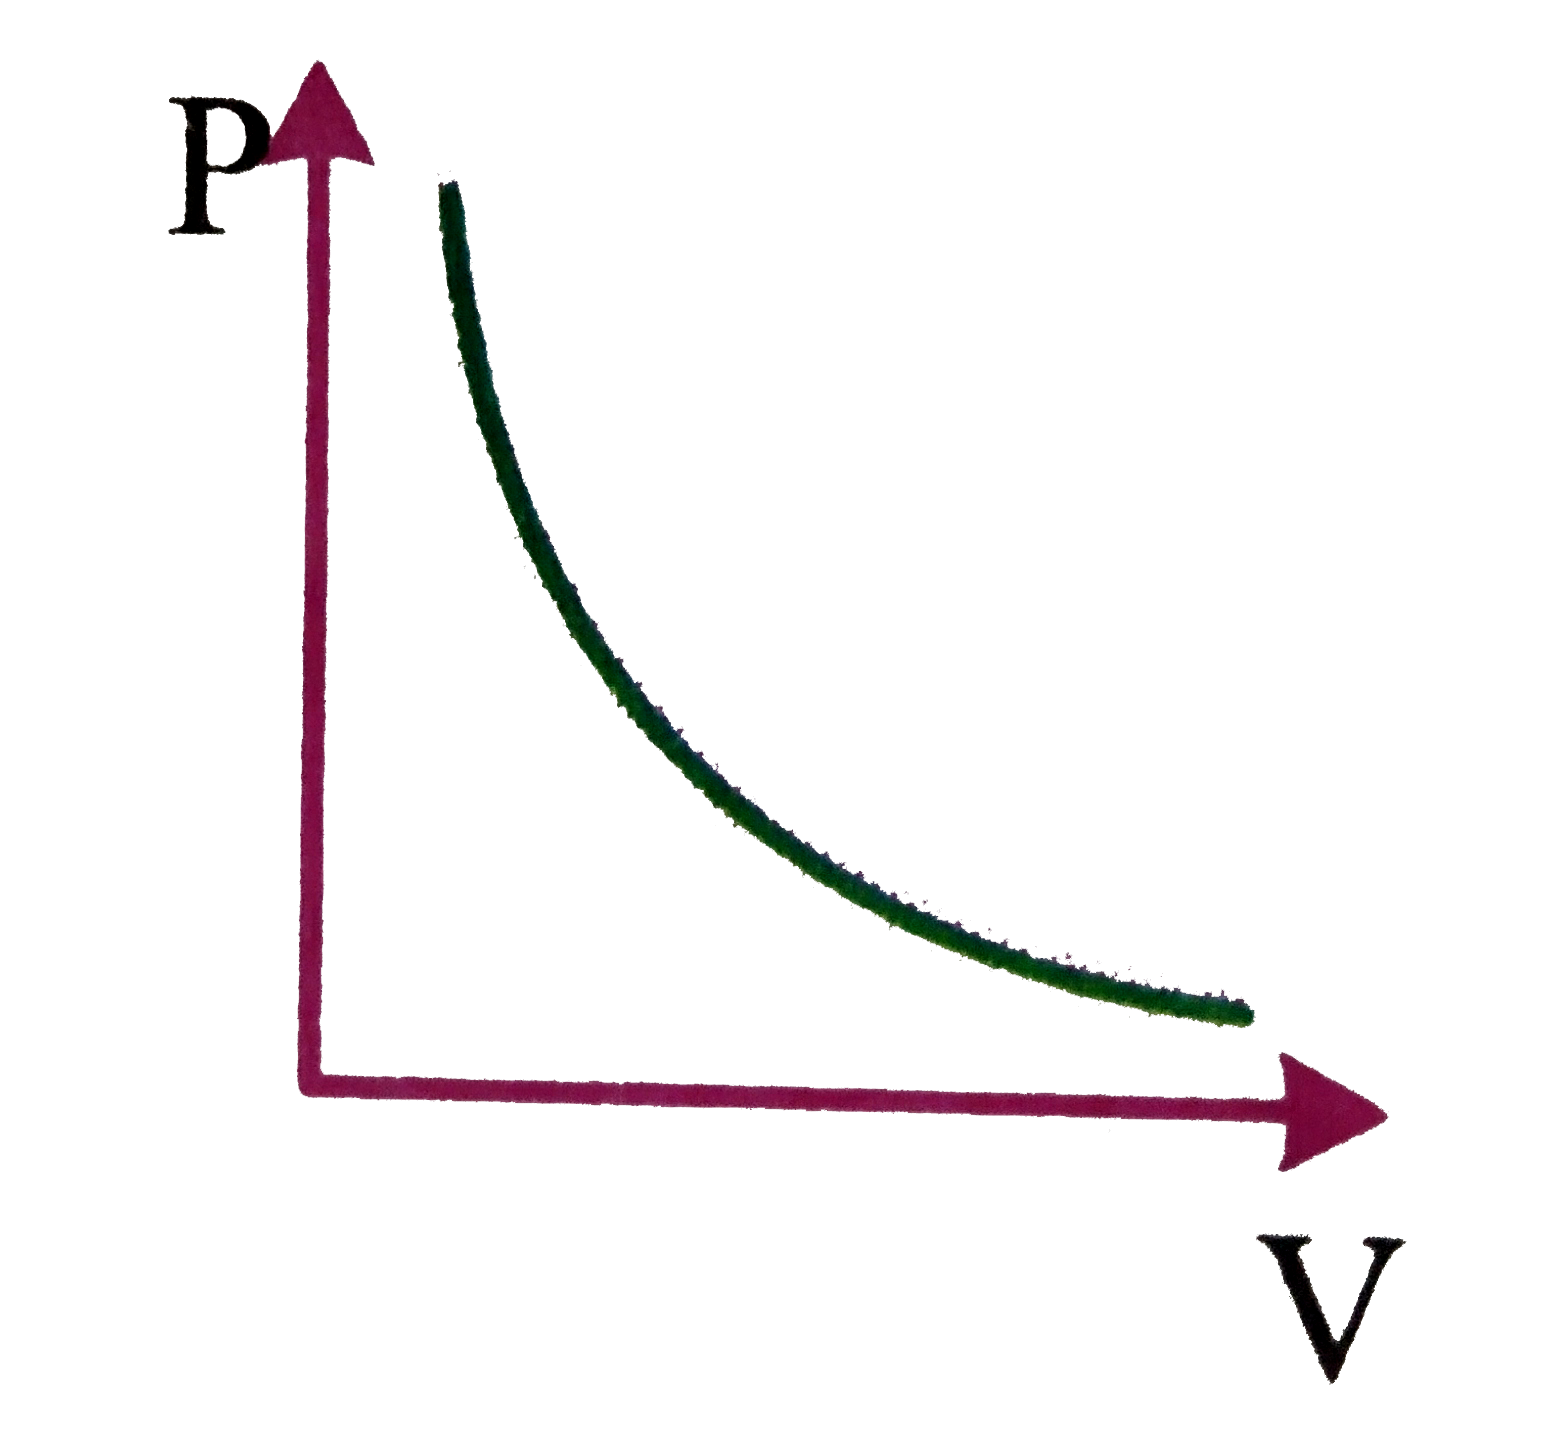
(c) When V=Constant From (i) P α T So, the graph is a stright line passing through the origin.
(d) From (i) PVαT⇒PVT= Constant So. graph of Pv versus T will be a stright line parallel to the temperature axis (x-axis).
i.e. slope of this graph will be zero.
So, (d) is not correct.
|
Updated on:21/07/2023
Topper's Solved these Questions
- BOOK - NARAYNACHAPTER - KINETIC THEORY OF GASESEXERCISE - LEVEL-V10videos
KINETIC THEORY OF GASES
- BOOK - NARAYNACHAPTER - KINETIC THEORY OF GASESEXERCISE - LEVEL-VI10videos
KINETIC THEORY OF GASES
- BOOK - NARAYNACHAPTER - KINETIC THEORY OF GASESEXERCISE - LEVEL-3(C.W)13videos
KINETIC THEORY OF GASES
- BOOK - NARAYNACHAPTER - GRAVITATIONEXERCISE - EXERCISE -IV40videos
GRAVITATION
- BOOK - NARAYNACHAPTER - LAW OF MOTIONEXERCISE - EXERCISE - IV35videos
LAW OF MOTION
Similar Questions
Knowledge Check
- Question 1 - Select One
Which of the following diagrams (figure) depicts ideal gas behaviour?
A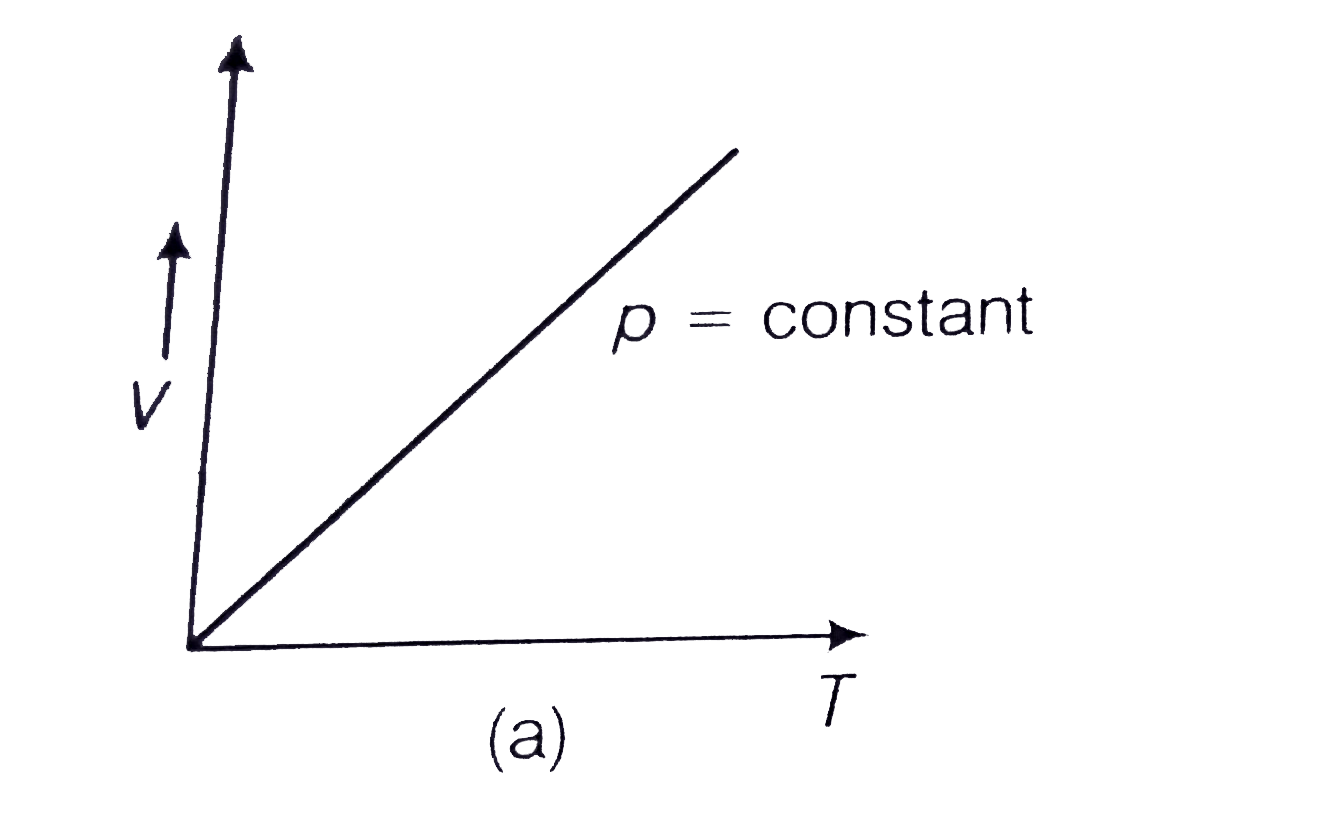 B
B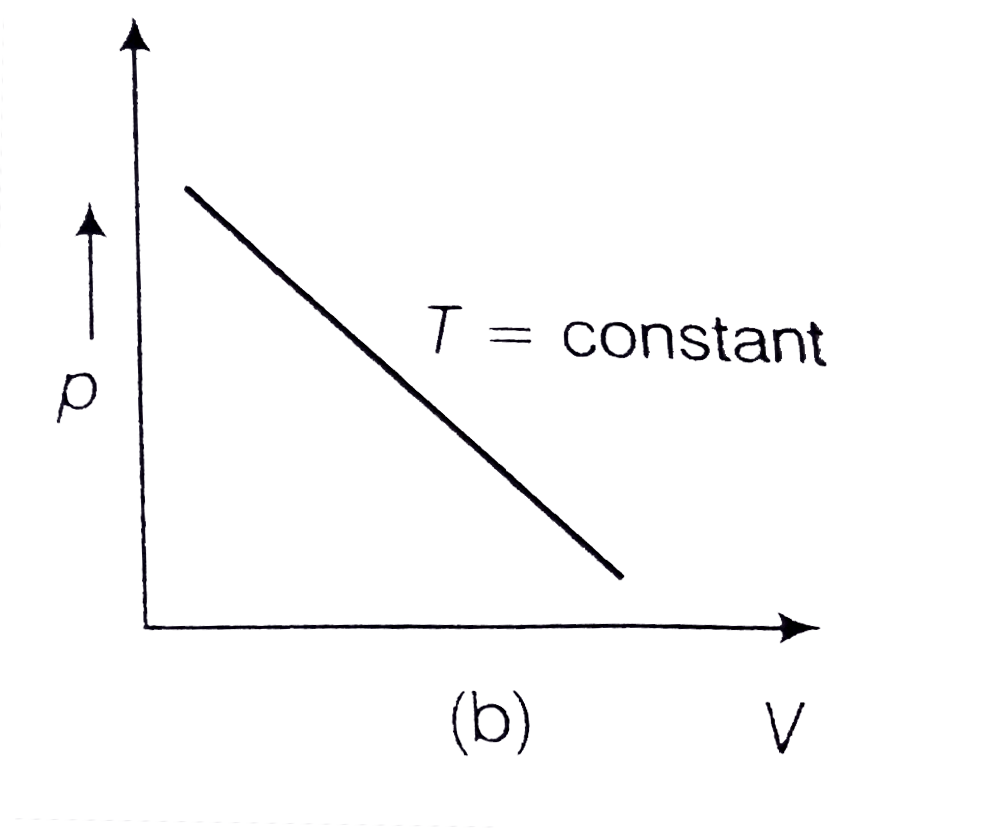 C
C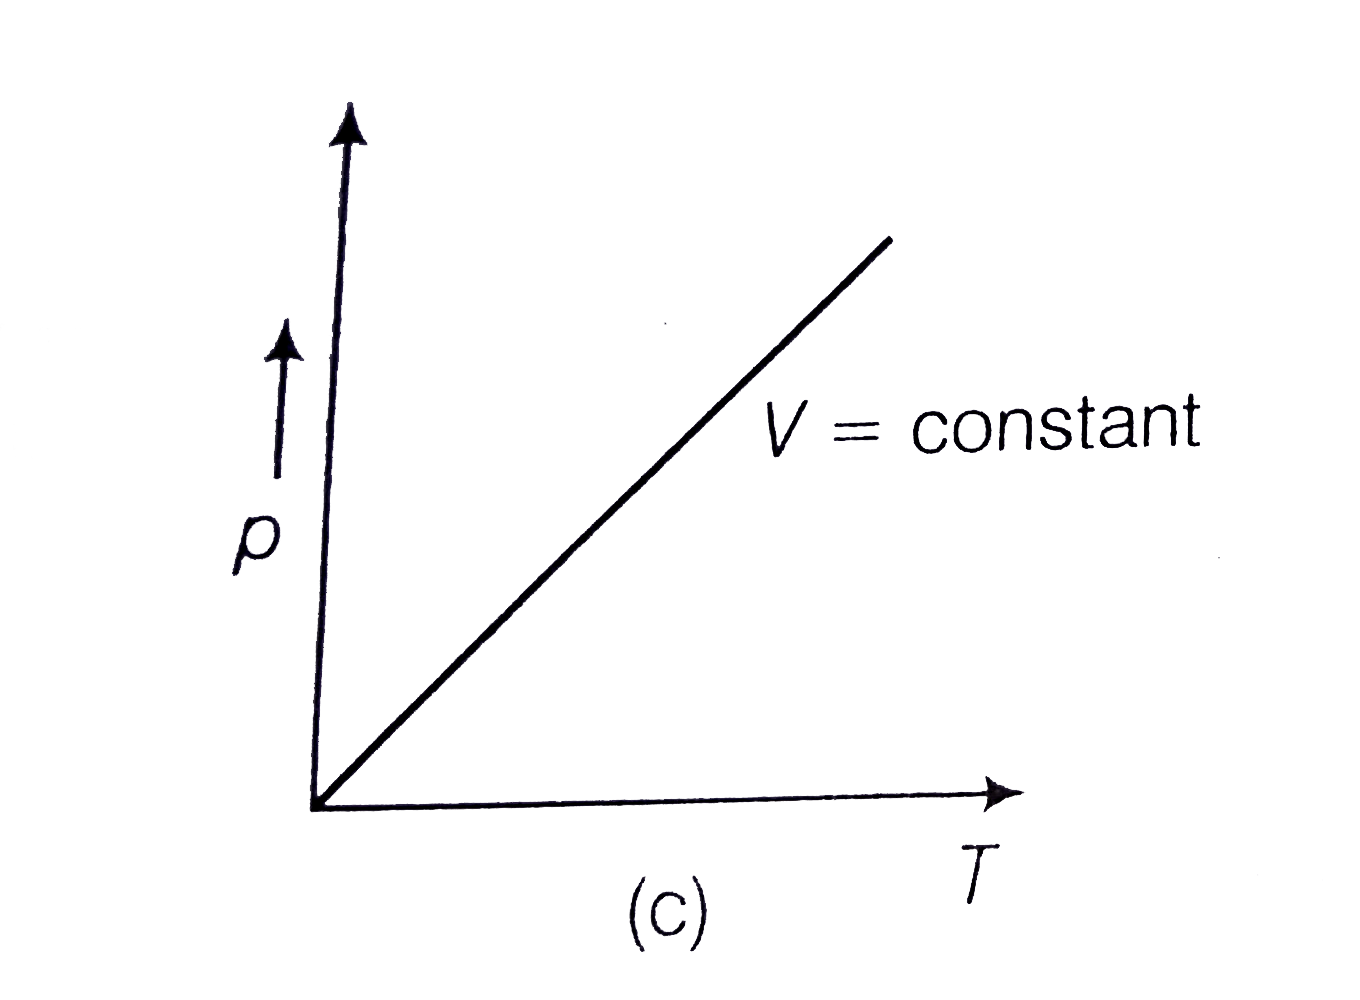 D
D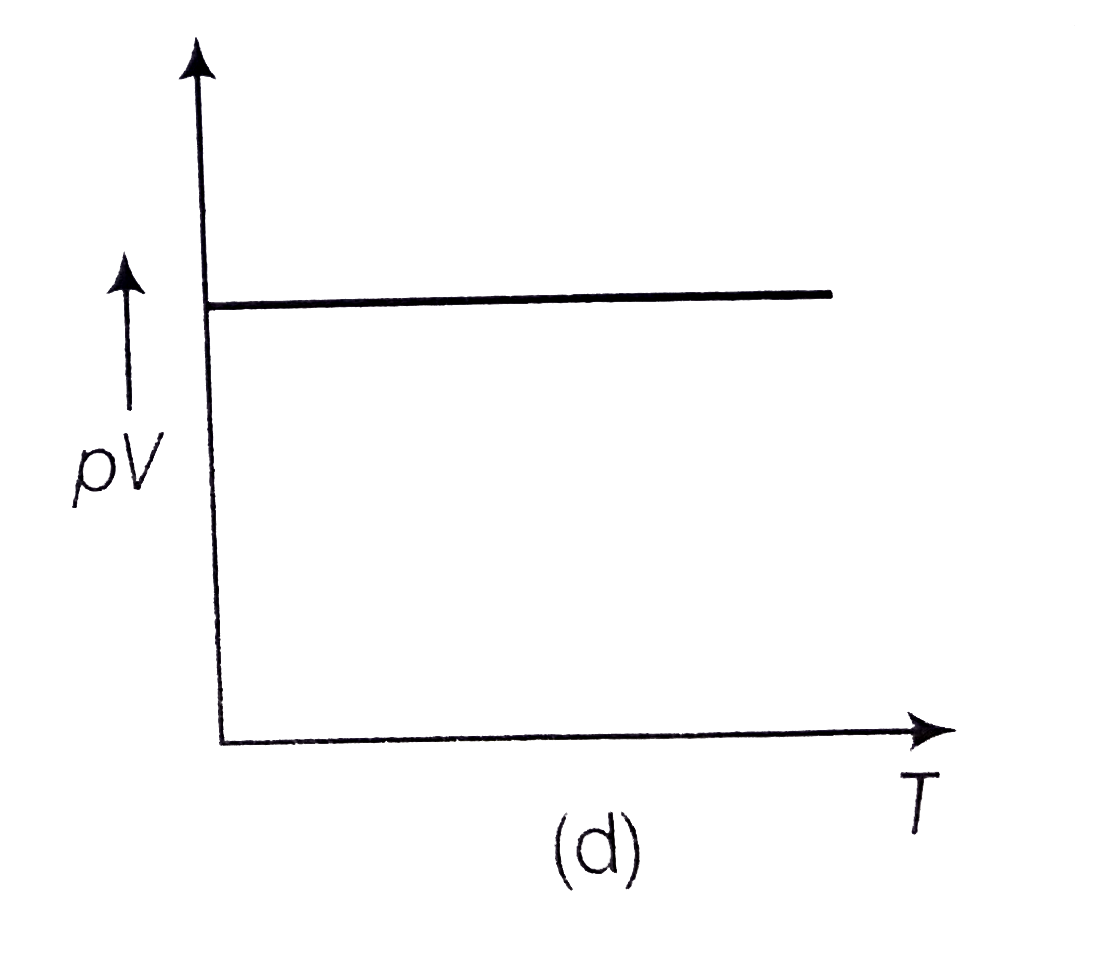
- Question 2 - Select One
Which of the following graphs is consistent with ideal gas behaviour?
A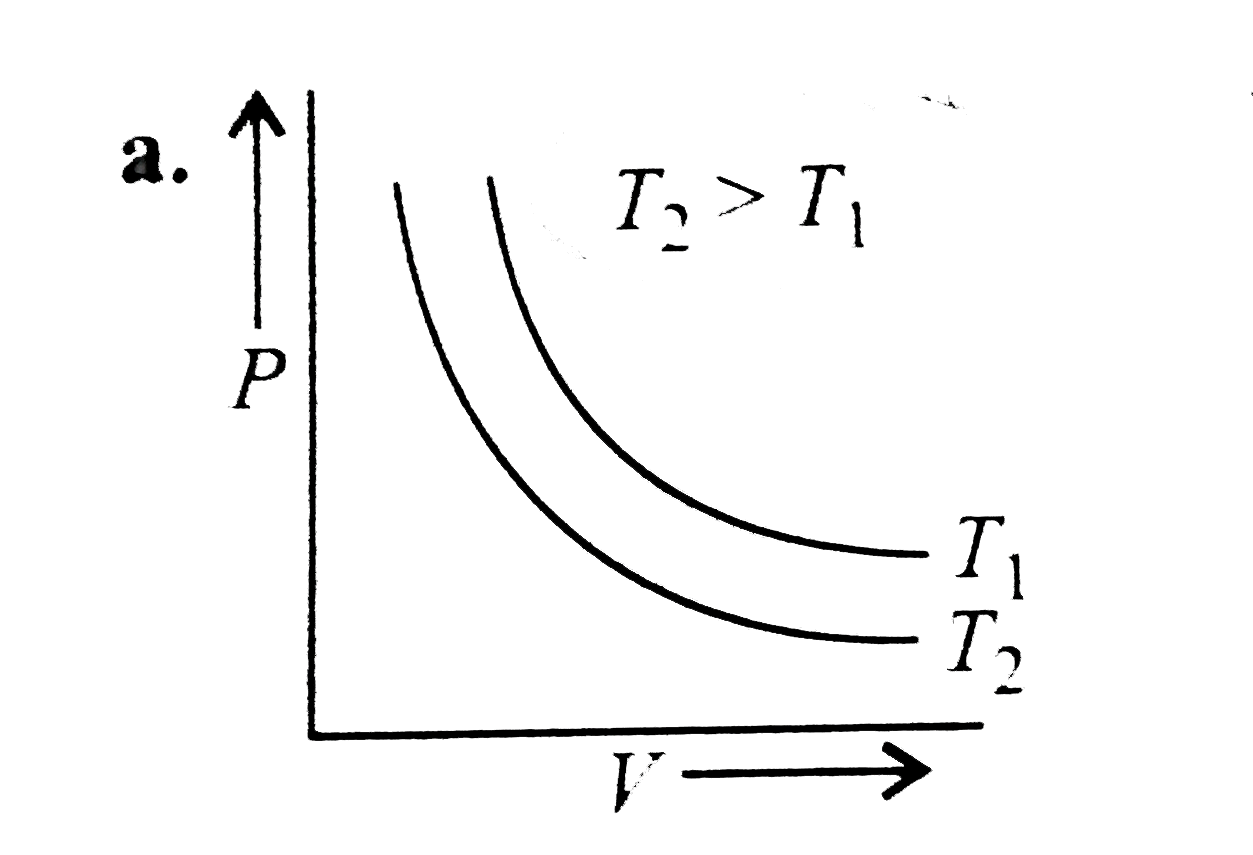 B
B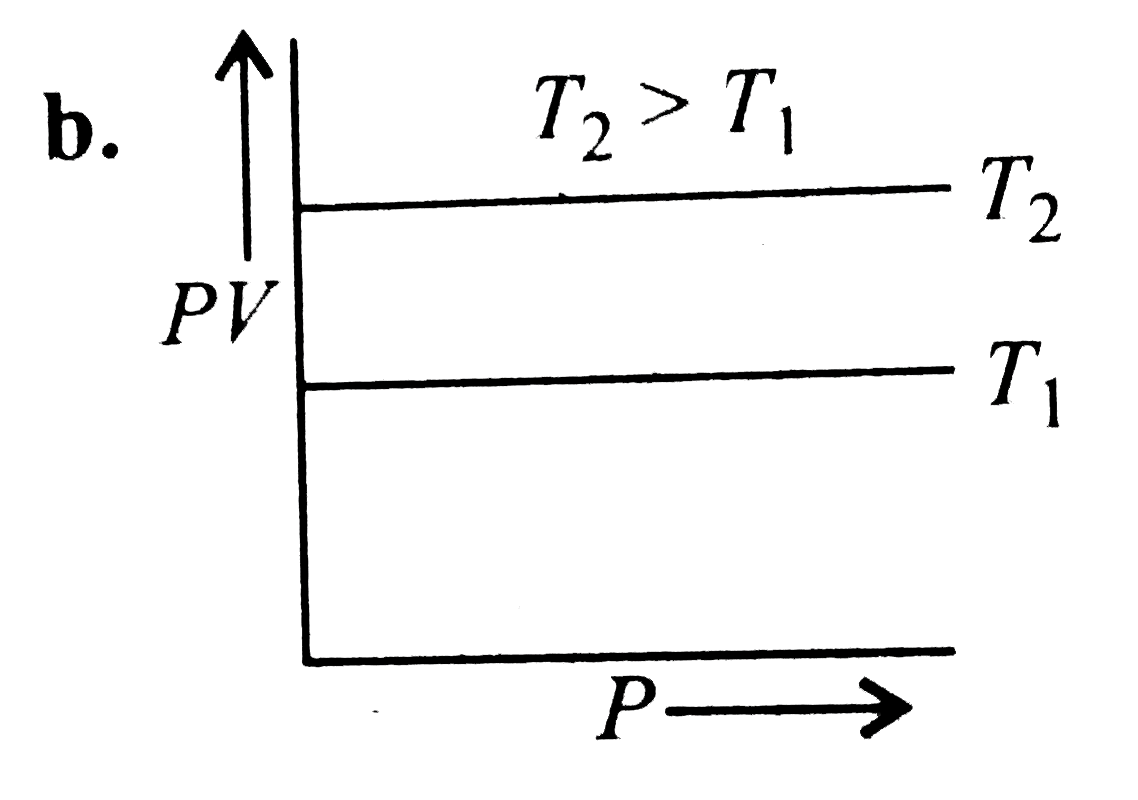 C
C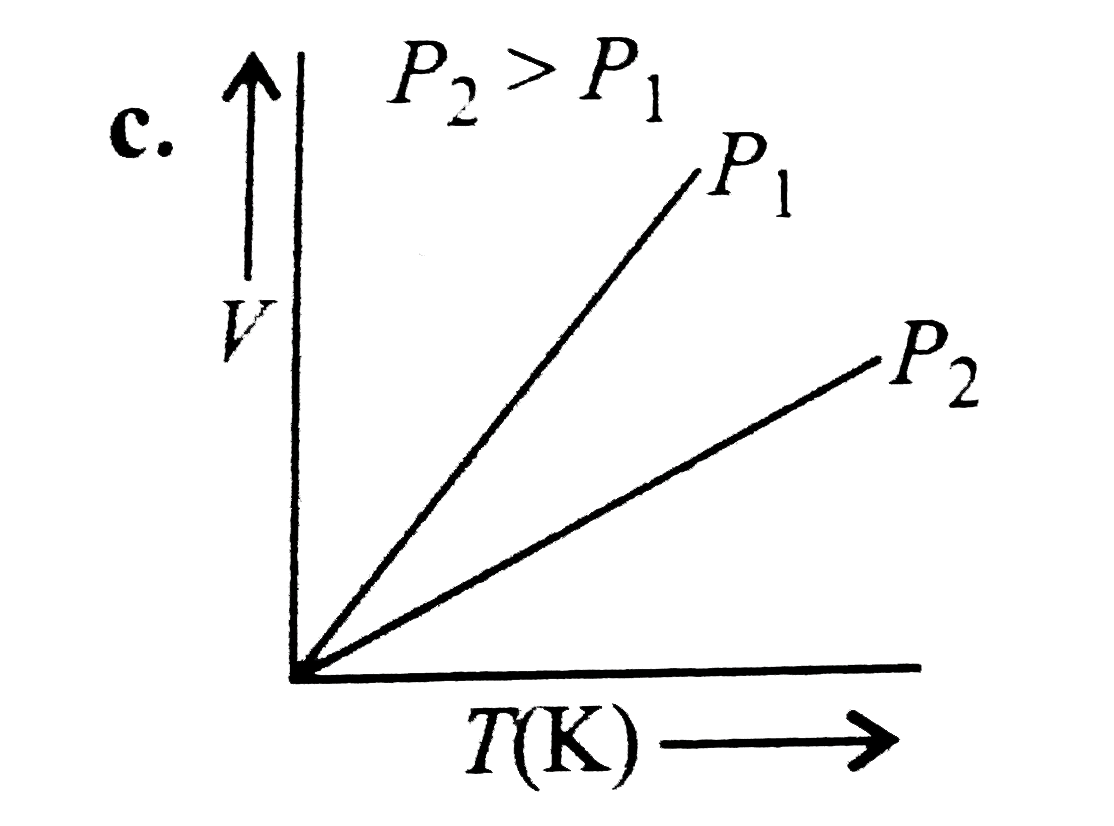 D
D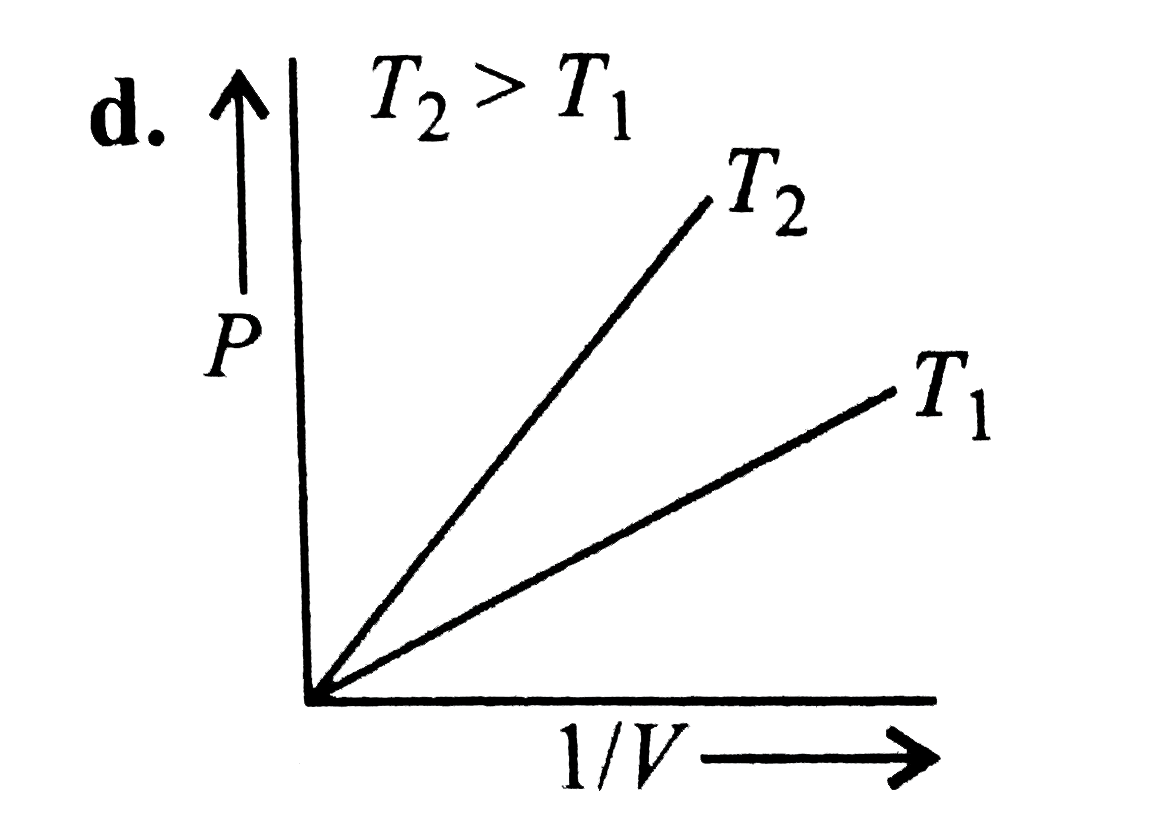
- Question 3 - Select One
Which of the following graphs is inconsistent with ideal gas behaviour ? (Assume n = constant)
A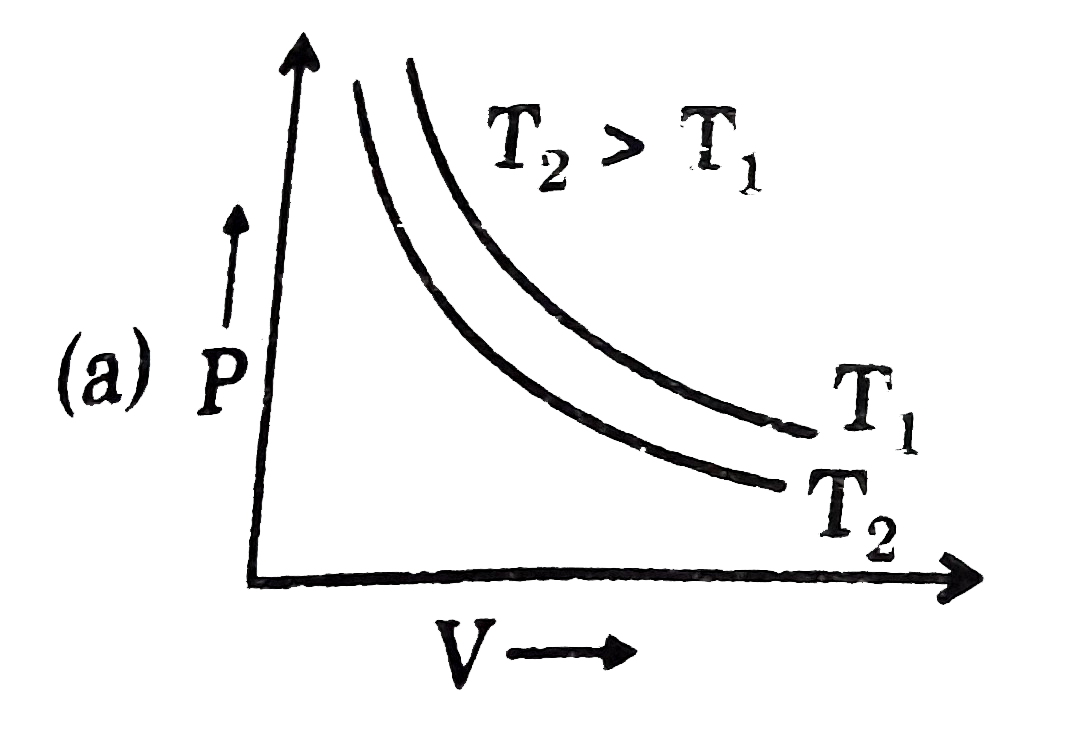 B
B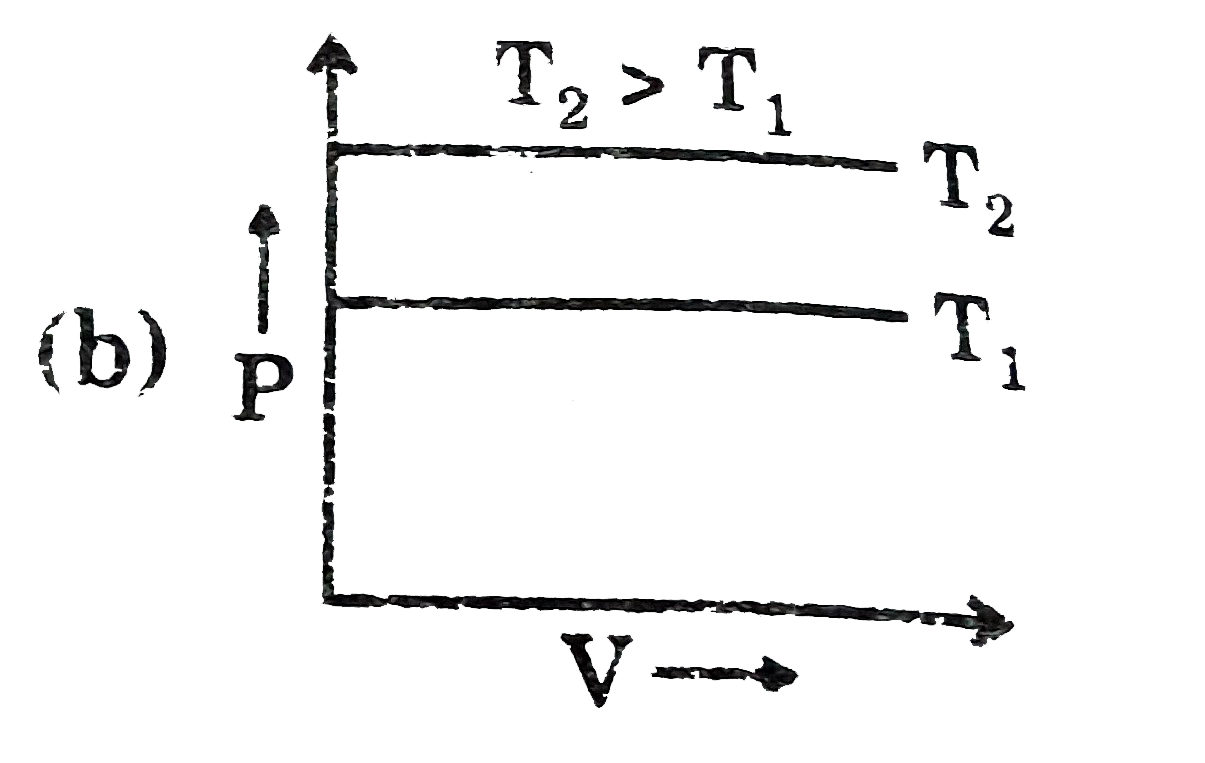 C
C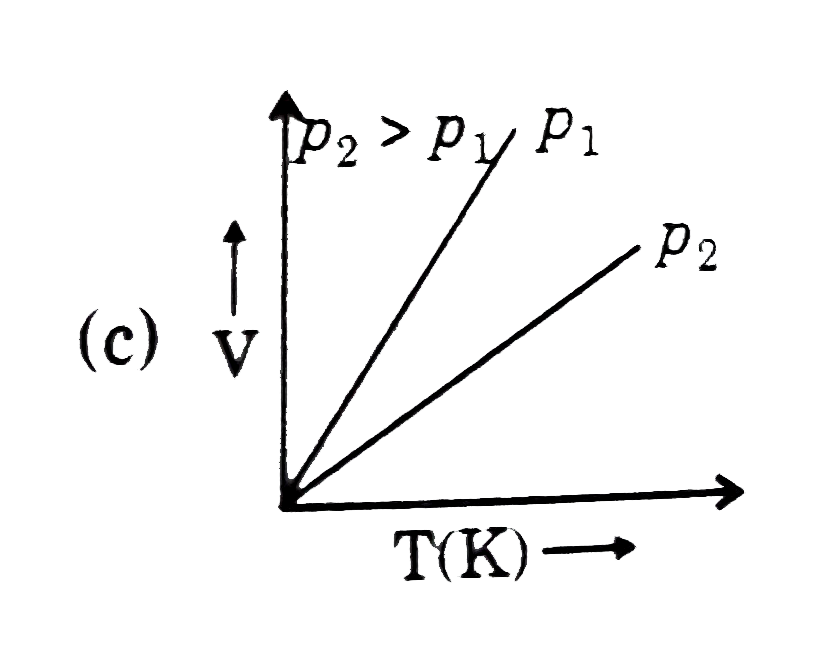 D
D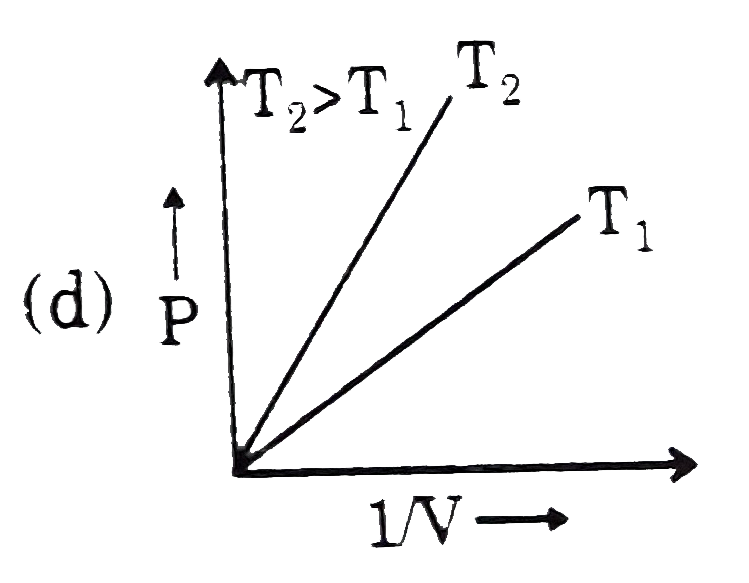
Which of the following diagram correctly describes the behaviour of a fixed mass of an ideal gas ? (T is measured in K)
View SolutionWhich of the following reaction depicts the oxidsing behaviour of H2SO4?
View SolutionWhich of the following measure the deviation from ideal behaviour of gas?
View SolutionWhich of the following reactions depict the oxidising behaviour of H2SO4?
View SolutionWhich of the following diagram correctly depicts the ralation between AC and MC ?
View Solution

