Show graphically the temperature variation with time associated with a colling hot body.
Text Solution
The correct Answer is:The rate of loss reduces as the temperature difference with surrounding is reduced.
(##RESHATPHYXIC03E01014_A01##)
|
Topper's Solved these Questions
- HEAT TRANSFERBOOK - RESONANCECHAPTER - HEAT TRANSFEREXERCISE - Exercise-1
1 Videos
- HEAT TRANSFERBOOK - RESONANCECHAPTER - HEAT TRANSFEREXERCISE - Exercise-2
1 Videos
- HEAT TRANSFERBOOK - RESONANCECHAPTER - HEAT TRANSFEREXERCISE - Example
10 Videos
- GRAVITATIONBOOK - RESONANCECHAPTER - GRAVITATIONEXERCISE - Exercise
21 Videos
- KINEMATICSBOOK - RESONANCECHAPTER - KINEMATICSEXERCISE - Exercise
65 Videos
Similar Questions
Knowledge Check
Colle's fracture is associated with
AfemurBulnaCHumerusDradiusColle's fracture is associated with :
AFemurBUlnaCRadiusDHumerus
Show graphically variation of AC with time. Explain the nature of the graph.
View SolutionShow graphically the nature of variation of radius of orbit with the principal quantum number.
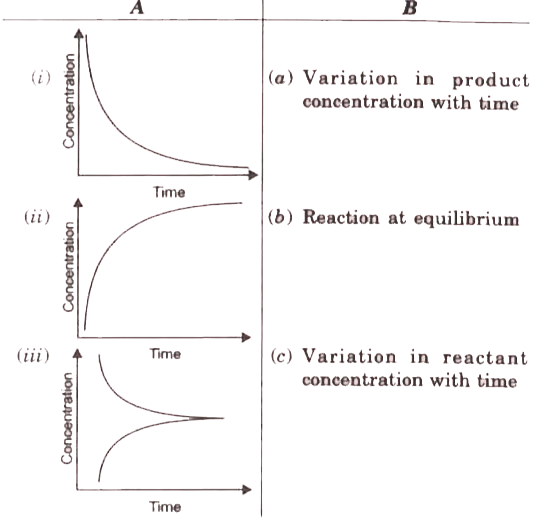
View SolutionMatch the following graphical variation with their description

View SolutionShow graphically, the variation of the de-Broglie wavelength λ with the potential V through which an electron is accelerated from rest.
View SolutionShow graphically, the variation of the de-Broglie wavelength (λ) with the potential (V) through which an electron is accelerated from rest.
View SolutionShow graphically, the variation of the de-Broglie wavelength (λ) with the potential (V) through which an electron is accelerated from rest.
View Solution
