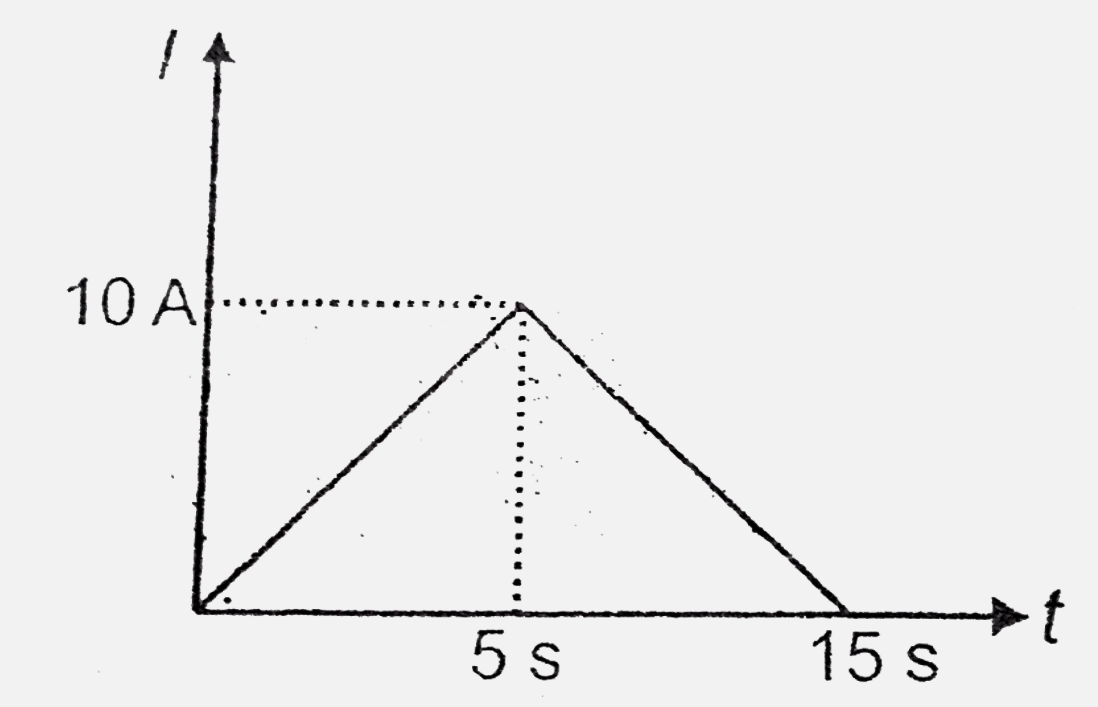
Current l versus time t graph through a conductor is shown in the figure. Average current through the conductor in the interval 0 to 15 s is

1A
10A
7.5A
5A
The correct Answer is:4
Step by step video & image solution for Current l versus time t graph through a conductor is shown in the figure. Average current through the conductor in the interval 0 to 15 s is by Physics experts to help you in doubts & scoring excellent marks in Class 12 exams.
Updated on:21/07/2023Topper's Solved these Questions
- CURRENT ELECTRICITYBOOK - AAKASH INSTITUTECHAPTER - CURRENT ELECTRICITYEXERCISE - ASSIGNMENT SECTION-B(OBJECTIVE TYPE QUESTION ))
31 Videos
- CURRENT ELECTRICITYBOOK - AAKASH INSTITUTECHAPTER - CURRENT ELECTRICITYEXERCISE - ASSIGNMENT SECTION-C(OBJECTIVE TYPE QUESTION ))
3 Videos
- CURRENT ELECTRICITYBOOK - AAKASH INSTITUTECHAPTER - CURRENT ELECTRICITYEXERCISE - Try Yourself
32 Videos
- COMMUNICATION SYSTEMS BOOK - AAKASH INSTITUTECHAPTER - COMMUNICATION SYSTEMS EXERCISE - ASSIGNMENT SECTION D (Assertion-Reason)
10 Videos
- DUAL NATURE OF RADIATION AND MATTER BOOK - AAKASH INSTITUTECHAPTER - DUAL NATURE OF RADIATION AND MATTER EXERCISE - ASSIGNMENT (SECTION-D)
10 Videos
Similar Questions
Knowledge Check
When current passes through a conductor,
Ait creates an electric firld around it, directed towards the conductorBit creates an electric field, directed away from the conductorCnone of the aboveDAll of theseA charge of magnitude q flows through the conductor in time 't' . The current through the conductor is
AI=q/tBI=qtCI=t/qDI=q2tThe flow of the electric current through a metallic conductor is
Aonly due to electronsBonly due to +ve chargesCdue to both nuclei and electrons.Dcan not be presicted
When a current flows through a conductor its temperature
View SolutionCharge through a cross-section of a conductor is given by Q =5t2−2t coulomb. Find the average current through the conductor in the interval t1, = 2 s to t2= 4 s.
View SolutionCharge through a cross section of a conductor is give by Q=5t2−2t coulomb .Find the average current through the conduction the interval t1=2s to t2=4s .
View SolutionWhen electric current passes through any conductor, then its temperature is
View SolutionWhen electric current passes through any conductor, then its temperature is
View Solution
