In which of the following reactions the graph of concentration vs time for reactants and products will be difficult to plot.
N2O5(g)→2NO2(g)+12O2(g)
CH3O∣∣C−OCH3(aq)[H+]−−−→CH3O∣∣C−OH+CH3OH
H2(g)+12O2(g)→H2O(l)
H2O2(aq)→H2O(l)+12O2(g)
The correct Answer is:B
Topper's Solved these Questions
- CHEMICAL KINETICSBOOK - GRB PUBLICATIONCHAPTER - CHEMICAL KINETICSEXERCISE - C. Integrated Rate Laws
73 Videos
- CHEMICAL KINETICSBOOK - GRB PUBLICATIONCHAPTER - CHEMICAL KINETICSEXERCISE - D. Methods to Determine the Rate Law
28 Videos
- CHEMICAL KINETICSBOOK - GRB PUBLICATIONCHAPTER - CHEMICAL KINETICSEXERCISE - Subjective Type
63 Videos
- CHEMICAL BONDING-IBOOK - GRB PUBLICATIONCHAPTER - CHEMICAL BONDING-IEXERCISE - Subjective Type
120 Videos
- COORDINATION COMPOUNDSBOOK - GRB PUBLICATIONCHAPTER - COORDINATION COMPOUNDSEXERCISE - SBJECTIVE TYPE
98 Videos
Similar Questions
Consider the reaction A→B. The concentration of both the reactants and the products varies exponentially with time. Which of the following figure correctly describes the change in concentration of reactants and products with time ?
View SolutionFor a zero order reaction, the plot of concentration, vs time is linear with
View Solution
Knowledge Check
Consider the reaction A→B. The concentration of both the reactants and the products varies exponentially with time. Which of the following figure correctly describes the change in concentration of reactants and products with time ?
A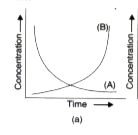 B
B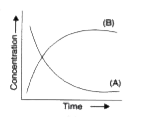 C
C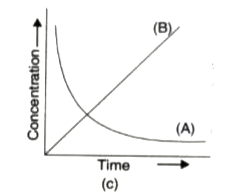 D
D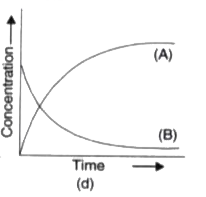
Consider the reaction A→B. The concentration of both the reactants and the products varies exponentially with time. Which of the following figure correctly describes the change in concentration of reactants and products with time ?
A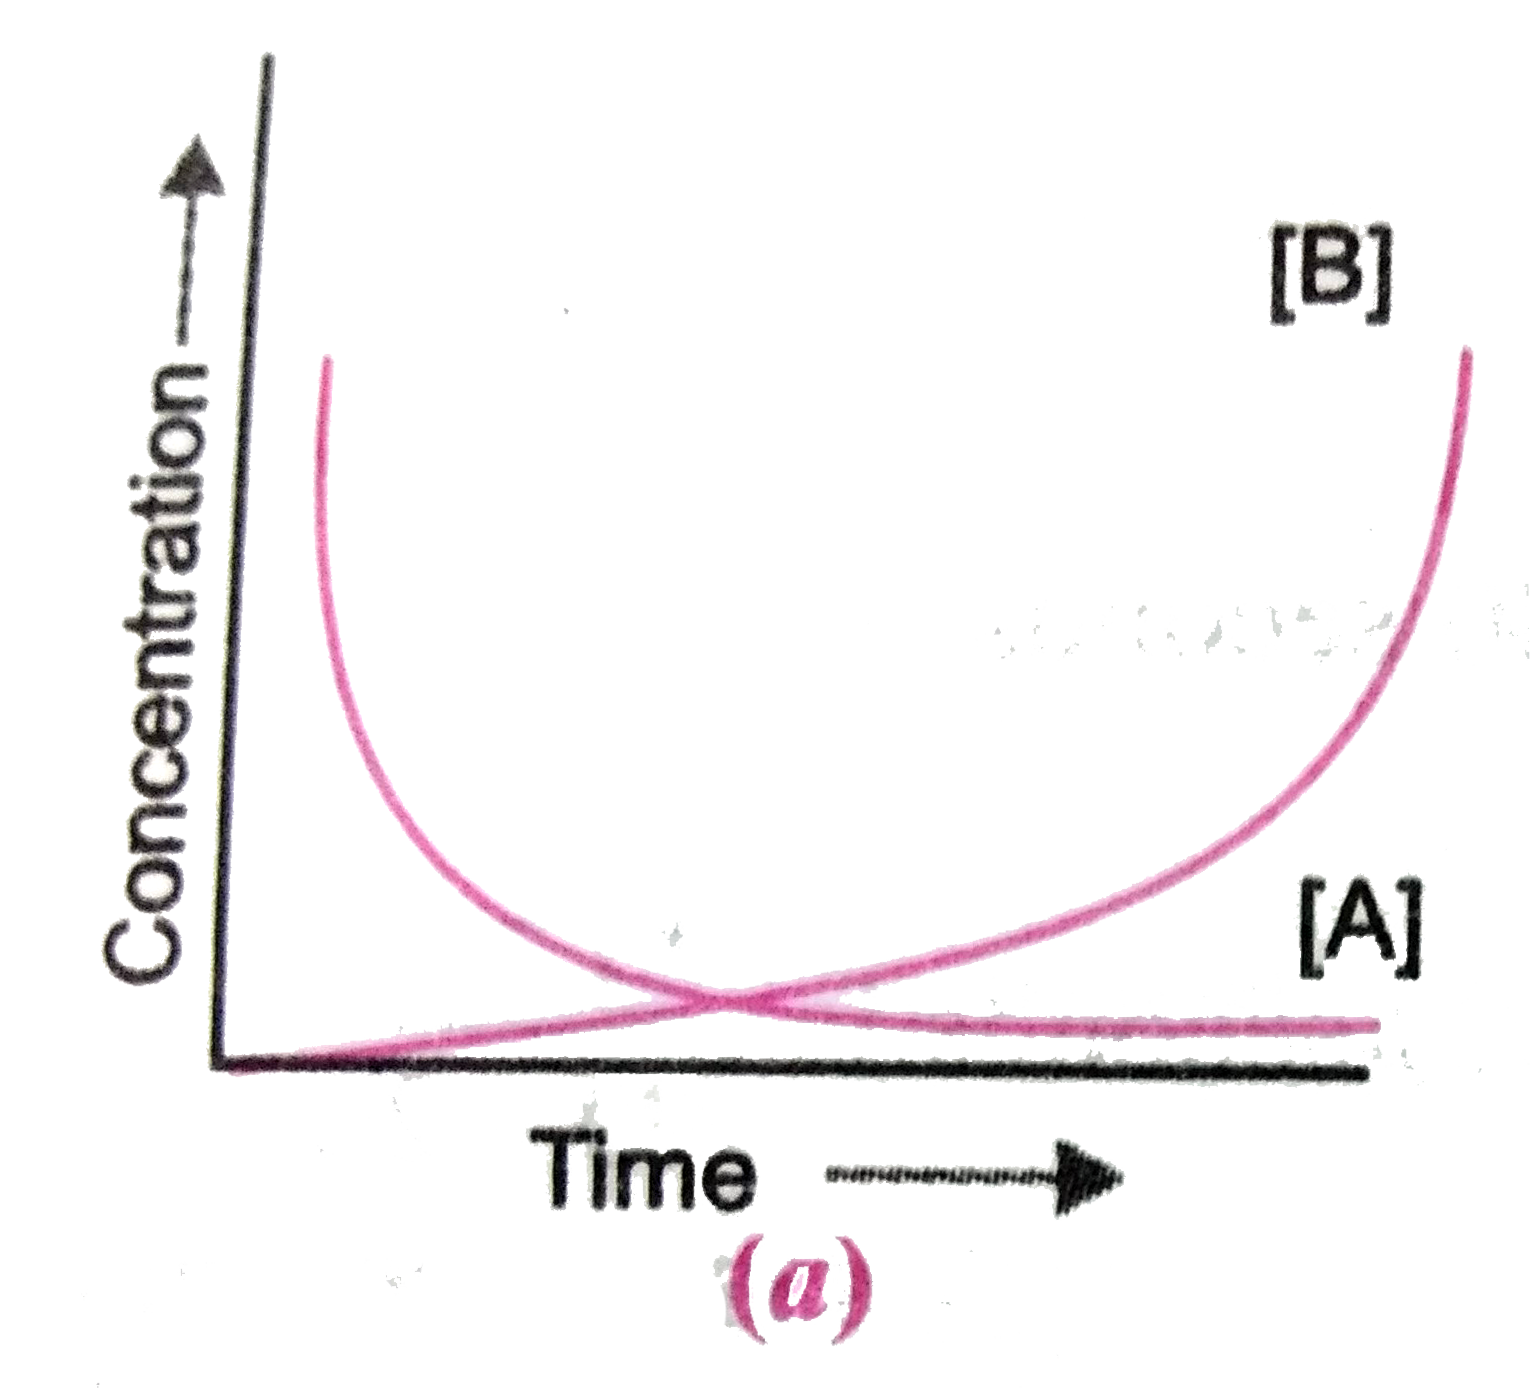 B
B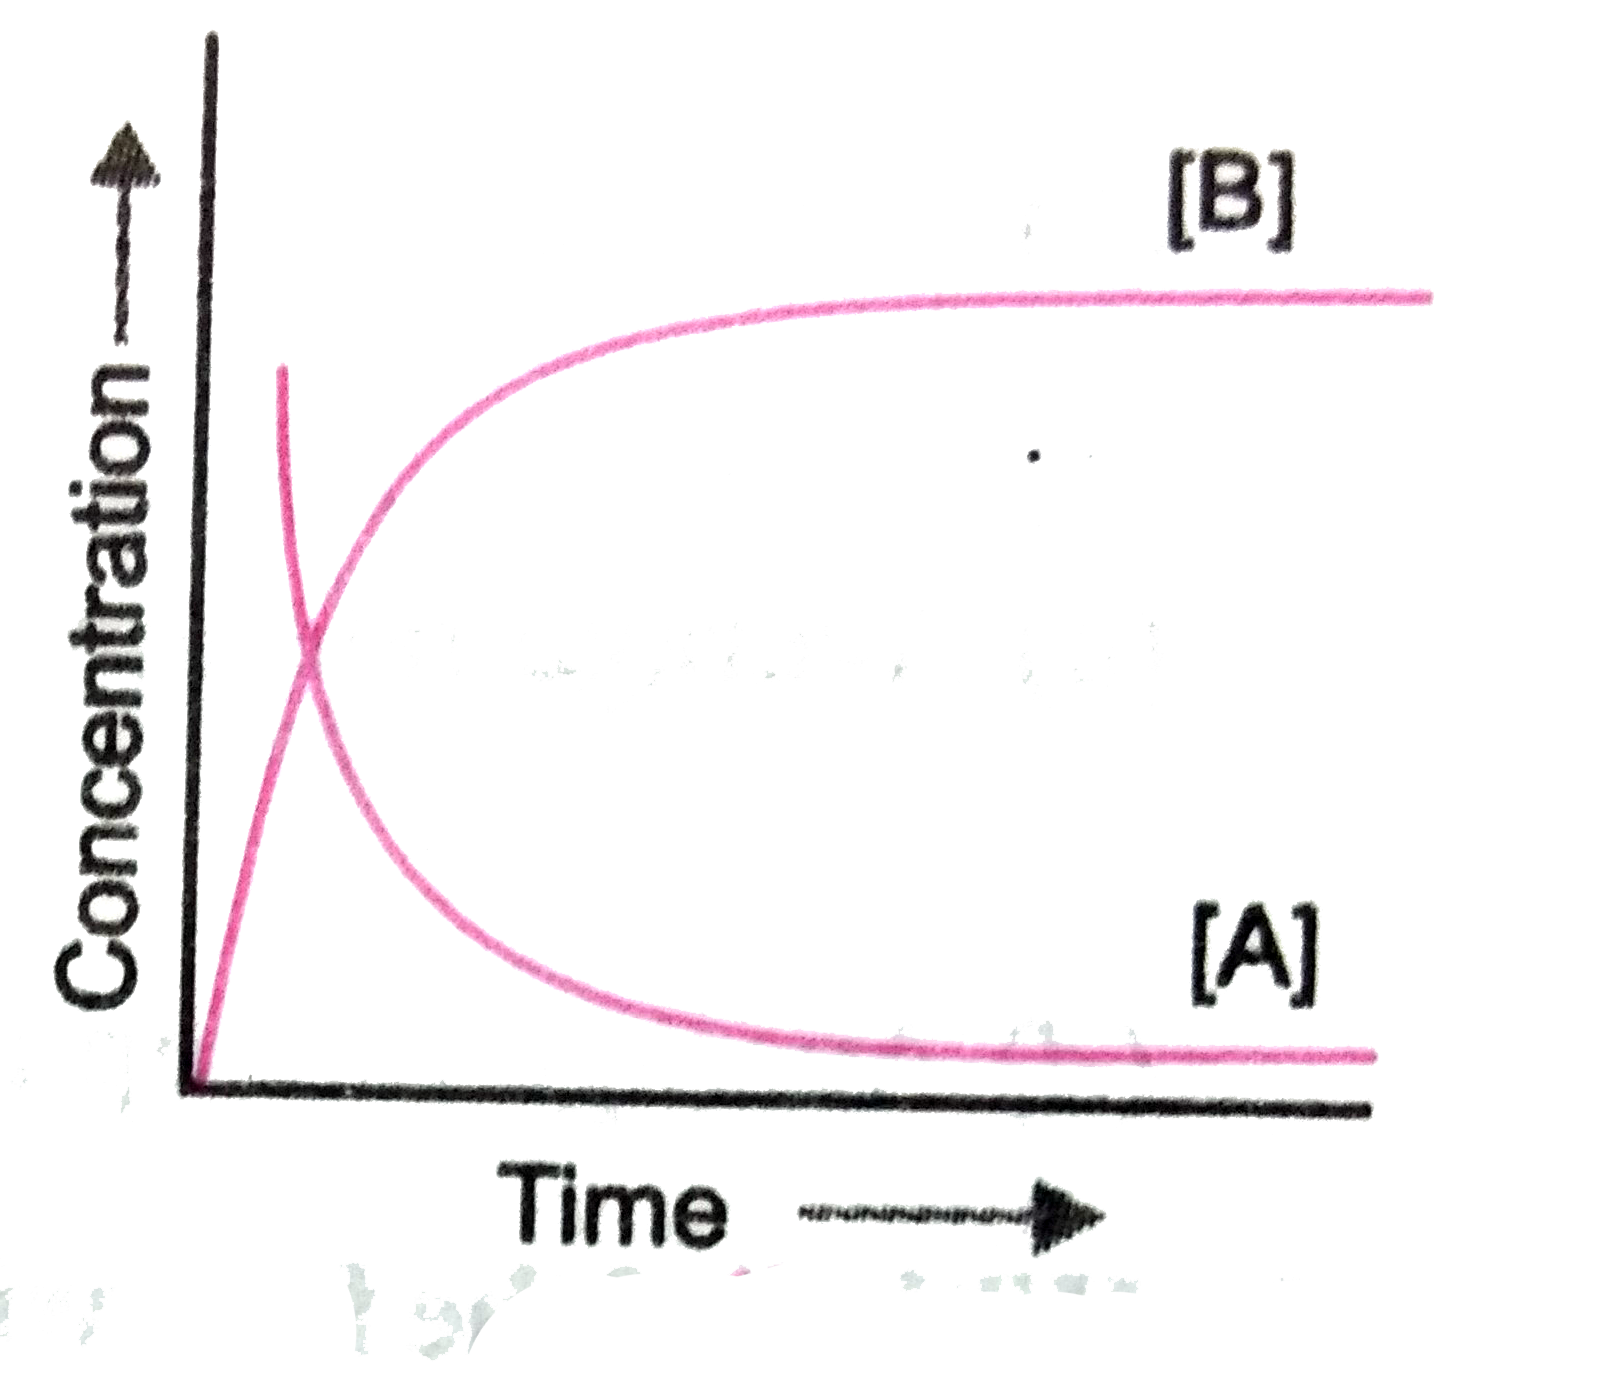 C
C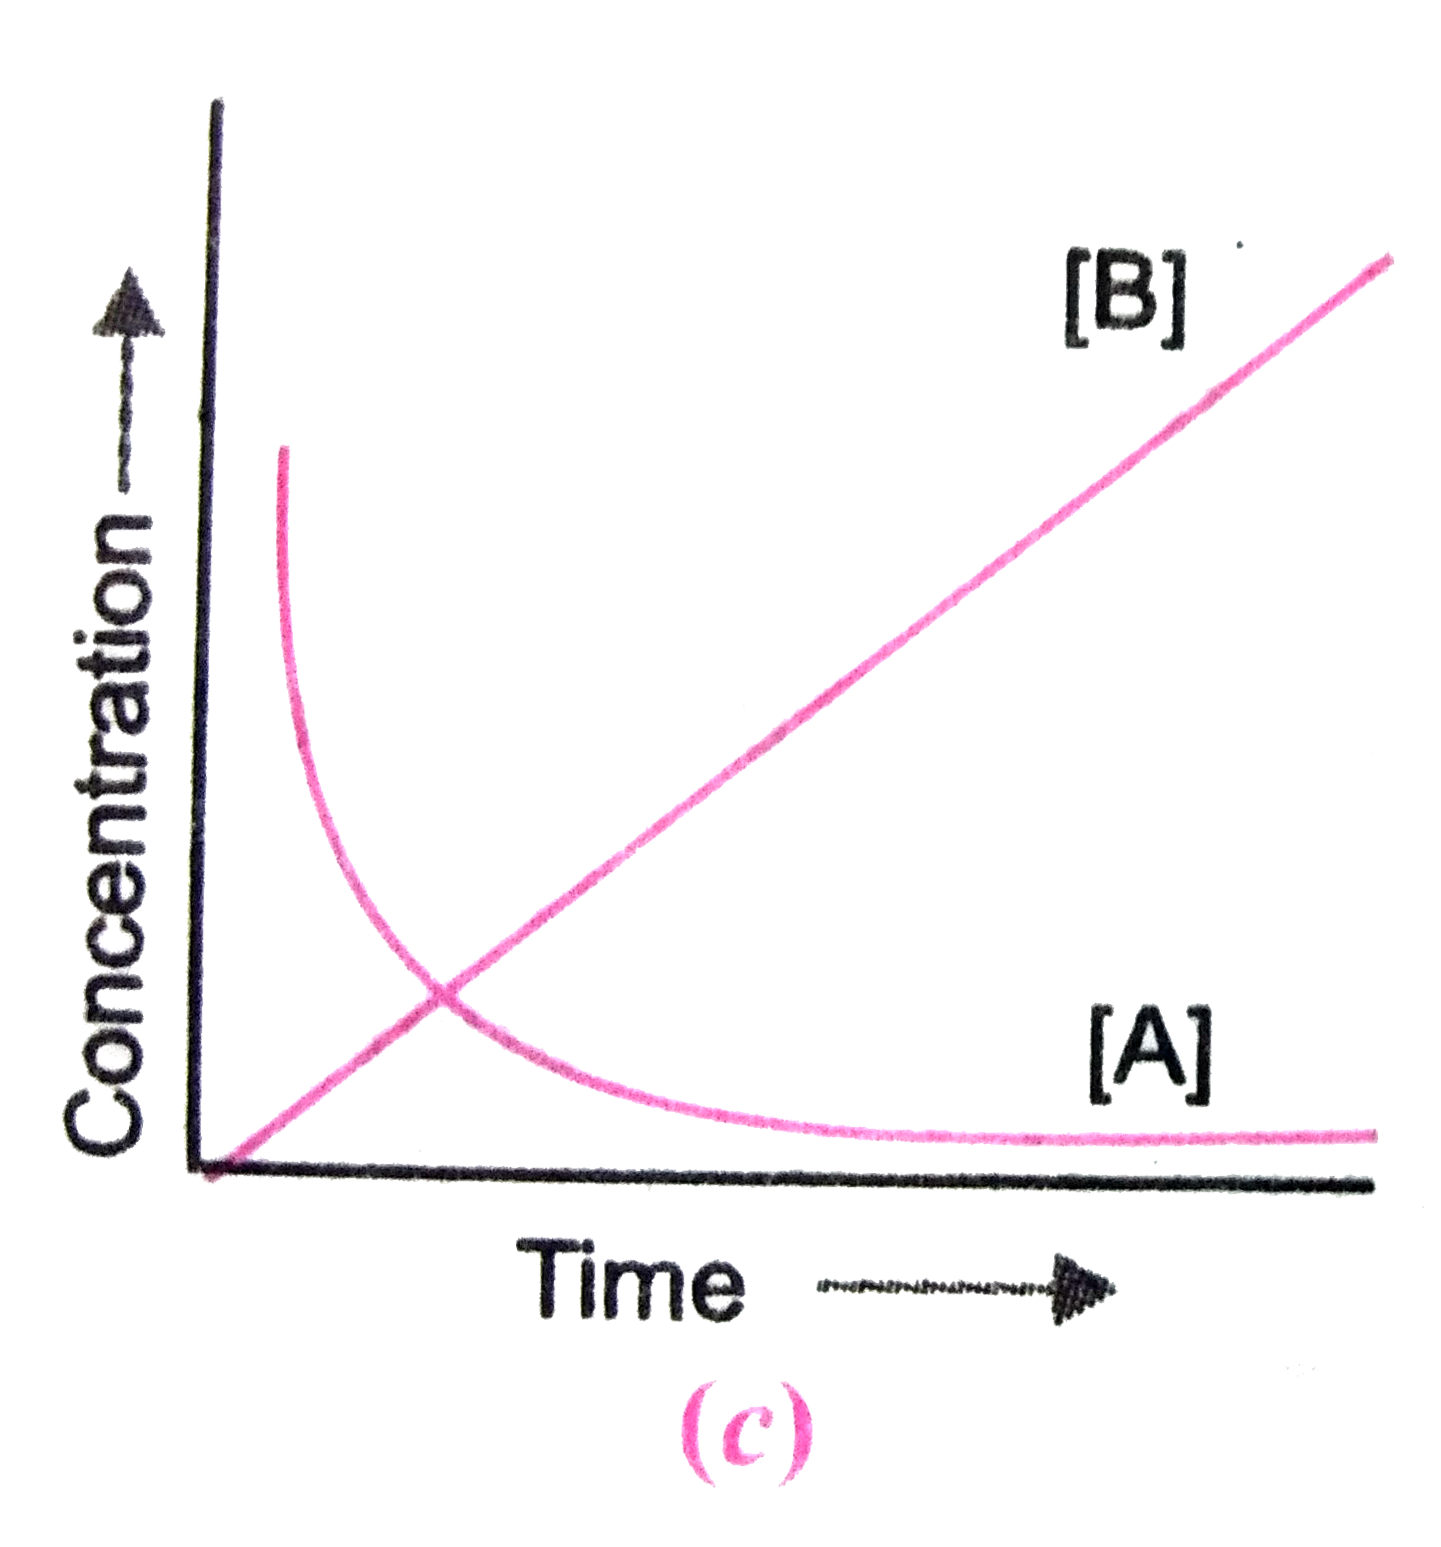 D
D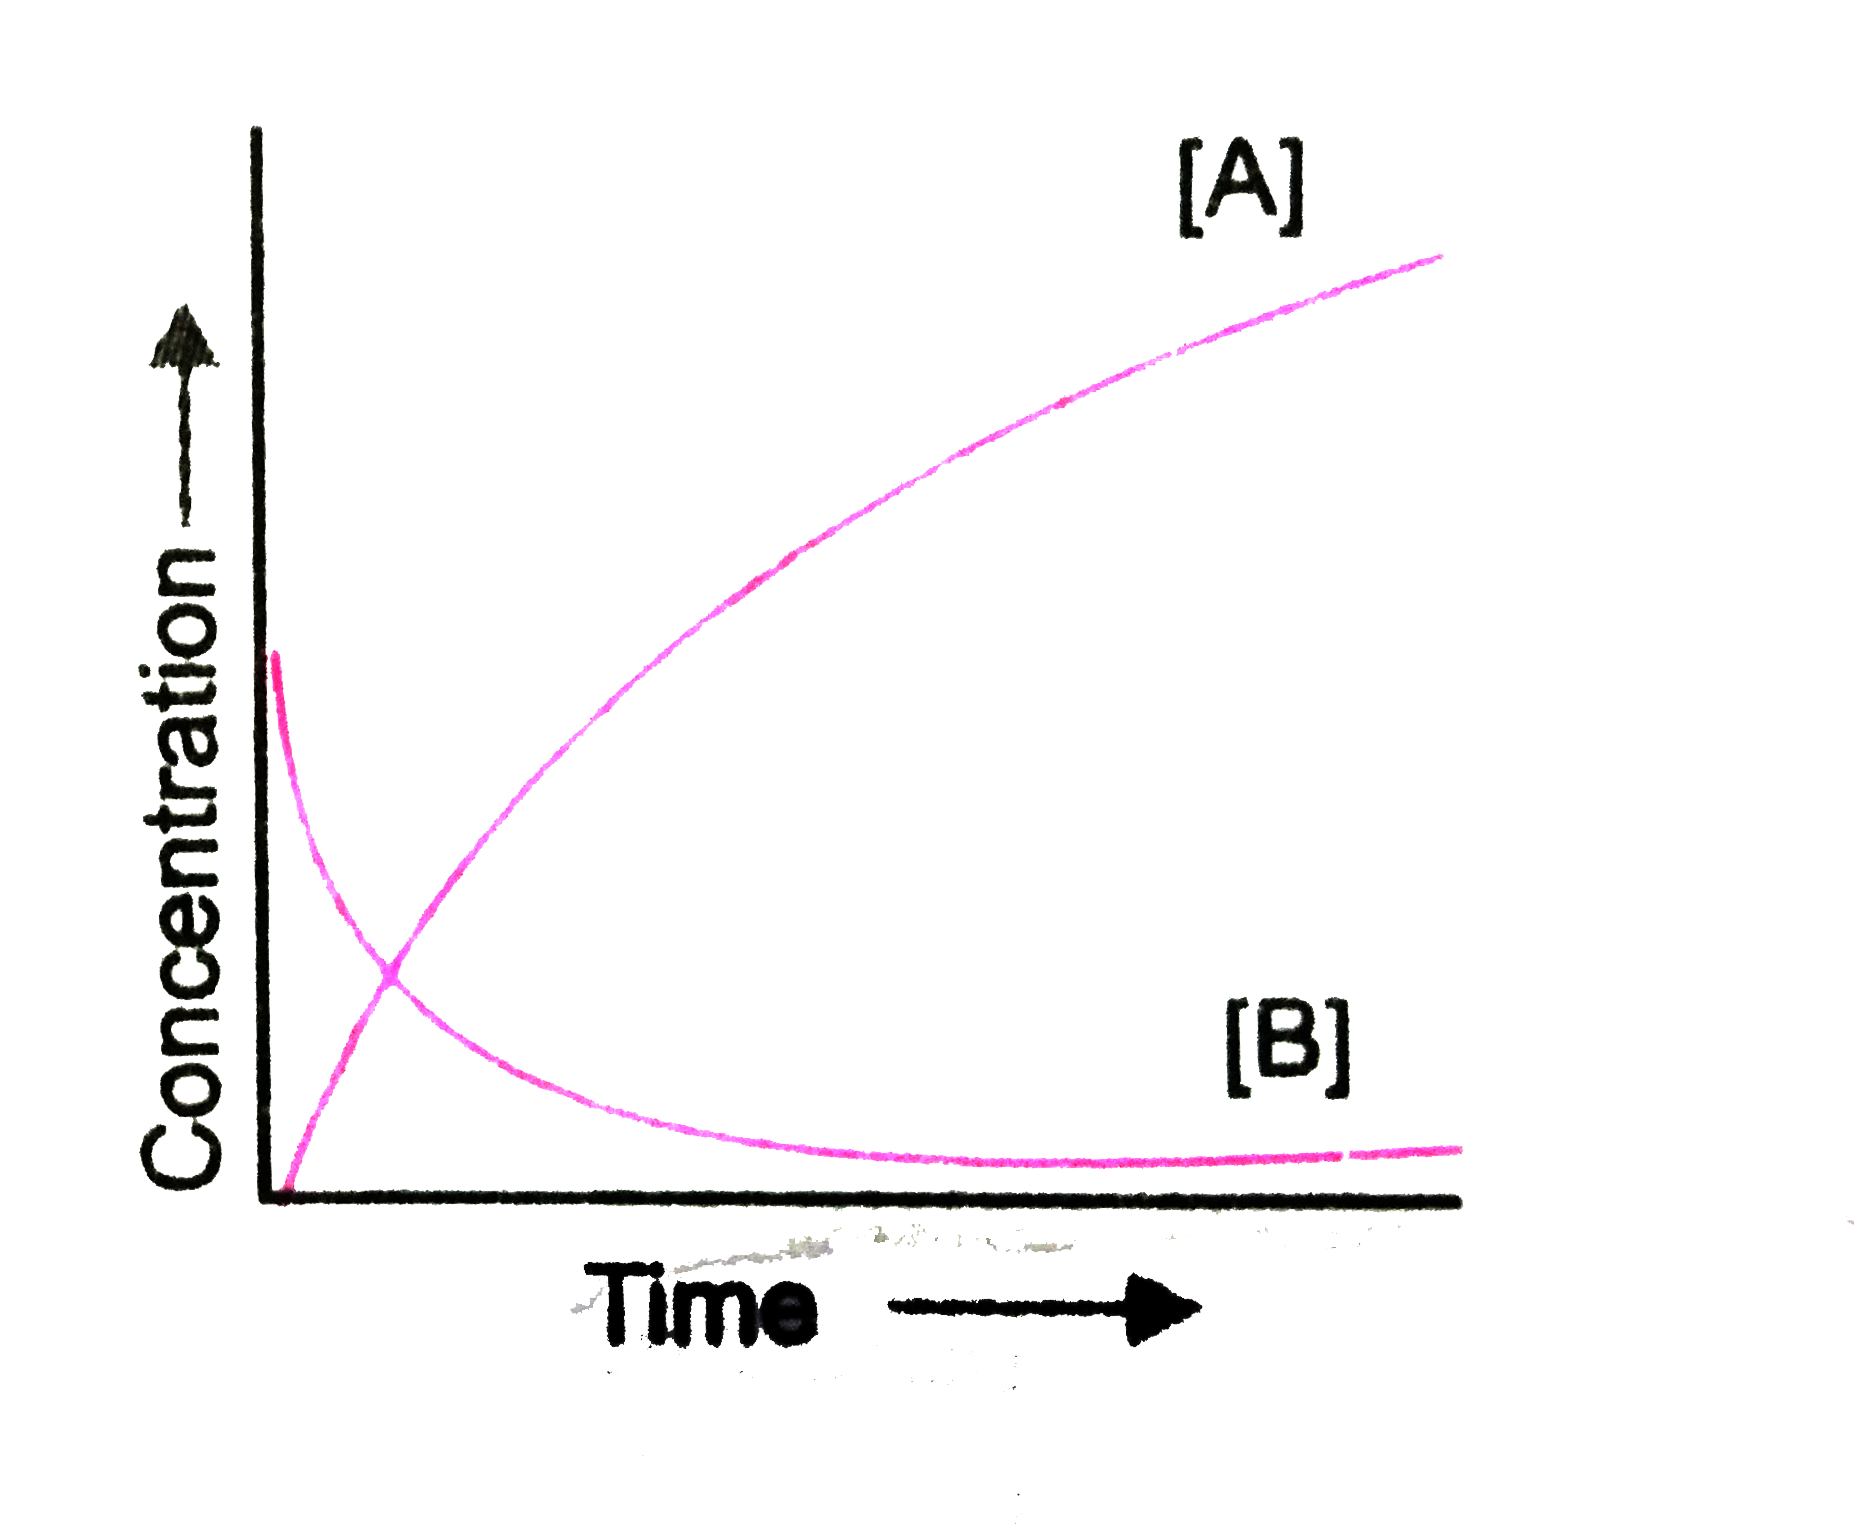
Consider the reaction A→B. The concentration of both the reactants and the products varies exponentially with time. Which of the following figure correctly describes the change in concentration of reactants and products with time ?
A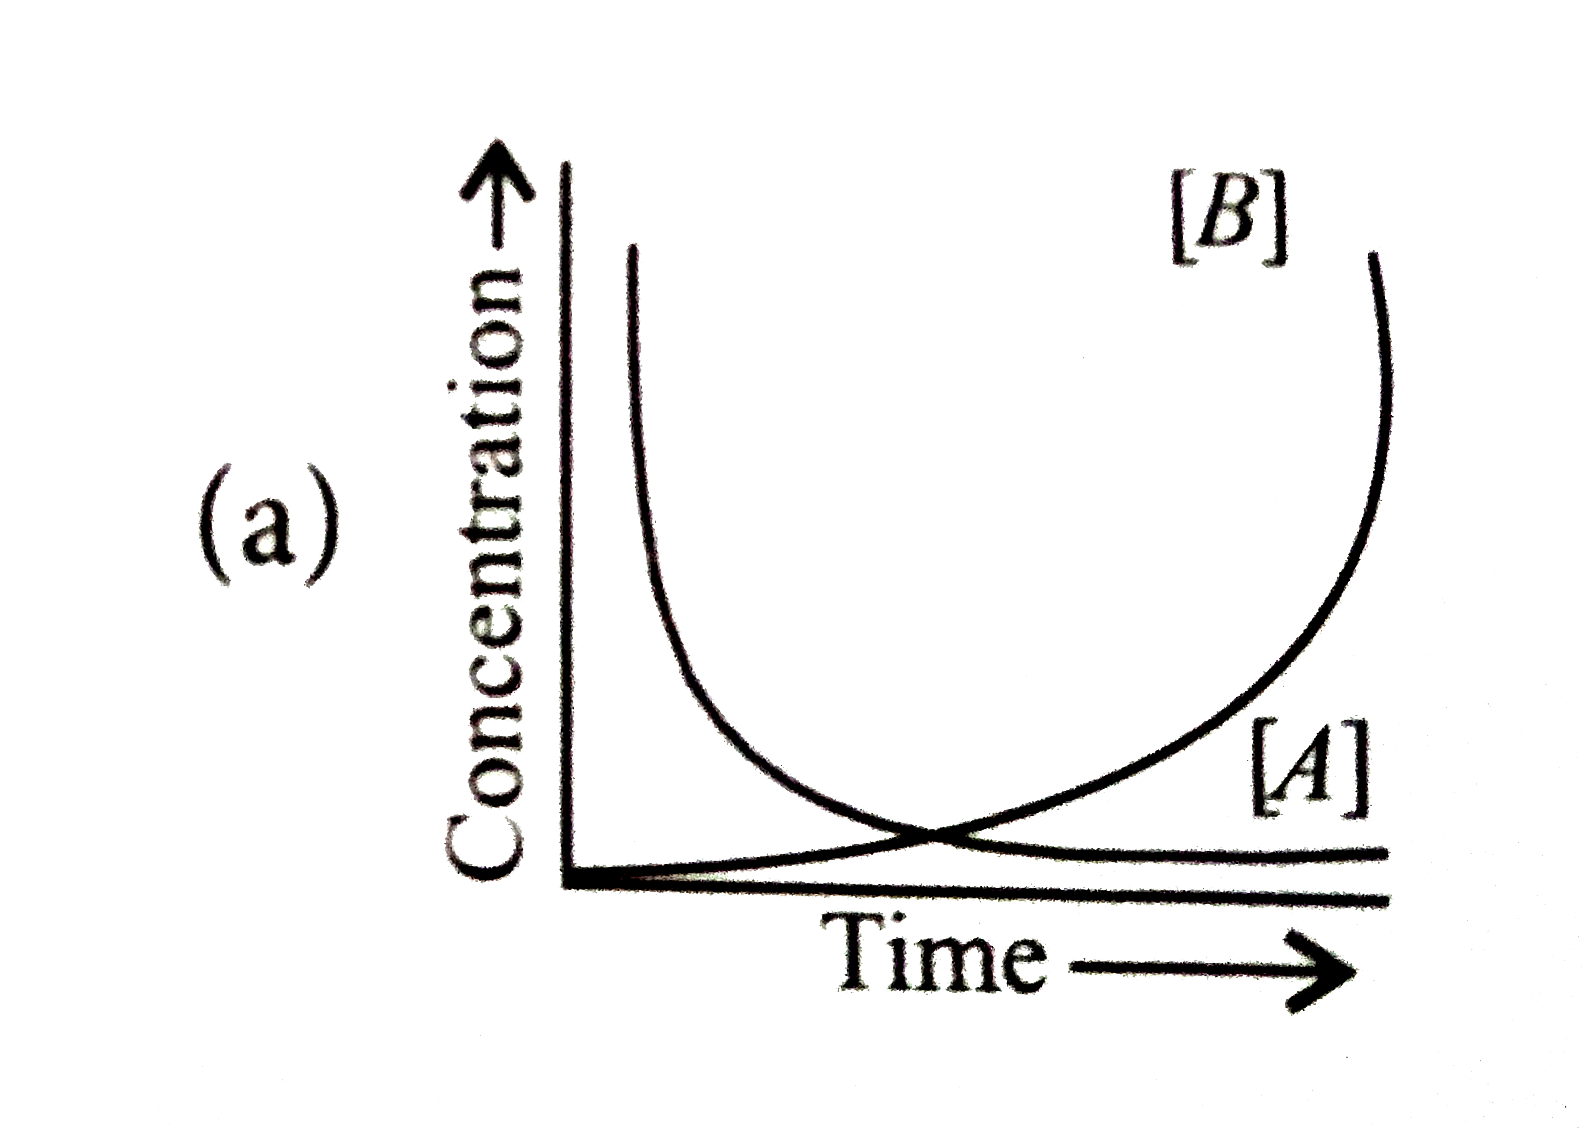 B
B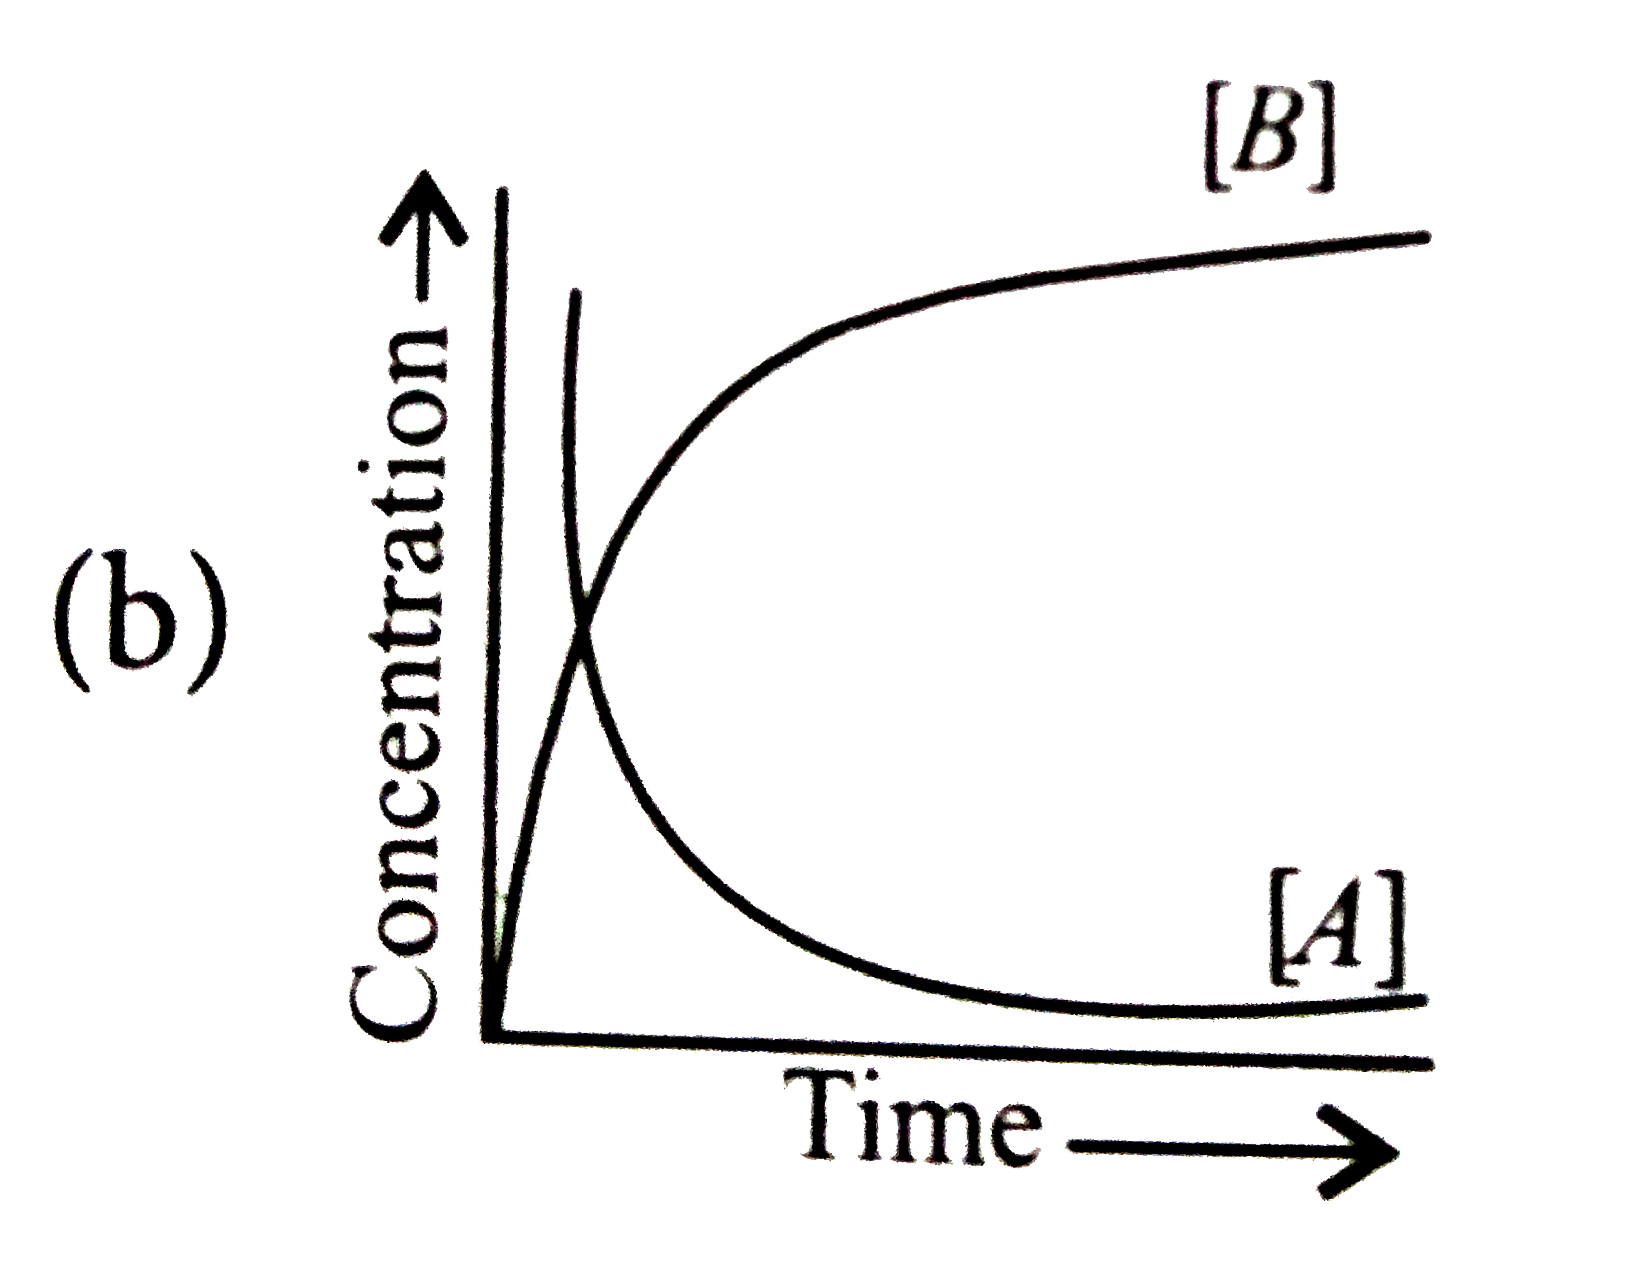 C
C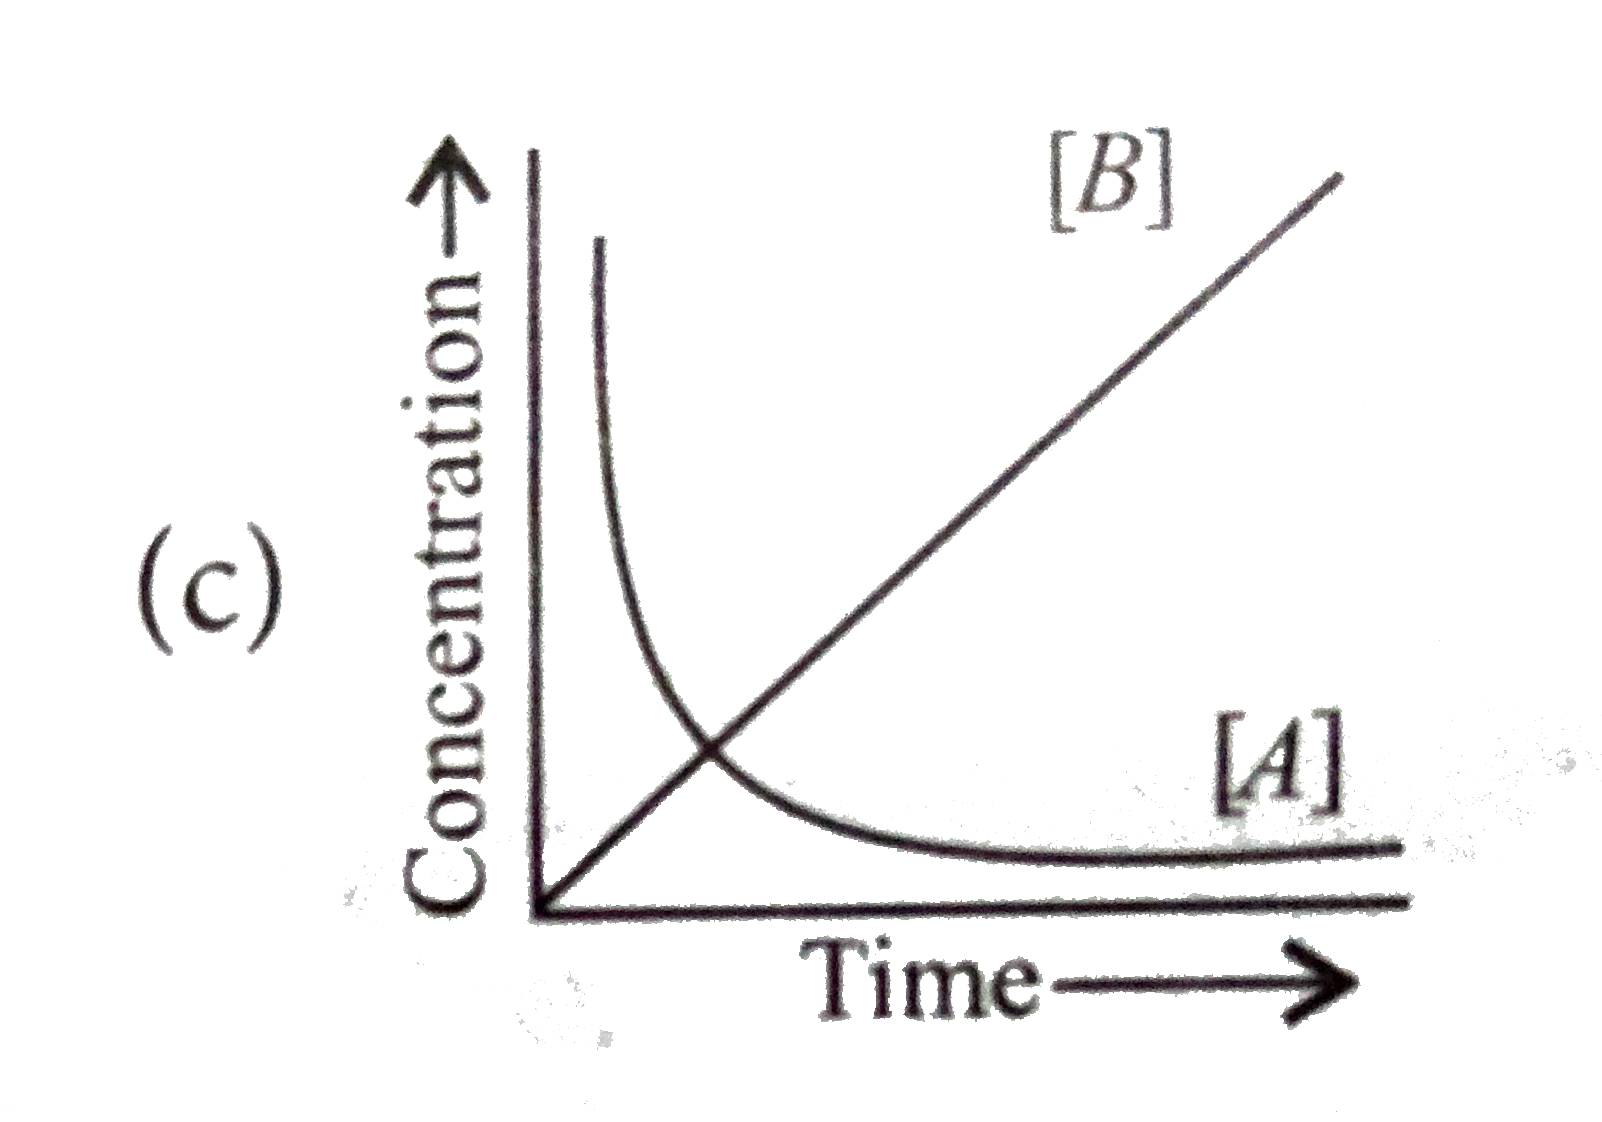 D
D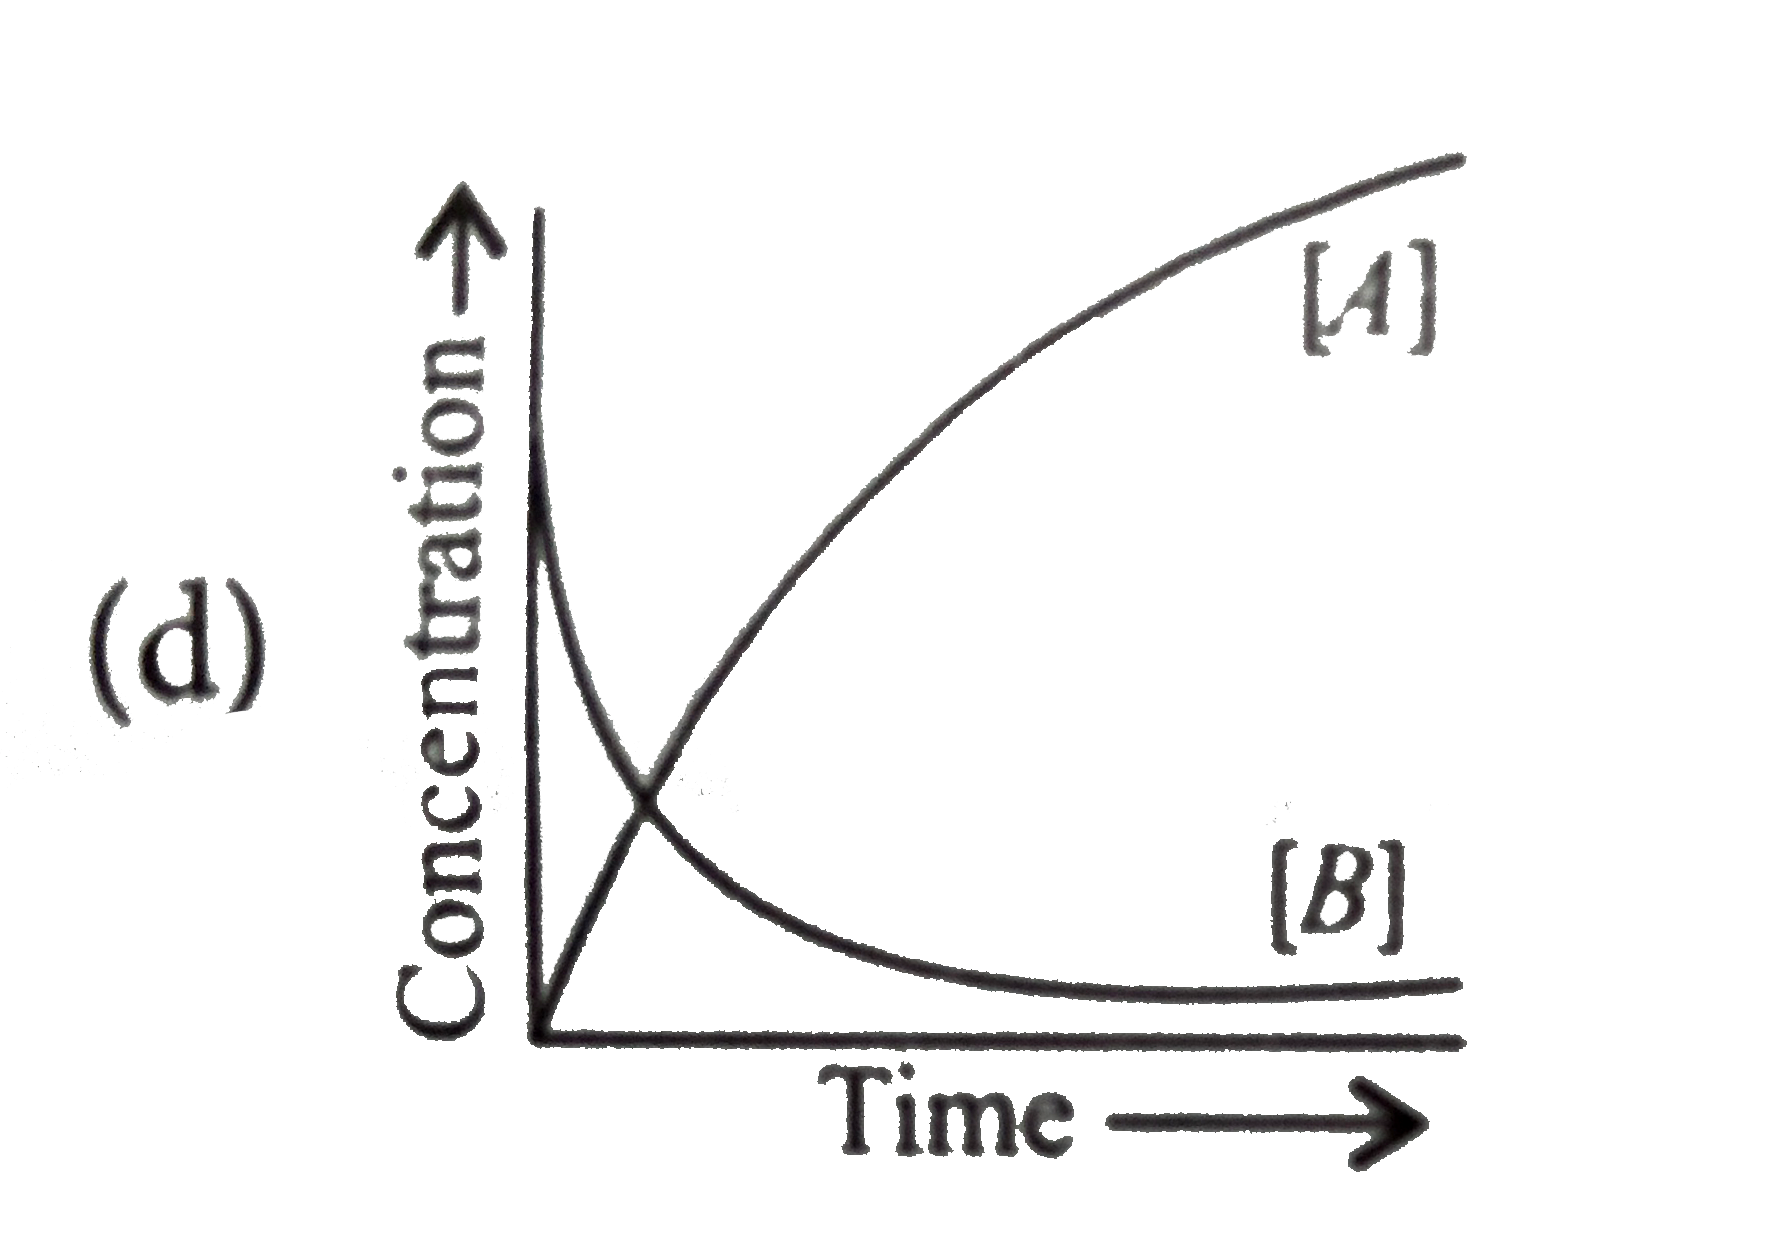
Consider the reaction A<⇒B. The concentration of both the reactants and the products varies exponentially with time. Which of the following figures correctly describes the change in concentration of reactants and products with time?
View SolutionConsider the reaction A→B. The concentration of both the reactants and the products varies exponentially with time. Which of the following figure correctly describes the change in concentration of reactants and products with time ?
View SolutionConsider the reaction A→B. The concentration of both the reactants and the products varies exponentially with time. Which of the following figure correctly describes the change in concentration of reactants and products with time ?
View SolutionConsider the reaction A→B. The concentration of both the reactants and the products varies exponentially with time. Which of the following figure correctly describes the change in concentration of reactants and products with time ?
View SolutionConsider the reaction A→B. The concentration of both the reactants and the products varies exponentially with time. Which of the following figure correctly describes the change in concentration of reactants and products with time ?
View Solution
