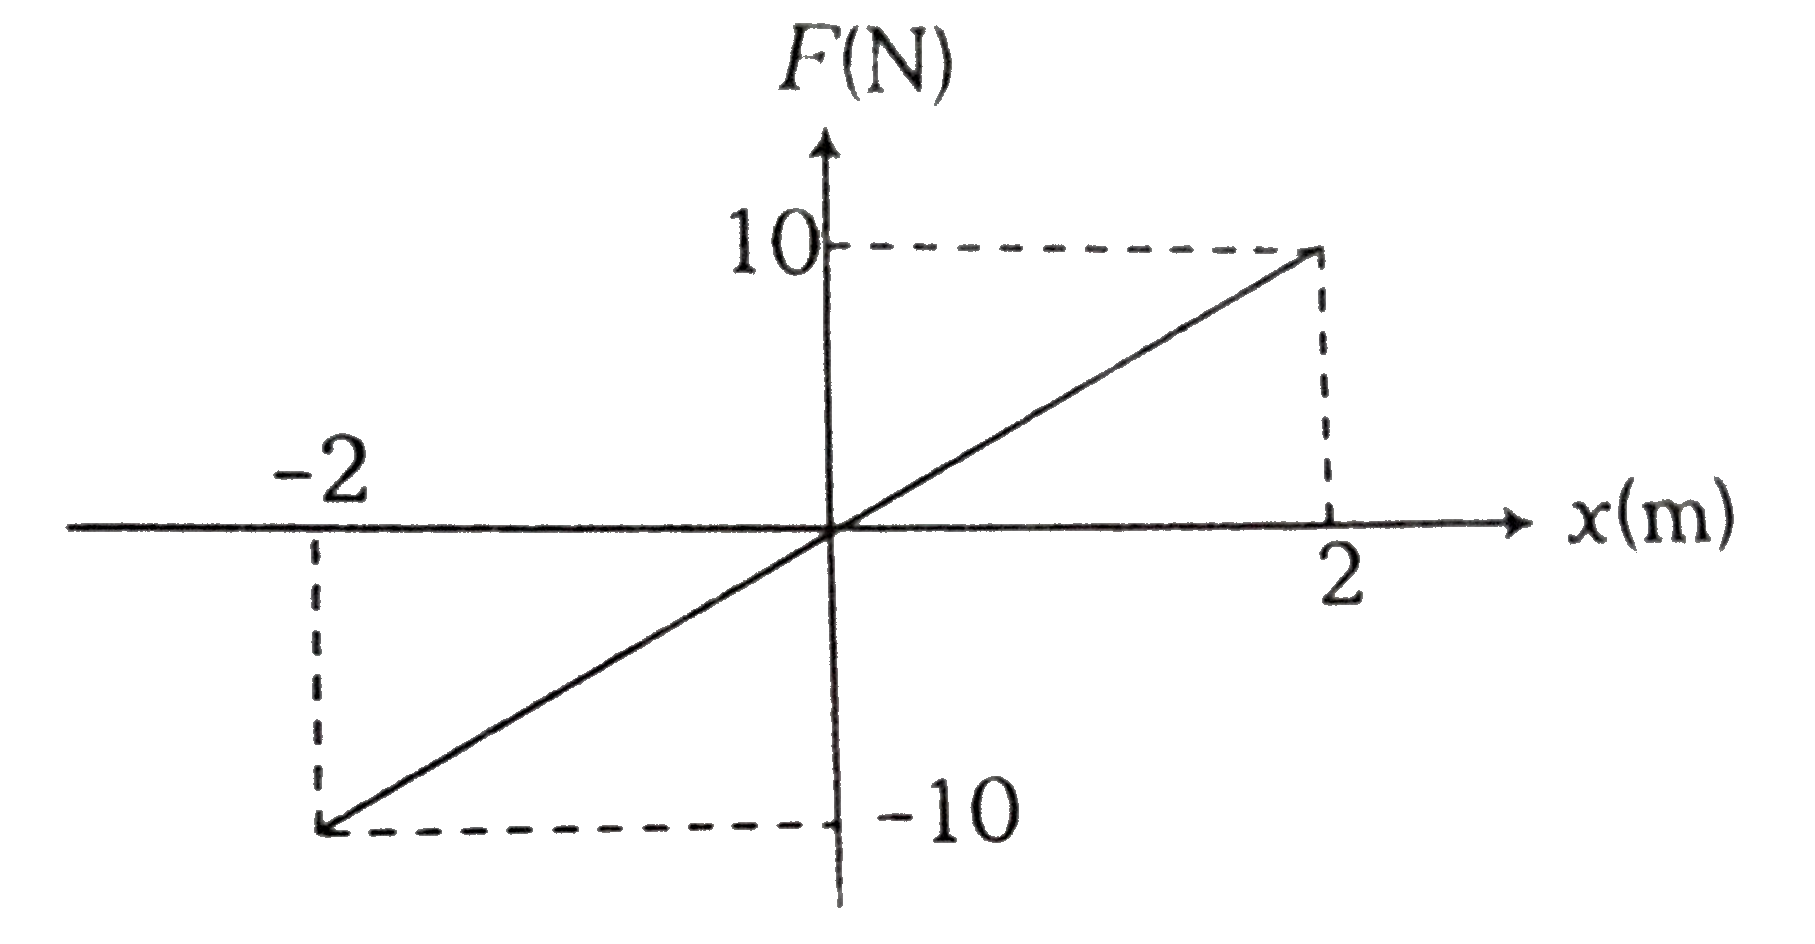
When the net force F acting on the particle varies as its position along x-axis shown in the figure, which of the following cannot be oscillatory motion. (where x is the position of the particle)
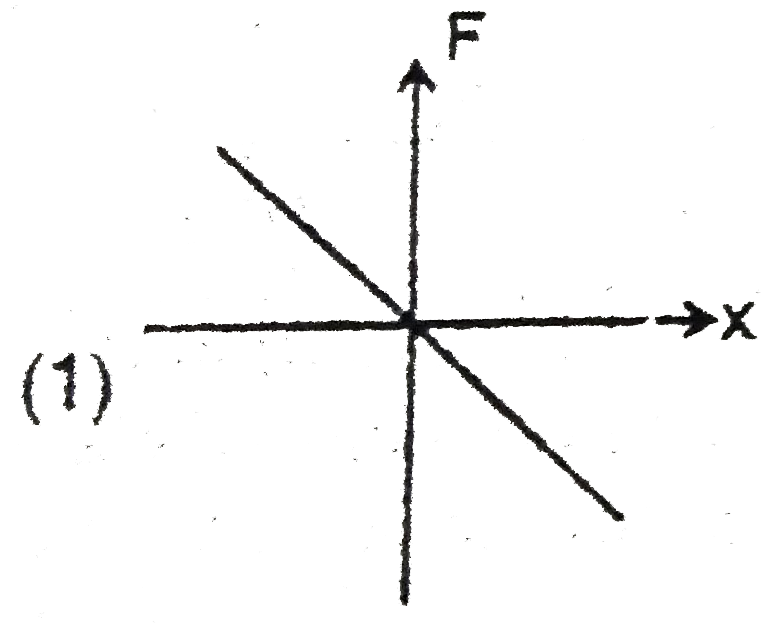
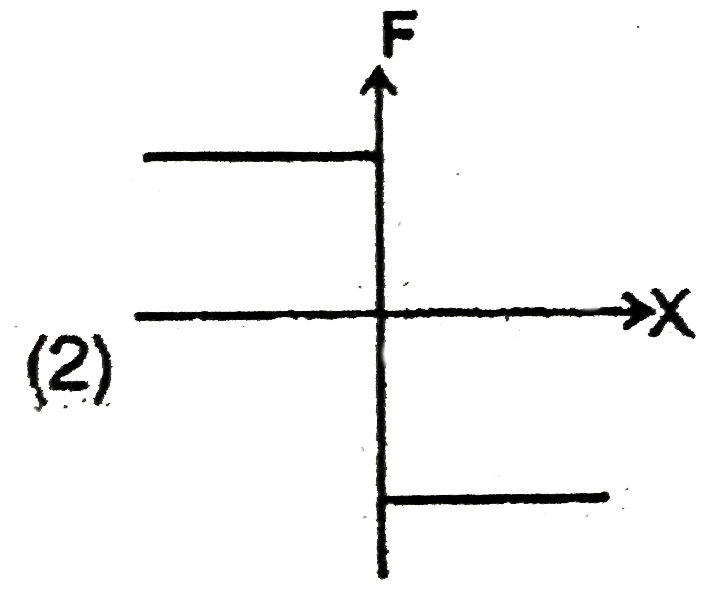
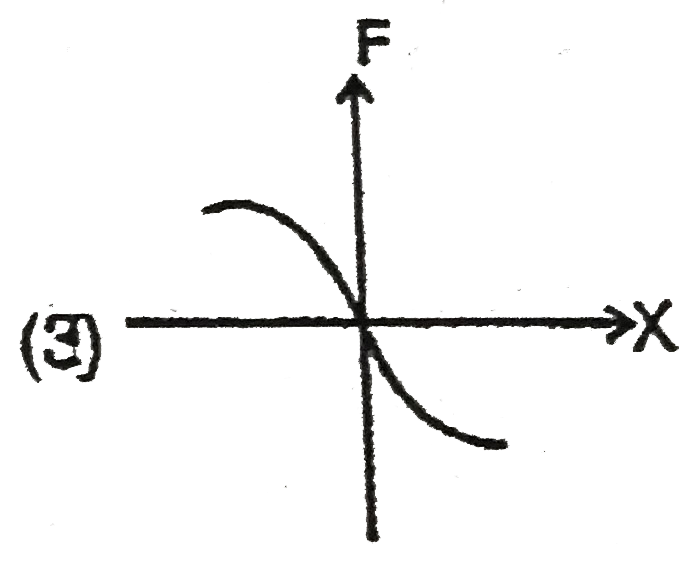

The correct Answer is:D
Step by step video, text & image solution for When the net force F acting on the particle varies as its position along x-axis shown in the figure, which of the following cannot be oscillatory motion. (where x is the position of the particle) by Physics experts to help you in doubts & scoring excellent marks in Class 11 exams.
Topper's Solved these Questions
Similar Questions
Knowledge Check
- Question 1 - Select One
A force F acting on a particle varies with the position x as shown in the graph. Find the work done by the force in displacing the particle from x=−a to x=+2a.
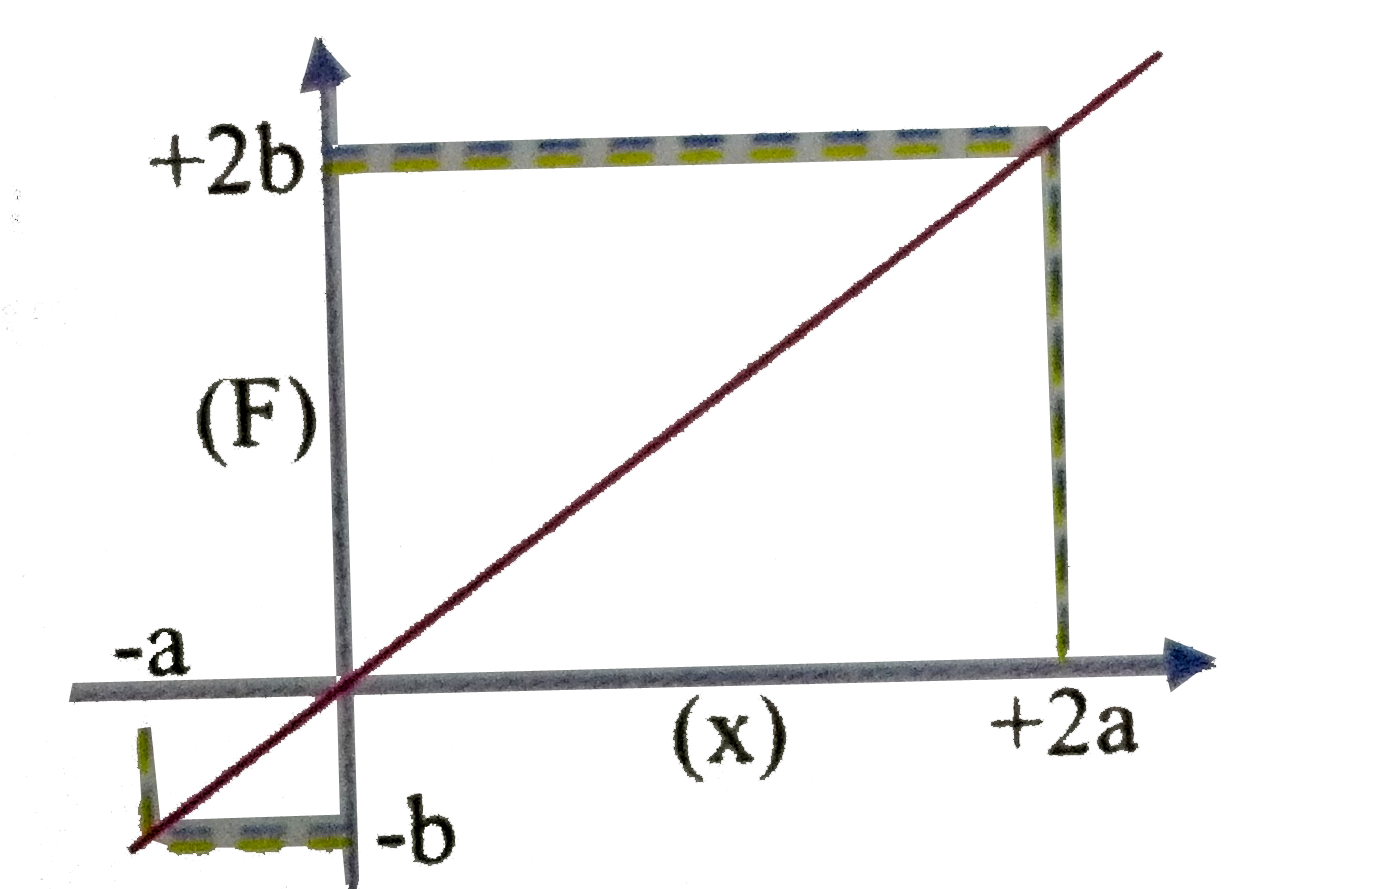 .A3ab2B4ab2C23abD24ab
 - Question 2 - Select One
A position dependent force F ia acting on a particle and its force-position curve is shown in the figure. Work done on the particle, when its displacement is from 0 to 5 m is
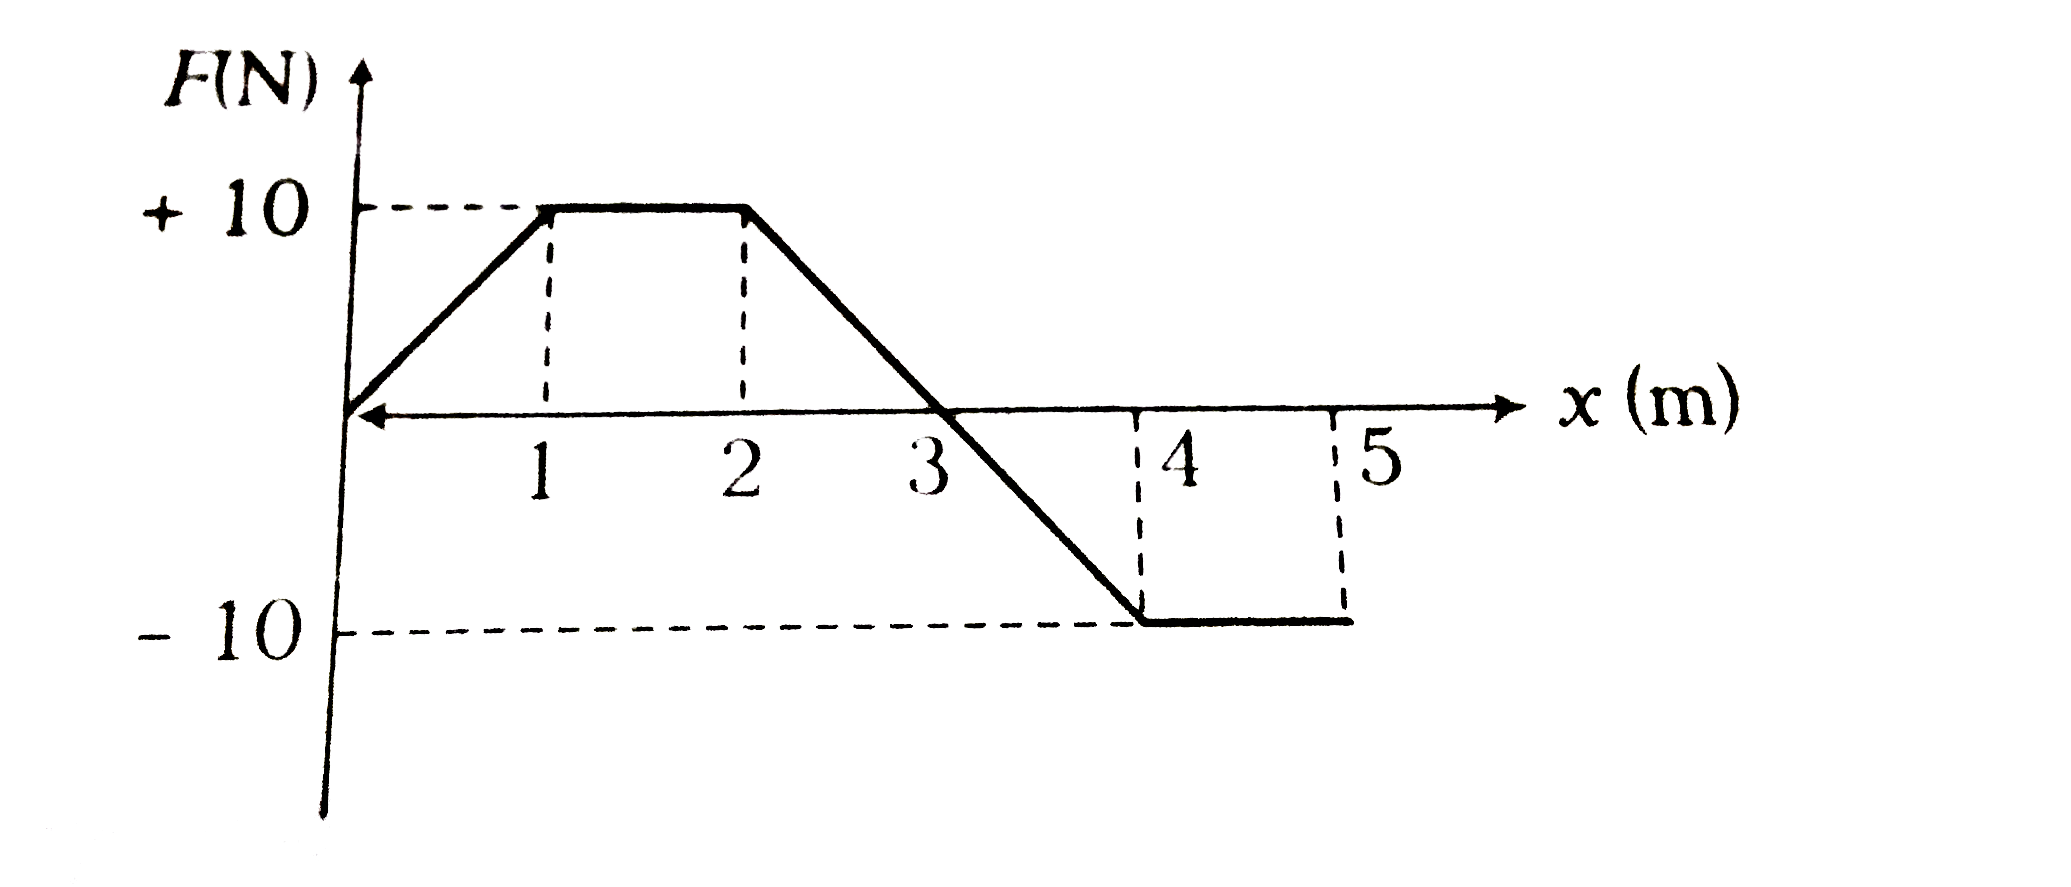 A35 JB25 JC15 JD5 J
 - Question 3 - Select One
The force acting on a body moving along x-axis varies with the position of the particle shown in the figure. The body is in stable equilibrium at
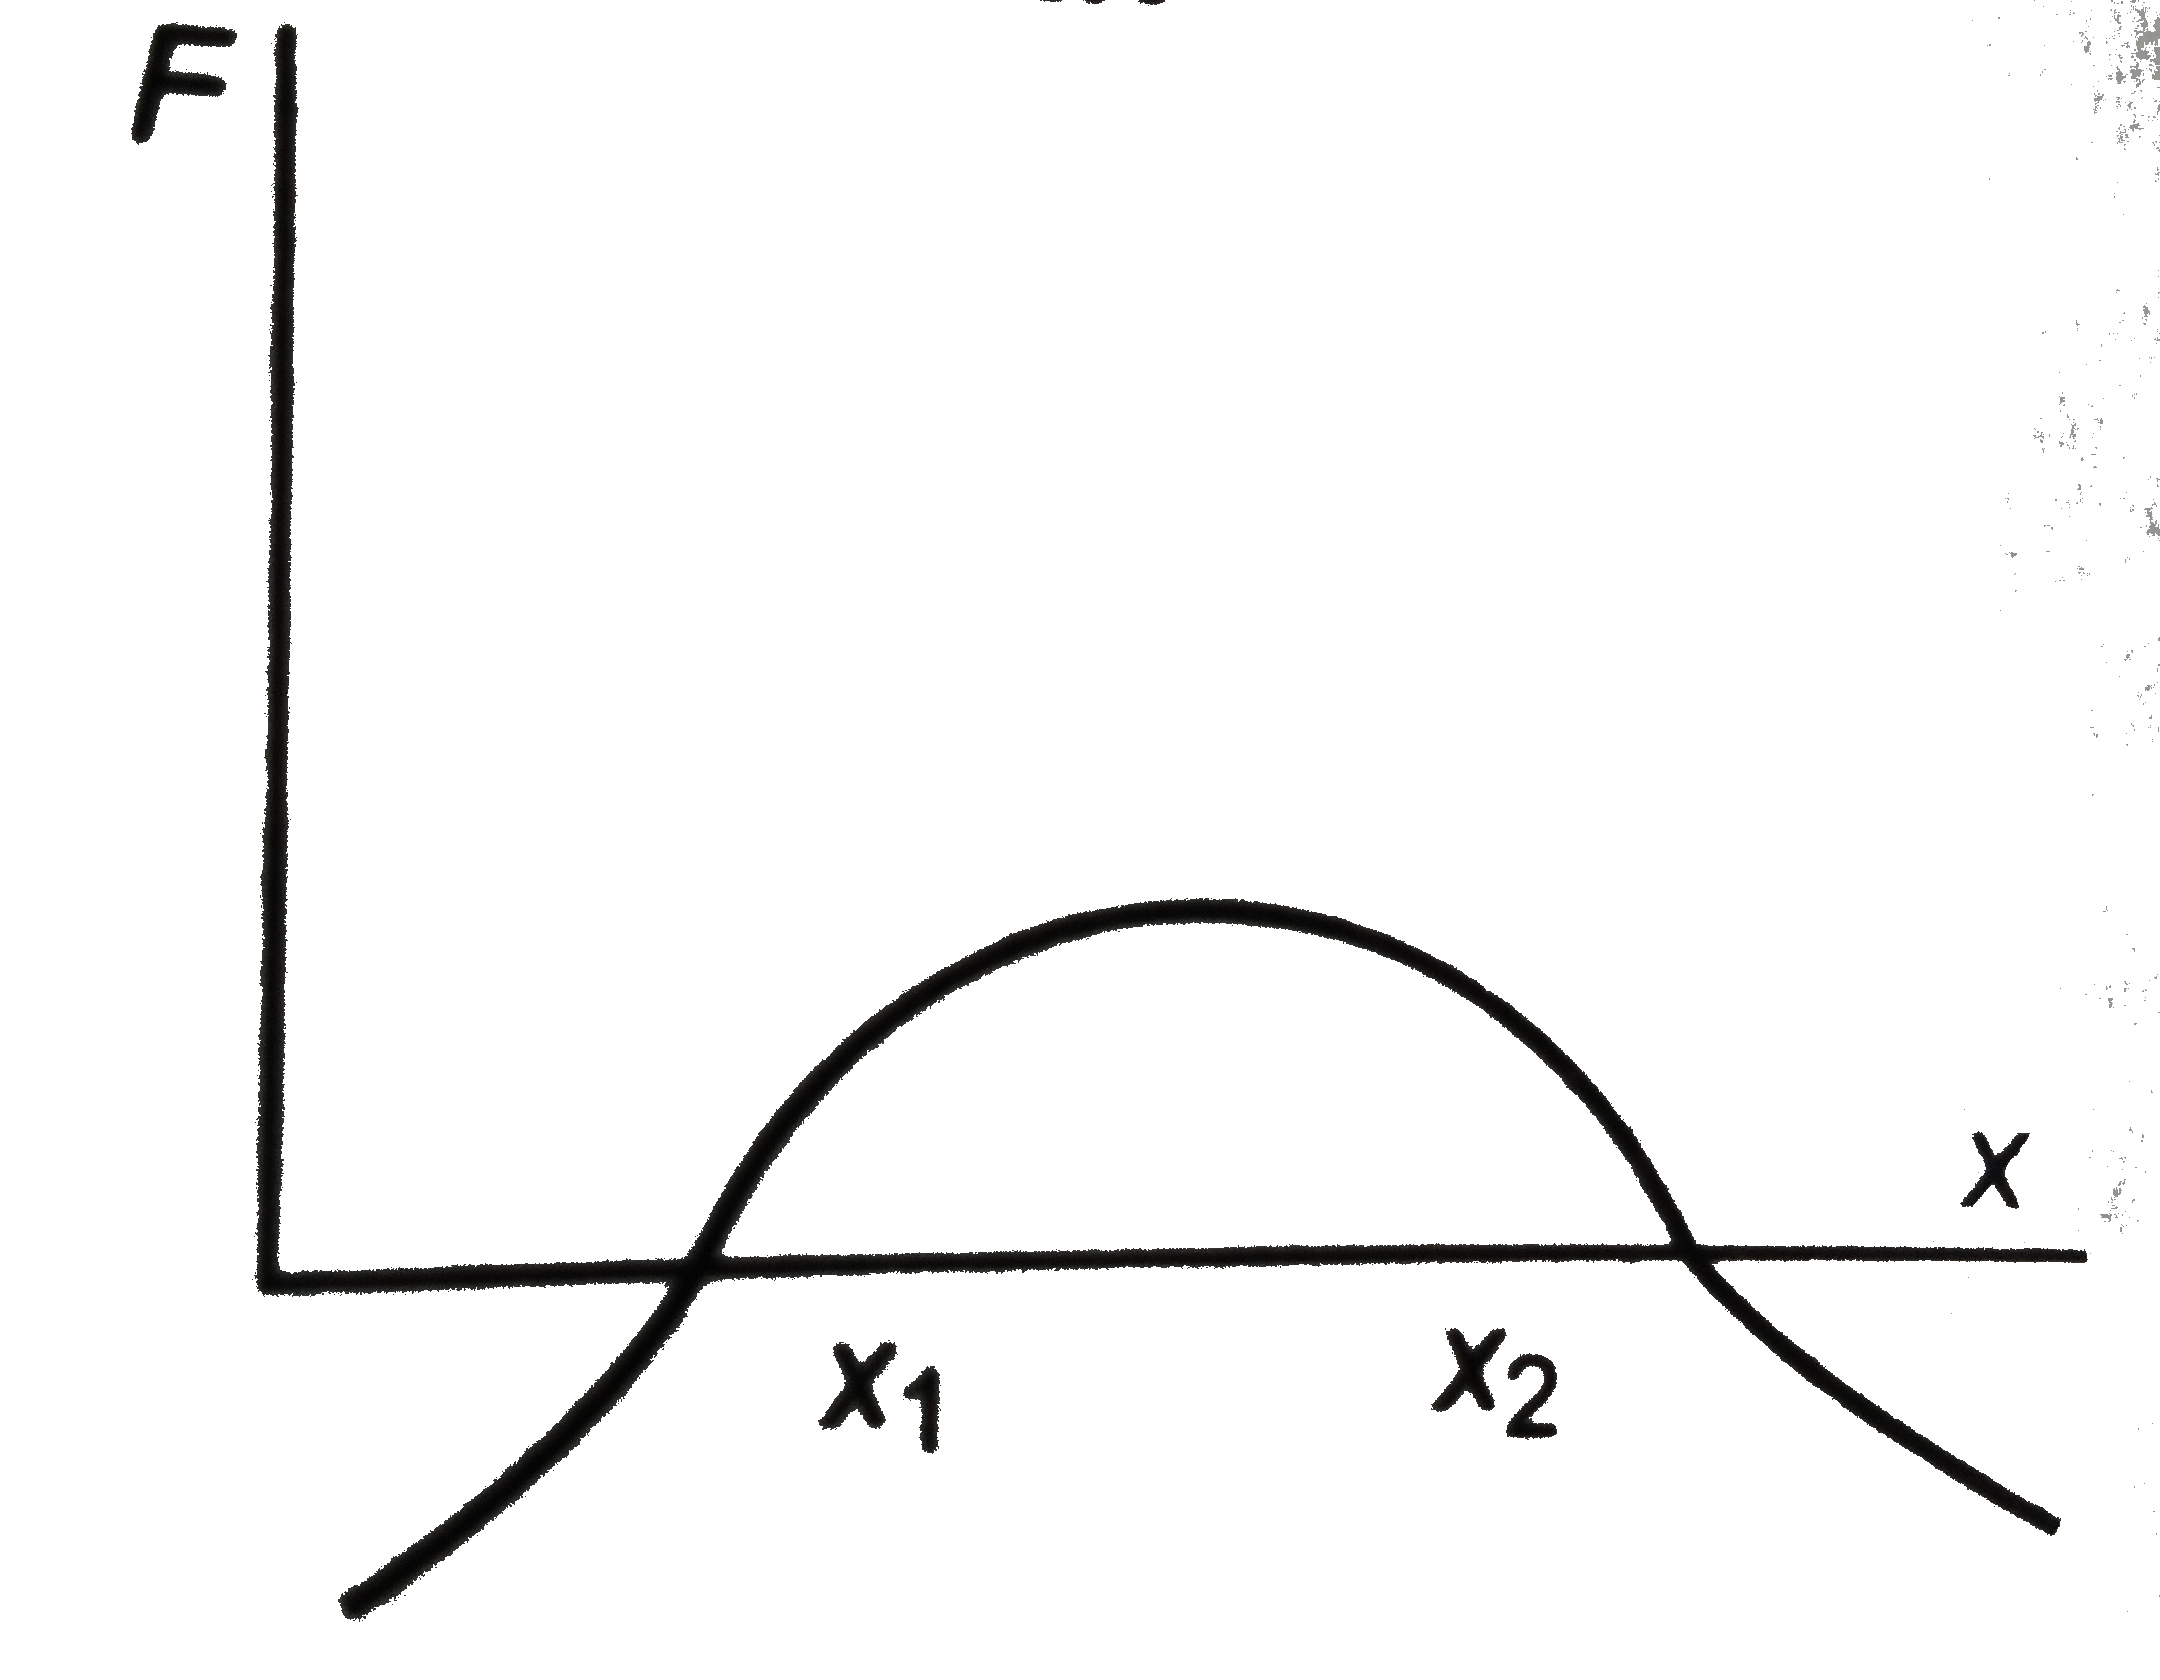 . Ax=x1Bx=x2Cboth x1 and x2Dneither x1 nor x2
A particle is constrained to move along x axis under the action of a conservative force. The potential energy of the particle varies with position x as shown in the figure. When the particle is at x = x0, it is given a kinetic energy (k) such that 0 lt k lt 4U0 (a) Does the particle ever reach the origin? (b) Qualitatively describe the motion of the particle
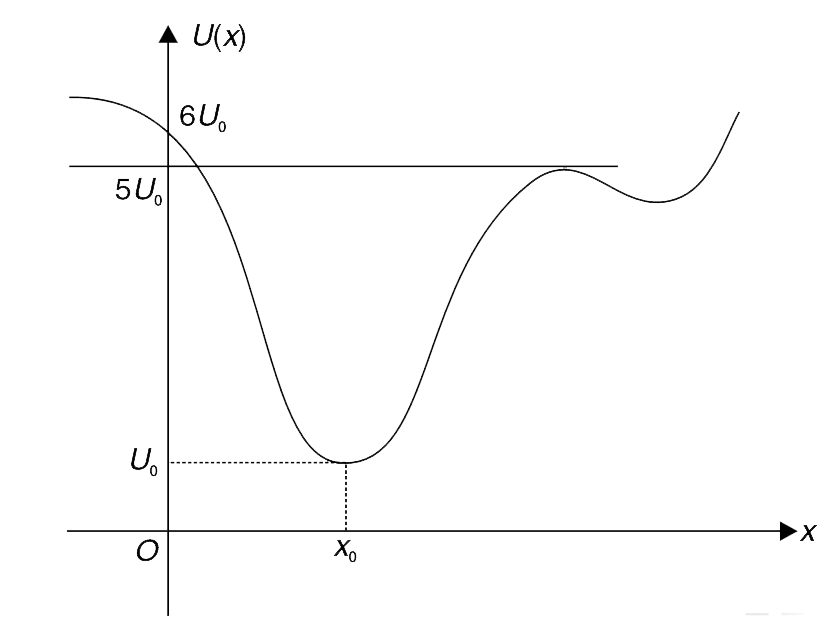 View Solution
A particle is moving along the x-axis and its position-time graph is shown. Determine the sign of acceleration.
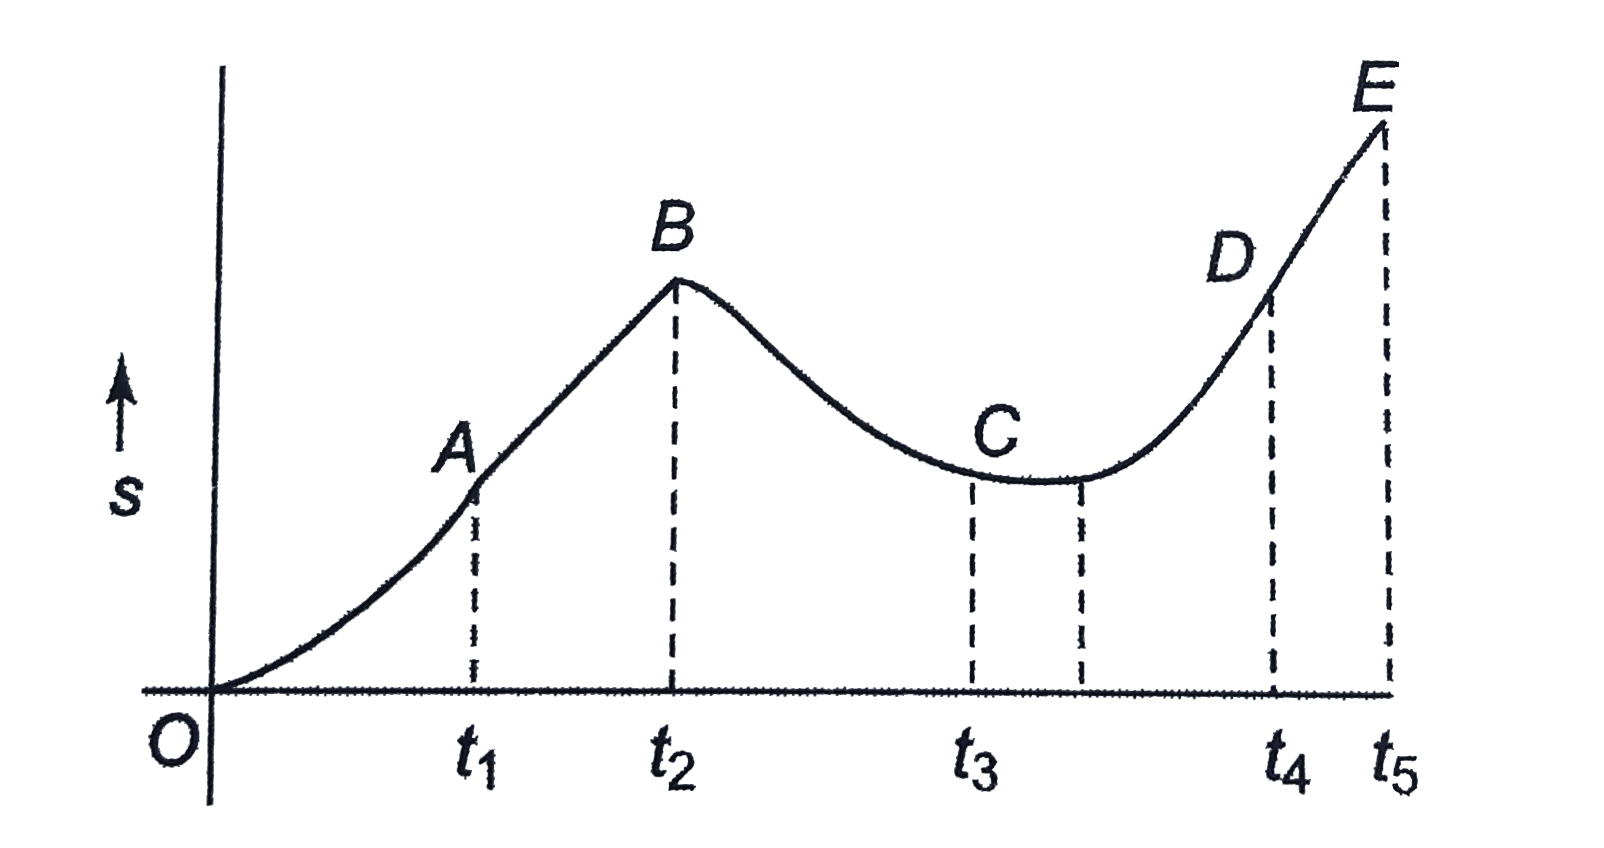 View Solution
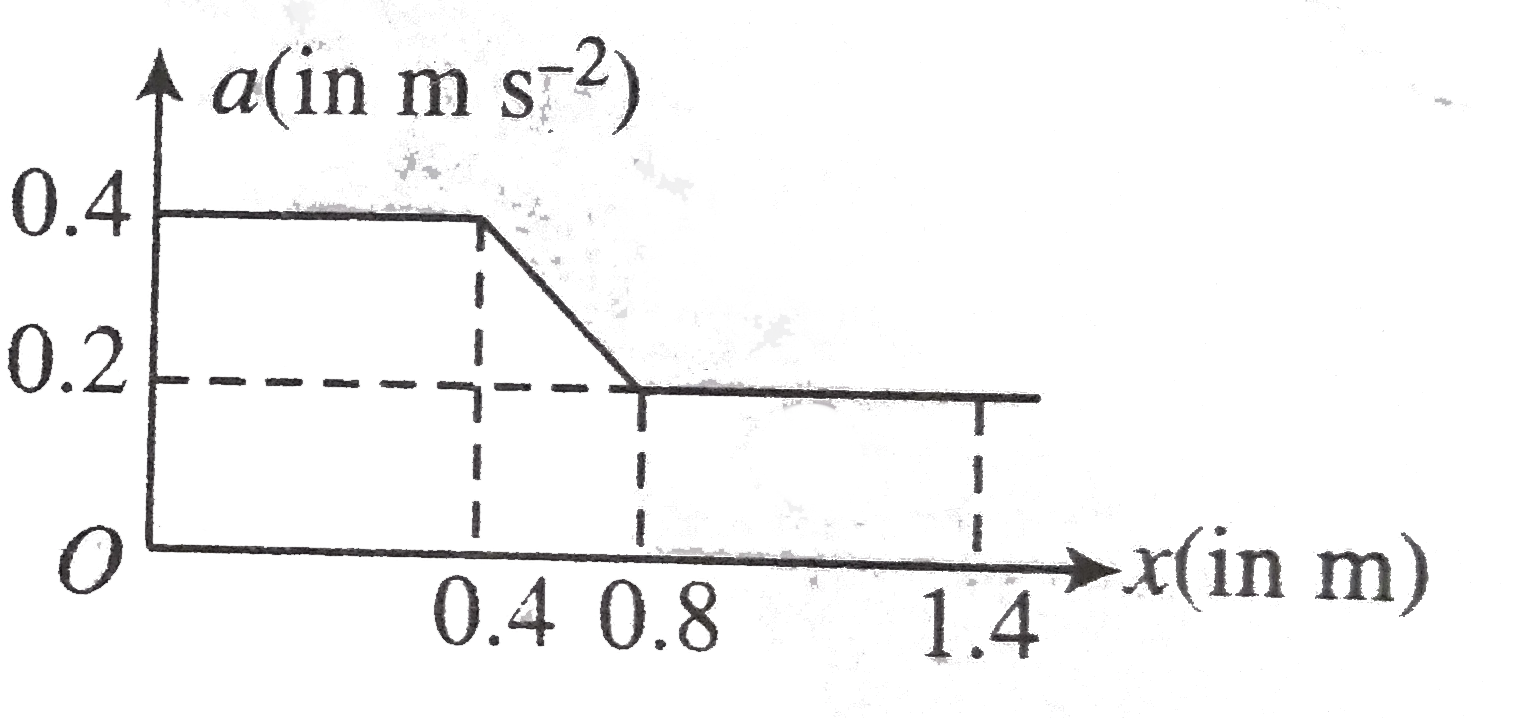
The acceleration of a particle which moves along the positive x-axis varies with its position as shown in figure. If the velocity of the particle is 0.8ms−1 at x = 0, then velocity of the particle at x=1.4m is (∈ms−1).
 View Solution
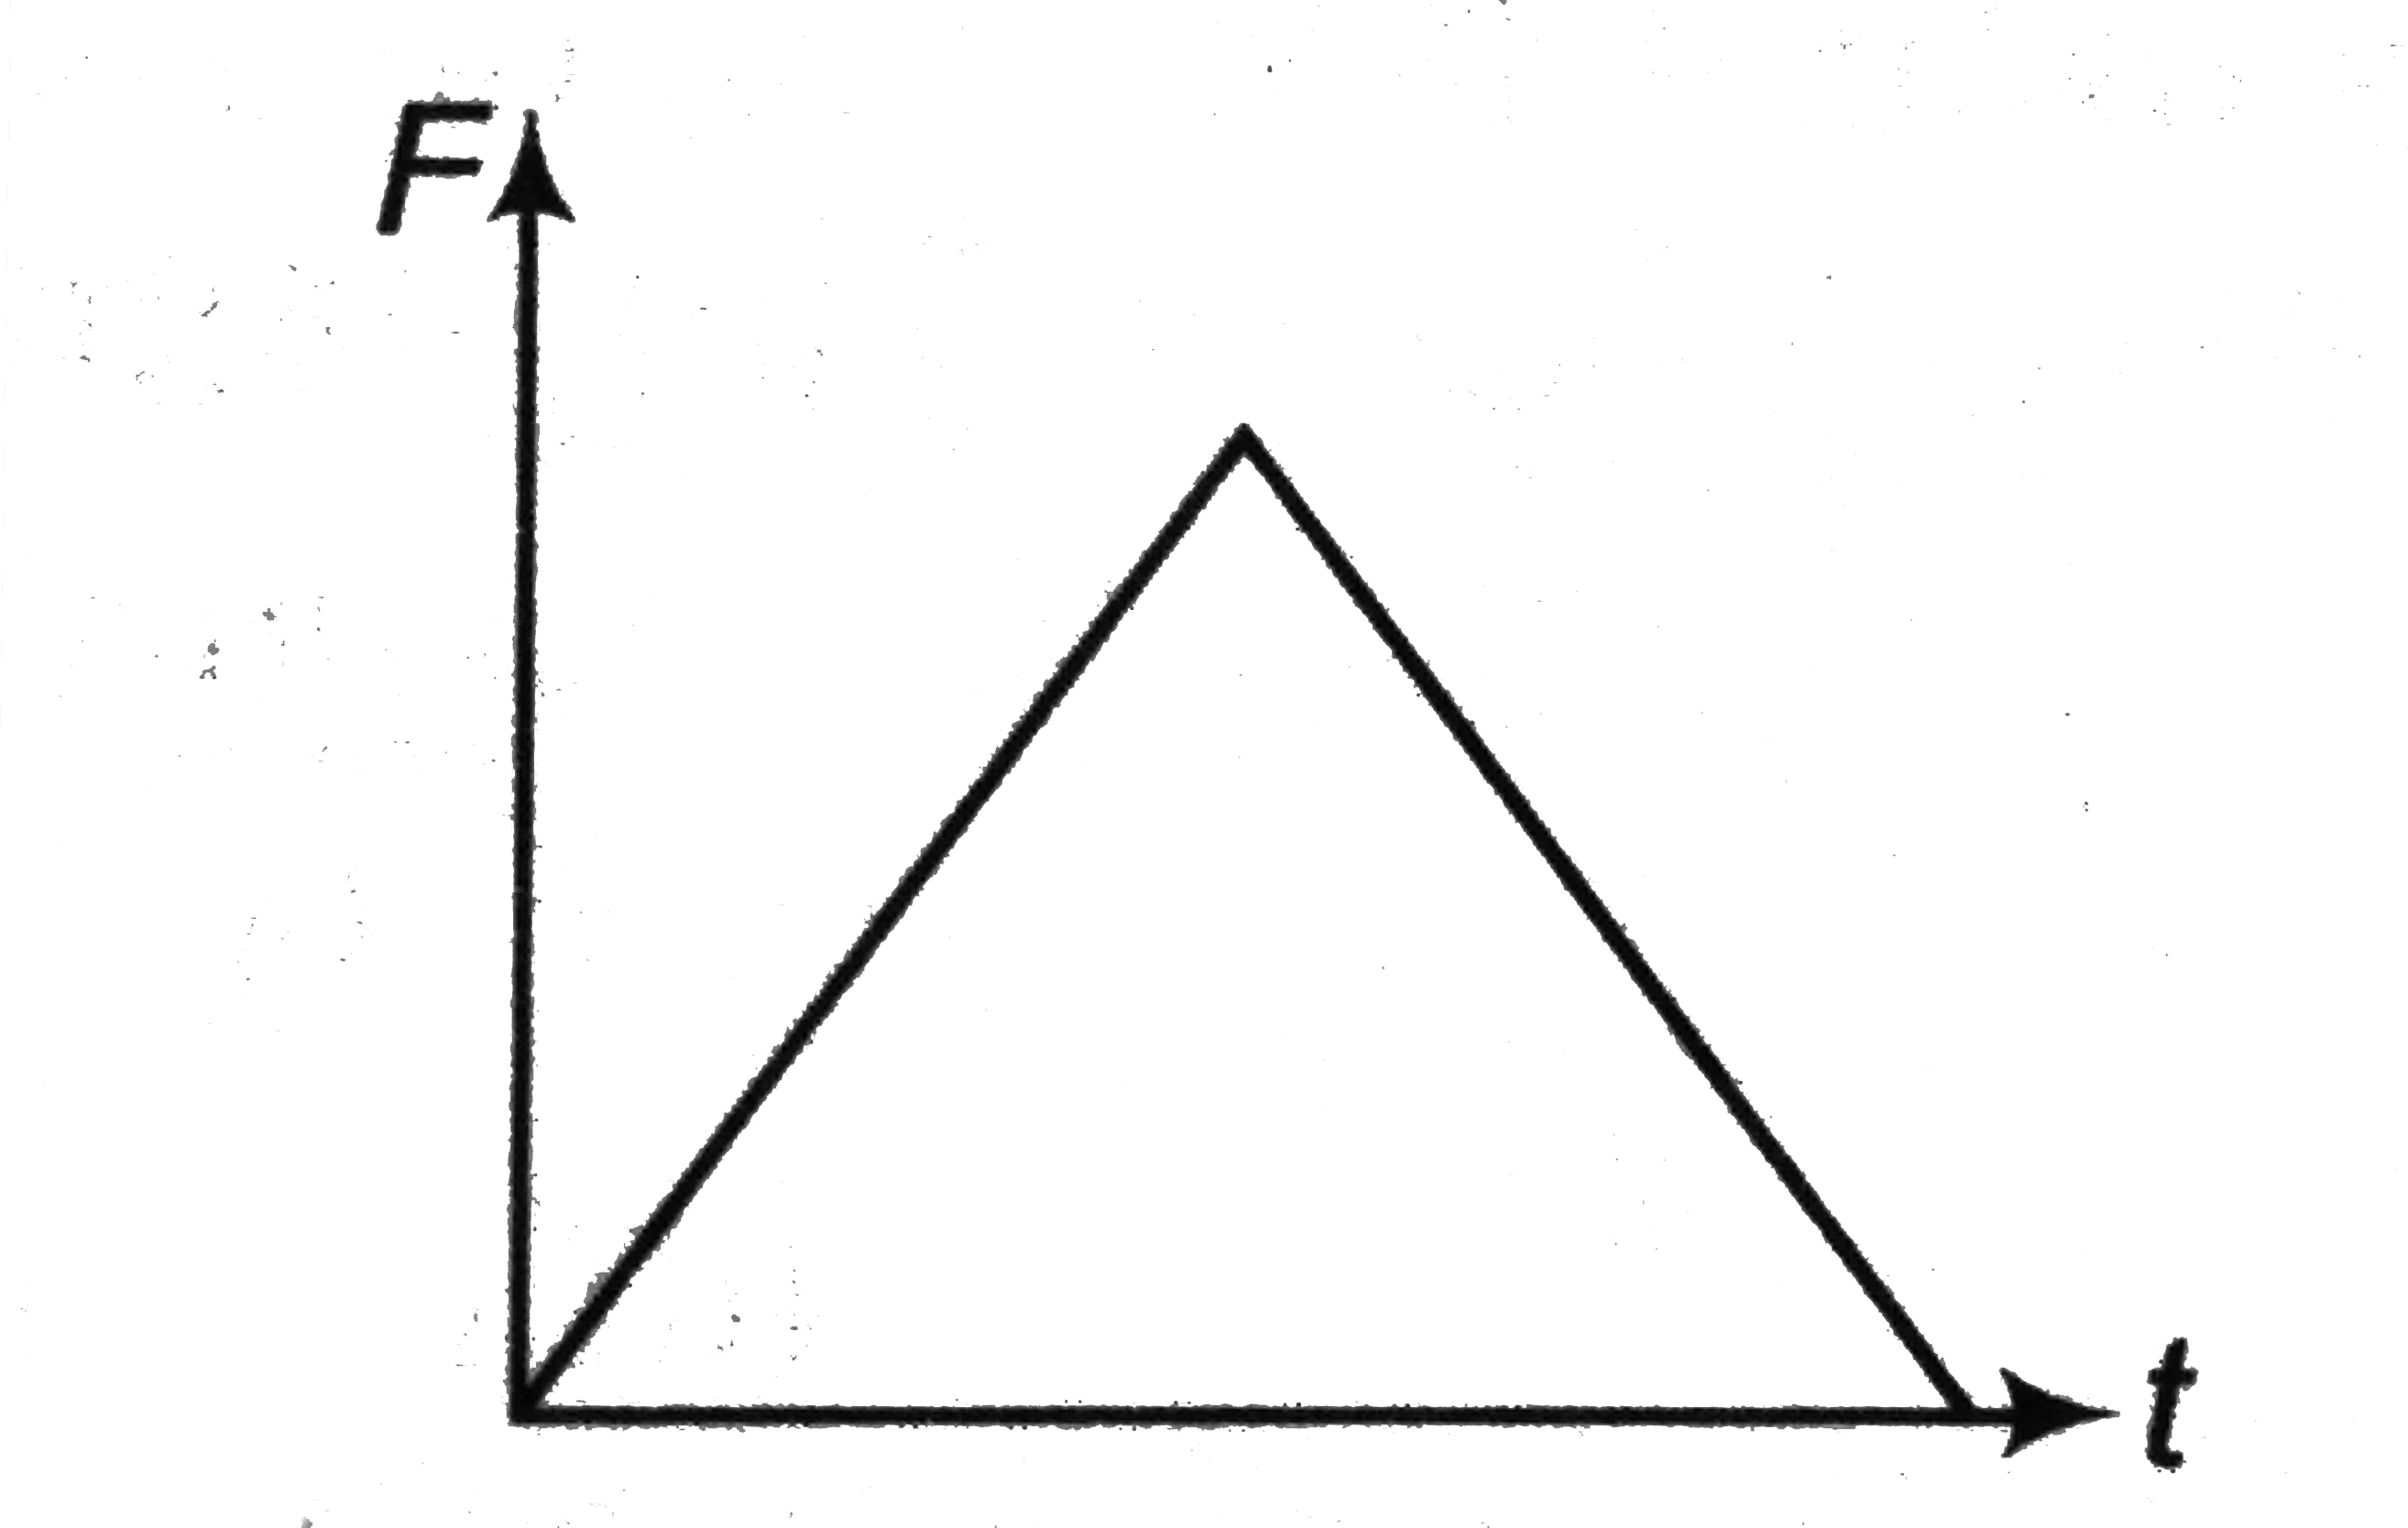
The net force acting on a particle moving along a straight line varies with time as shown in the diagram. Force is parallel to velocity. Which of the following graph is best representative of its speed with time? (Initial velocity of the particle is zero)
 View Solution
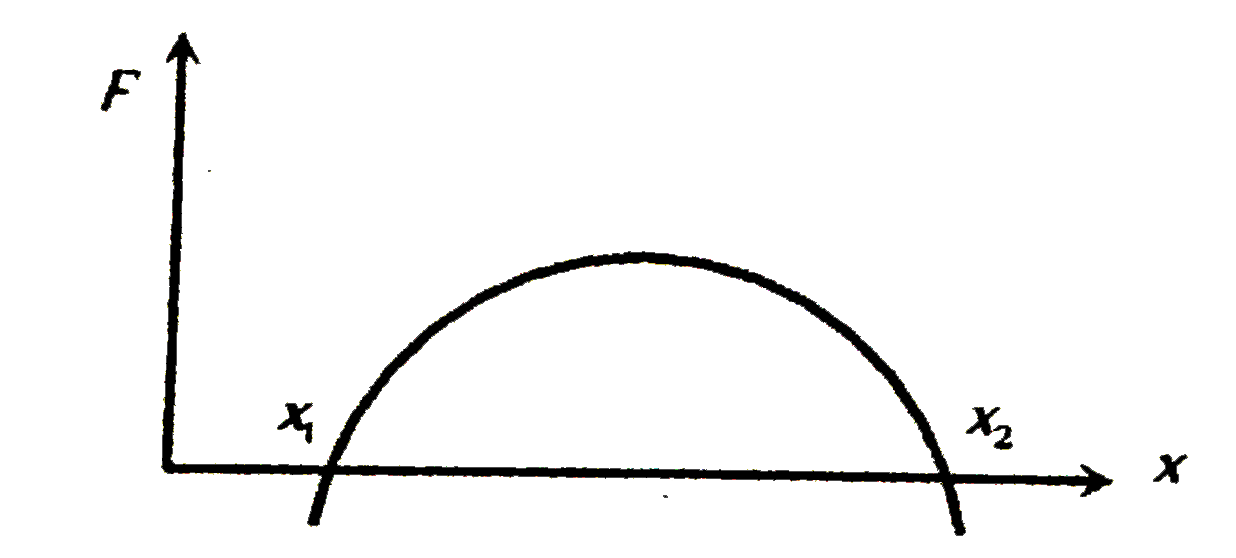
The force acting on a body moving along x -axis varies with the position of the particle as shown in the fig. The body is in stable equilibrium at.
 View Solution


 .
.