The graph between photo electric current and cathode potential when the anode is kept at zero potential, for light of two different intensities out of the same frequency looks like the one:
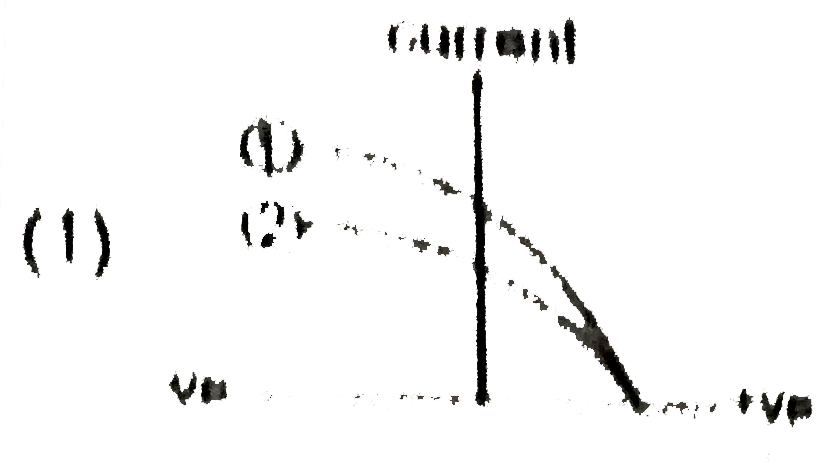
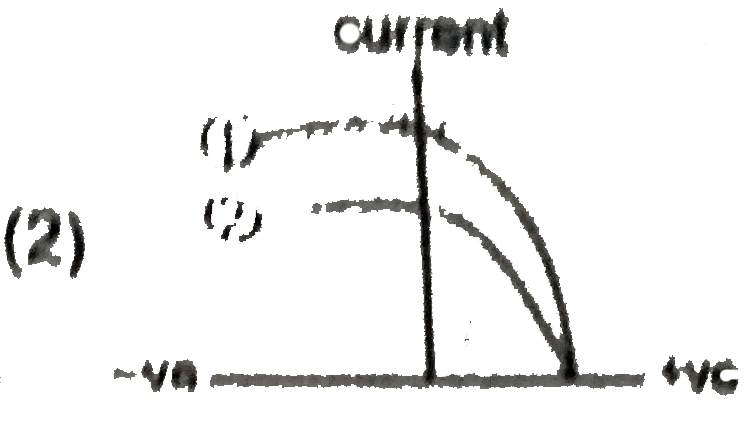
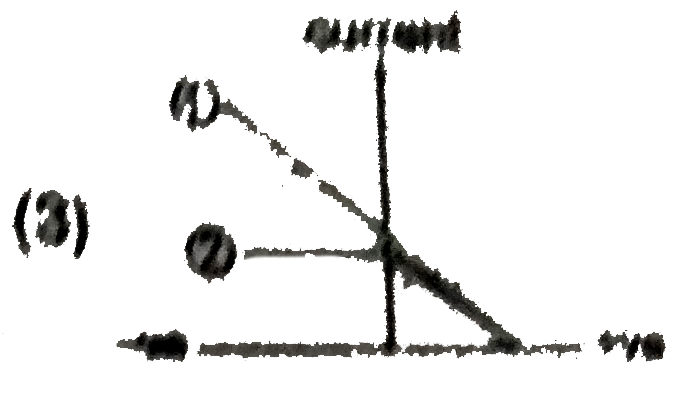
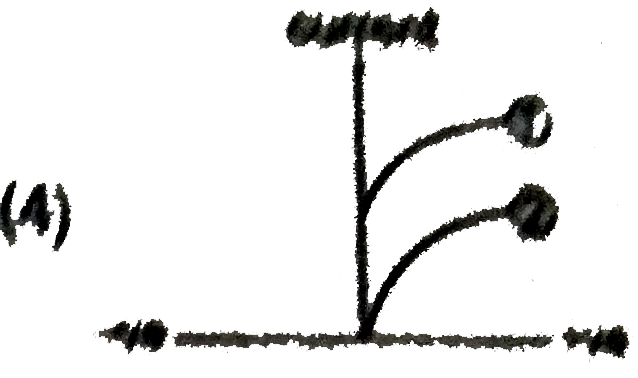
The correct Answer is:A
Step by step video, text & image solution for The graph between photo electric current and cathode potential when the anode is kept at zero potential, for light of two different intensities out of the same frequency looks like the one: by Physics experts to help you in doubts & scoring excellent marks in Class 11 exams.
Topper's Solved these Questions
Similar Questions
Plot a graph showing the variation of photoelectric current with anode potential for two light beam of same wavelength but different intensity.
View Solution(i) In a plot of photoelectric current versus anode potential, how does
(a) the saturation current vary with anode potential for incident radiations of different frequencies but same intensity ?
(b) The stopping potential vary for incident radiations of different intensities but same frequency ?
(c) photoelectric current vary for different intensities but same frequency of incident radiations ?
Justify your answer in each case.
(ii) The work function of caesium is 2.14 eV. find (a) the threshold frequency for caesium, and
(b) The wavelength of the incident light if the photocurrent is brought to zero by a stopping potential of 0.60 V.View Solution
Knowledge Check
- Question 1 - Select One
In the following figure the curves have been drawn between the photoelectric current and the potential difference applied at the cathode with respect to anode at four different intensities, the stopping potential is represent by
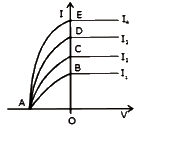 AOABOBCOCDOD
 - Question 2 - Select One
if the cathode and the anode are kept at the same potential, the emitted electrons have
Athe same KE equal to 1.36 eVBthe average KE equal to (1.362) eVCthe maximum KE equal to 1.36 eVDthe minimum KE equal to 1.36 eV - Question 3 - Select One
The curve between current (i) and potential difference (V) for a photo cell will be
A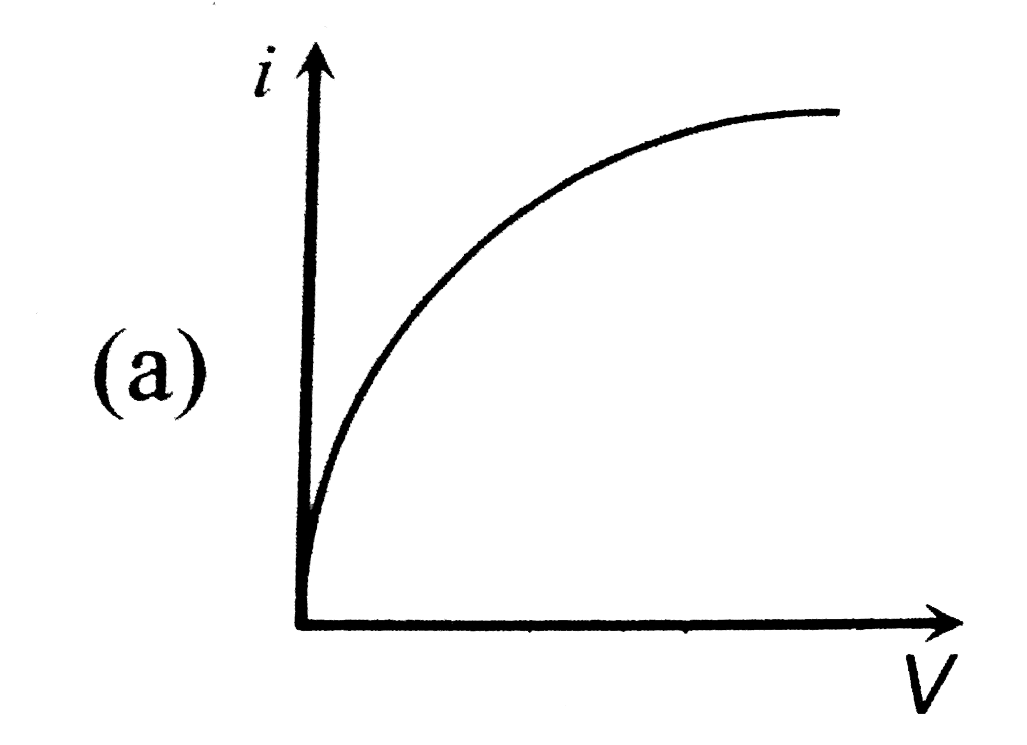 B
B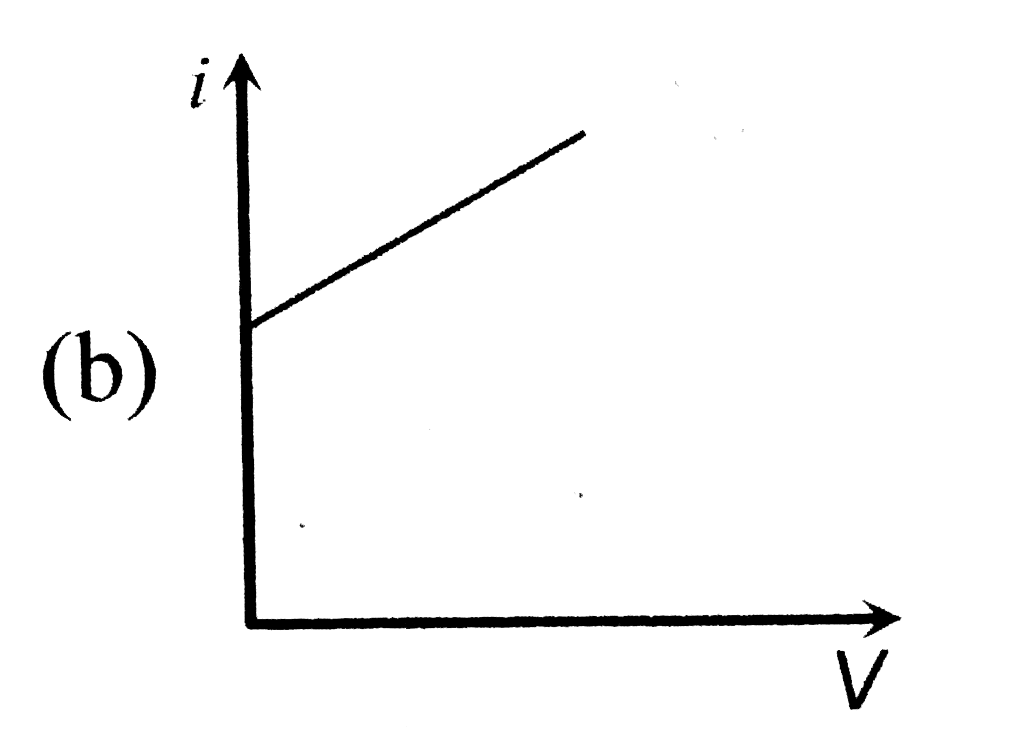 C
C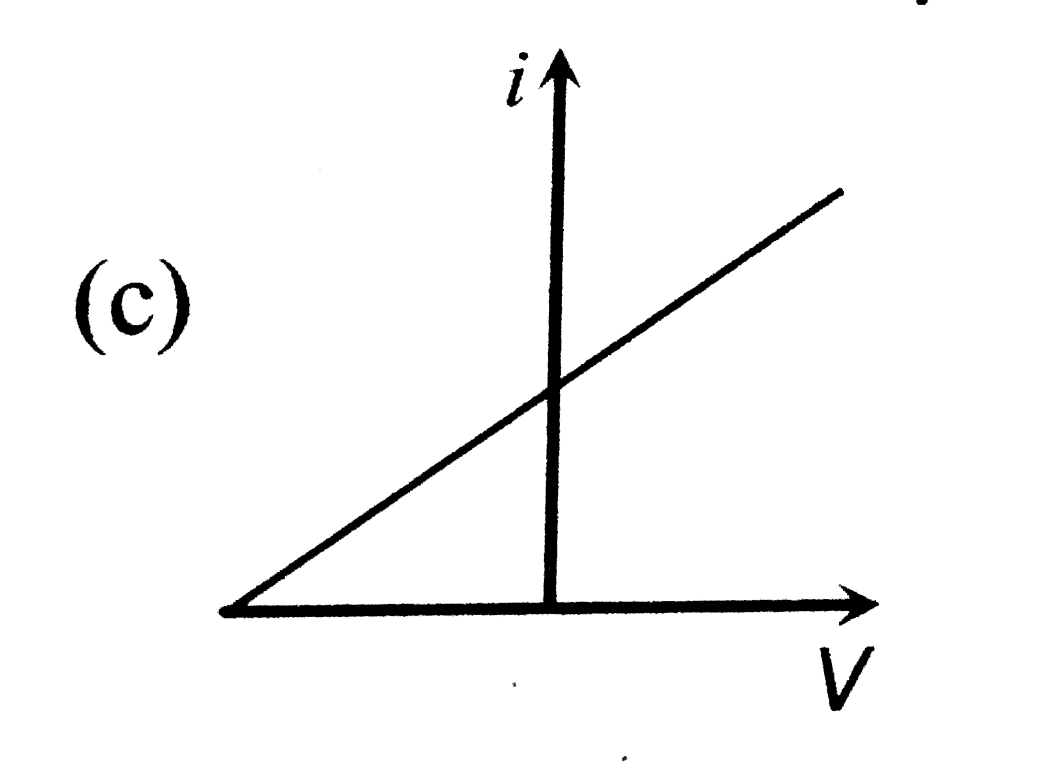 D
D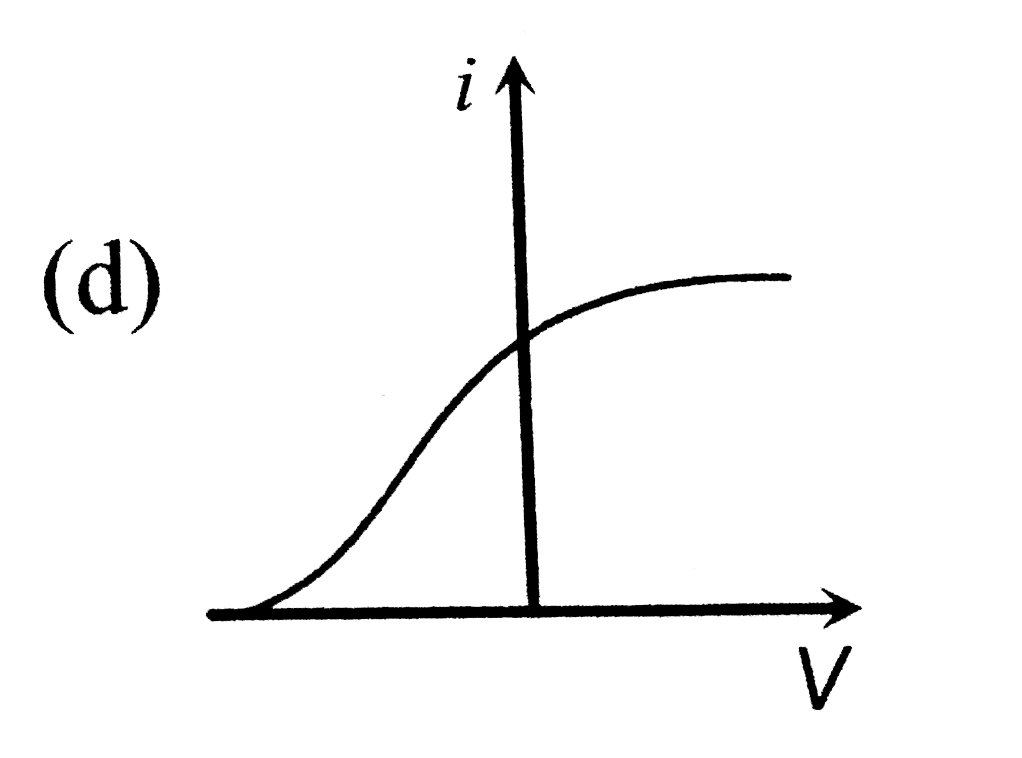
In a plot of photoelectric current versus anode potential, how does
(i) the saturation current vary with anode potential for incident radiations of different frequencies but same intensity?
(ii) the stopping potential vary for incident radiations of different intensities but the same frequency?
(iii) Photoelectric current vary of different intensities but same frequency of incident radiation? justify your answer is each case.View SolutionIn a plot of photoelectric current versus anode potential, how does
(i) the saturation current vary with anode potential for incident radiations of different frequencies but same intensity?
(ii) the stopping potential vary for incident radiations of different intensities but same frequency ?
(iii) Photoelectric current vary for different intensities but same frequency of incident radiations ?
Justify your answer in each case.View SolutionWhat is photoelectric effect? Explain experimentally the variation of photoelectric current with (i) the intensity of the incident light (ii) the potential difference between the plates and (iii) the frequency of the incident light and hence state the laws of photoelectric emission.
View SolutionIn photoelectric effect , the curve between photoelectric current and anode potential V (for different frequencies ) is shown in figure , then
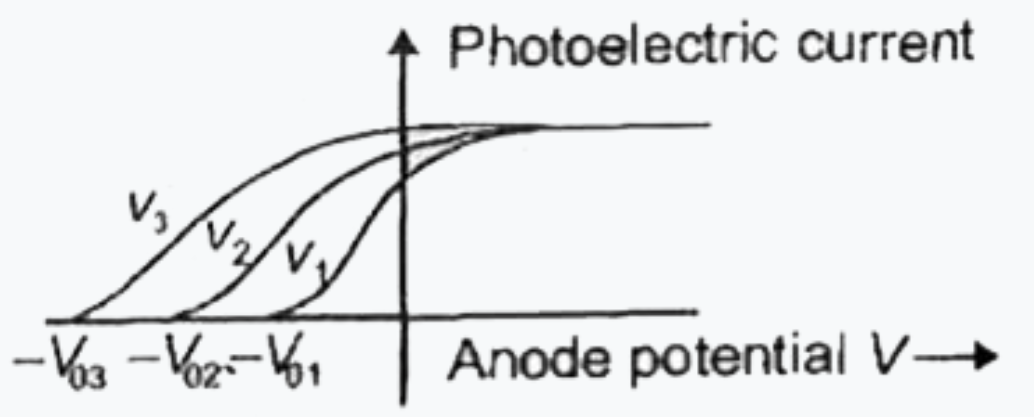 View Solution
From the following graph of photocurrent against collector plate potential, for two different intensities of light I1andI2 one can conclude.
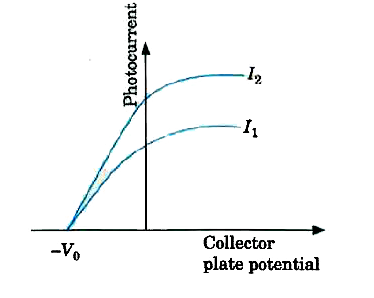 View Solution
