Using Einstein's photoelectric equation show how the cut -off voltage and threshold frequency for a given photosensitive material can be determined with the help of a suitable plot/graph.
When light of sufficiently small wavelength is incident on a metal surface, electrons are ejected from the metal. This phenomenon is called the photoelectric effcect.
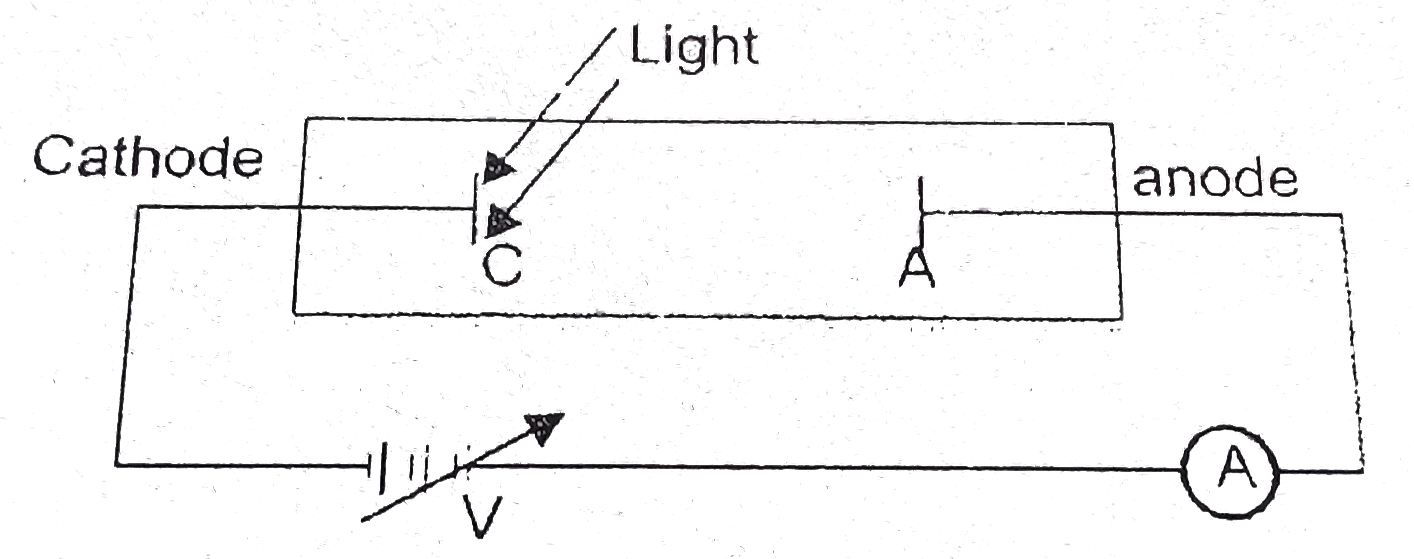
(i) The cathode is illminated with light of some fixed frequency v and fixed Intensity I1. A small photoelectric current is observed due to few electron that reach anode just because they have sufficiently large velocity of emision. If we made the potential of the anode negative with respect to cathode then the eelctrons emitted by cathode then the electorns emiited by cathode are repelled. Some electrons even go back to the cathode so that the current decreases. At a certain value of this negative potential, the current is completely stopped. Then least value of this anode potential which just stops the photocurrent is called cut off potential or stopping potential.
(ii) For a given material, there is a certain minimum frequency that if the incident has a frequency below this threshold, no photoeelctirc emiision will take place, how so ever intense the radiation may be falling.
(iii) According to Einstein's photoelectric equation, maximum K.E. is given as
K.Emax=hcλ−ϕ
Where λ is wavelength and v is corresponding frequency and ϕ is work function.
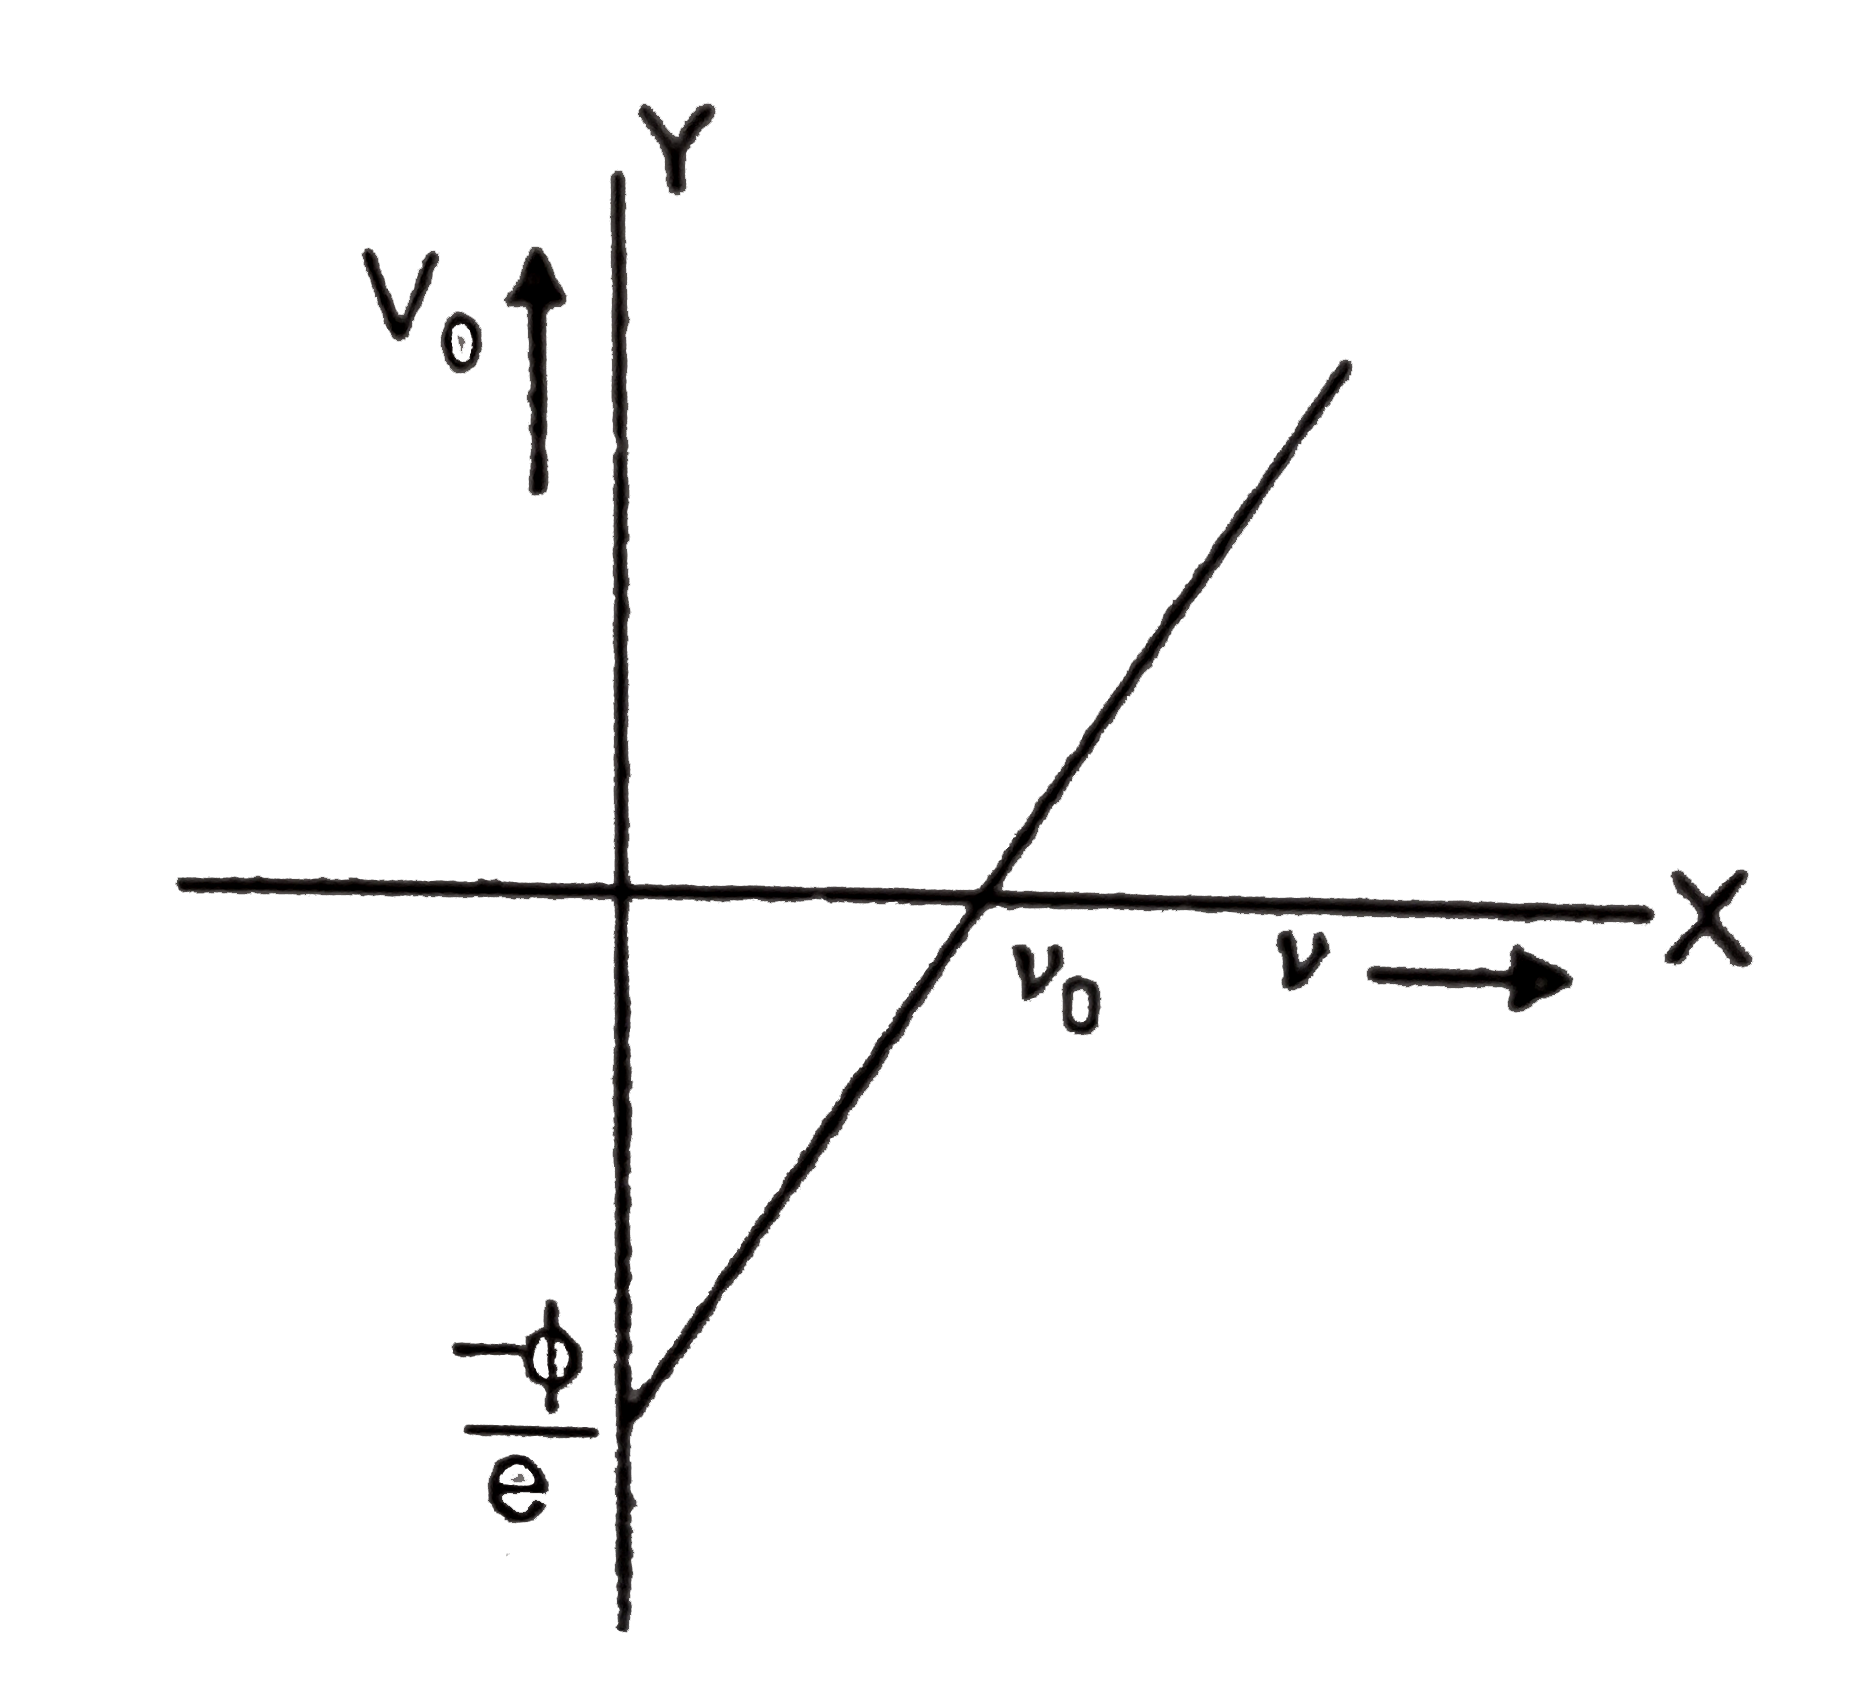
We expose a material to lights of various frequencies and thus photoelectric current is observed and cut off potential needed to reduce this curretn to Zero is noted. A graph is plotted and that is stright line. ltbgt At v0 the stopping potential is zero this means this frequency the incident light not able to eject electrons this is threshold frequency. Extended this line gives the cut off potential to make the phob current zero which is −ϕe
Topper's Solved these Questions
- BOOK - RESONANCECHAPTER - ATOMIC PHYSICSEXERCISE - Advanved level problems17videos
ATOMIC PHYSICS
- BOOK - RESONANCECHAPTER - ATOMIC PHYSICSEXERCISE - Exercise-2 Part-III : Comprehension12videos
ATOMIC PHYSICS
- BOOK - RESONANCECHAPTER - ALTERNATING CURRENTEXERCISE - HIGH LEVEL PROBLEMS11videos
ALTERNATING CURRENT
- BOOK - RESONANCECHAPTER - CAPACITANCEEXERCISE - High Level Problems16videos
CAPACITANCE
Similar Questions
Using Einstein's photoelectric equation show how the cut -off voltage and threshold frequency for a given photosenstive material can be determined with the help of a suitable plot/graph.
View Solution(a) Write Einstein's photoelectric equation and mention which important features in photo-electric effect can be explained with the help of this equation.
(b) The maximum kinetic energy of the photoelectrons gets doubled when the wavelength of light incident on the surface changes from λ1 to λ2. Derive the expressions for the threshold wavelength λ0 and work function fo rthe metal surface.View Solution
Knowledge Check
- Question 1 - Select One
For a photoelectric cell the graph showing the variation of cut of voltage (V) with frequency (v) of incident light is best represented by
A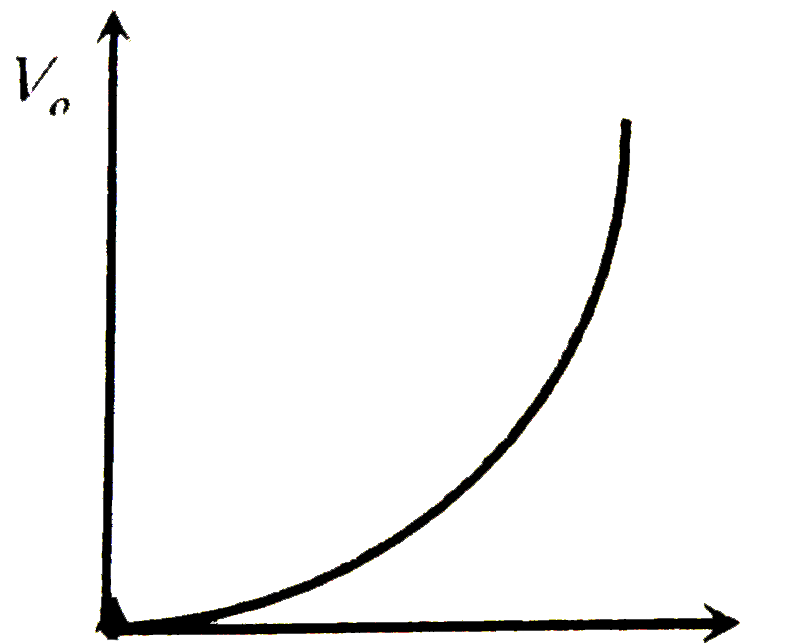 B
B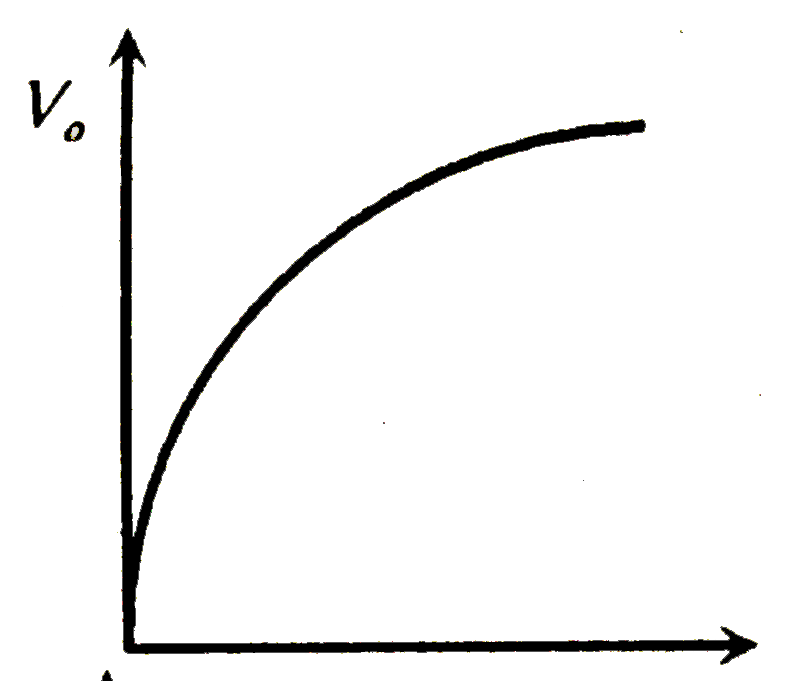 C
C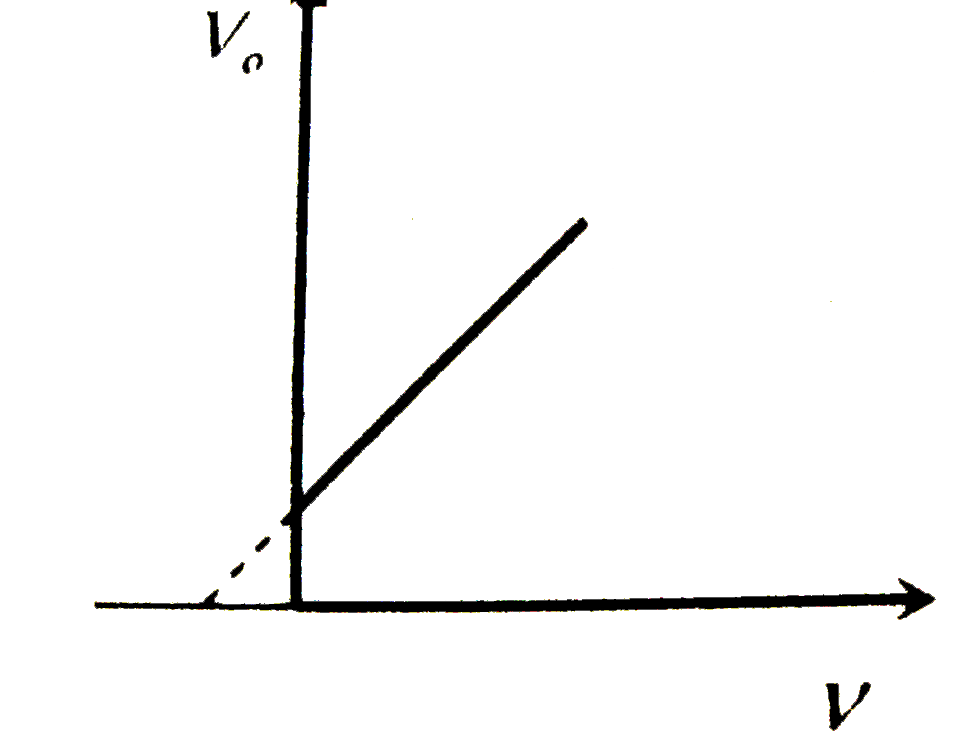 D
D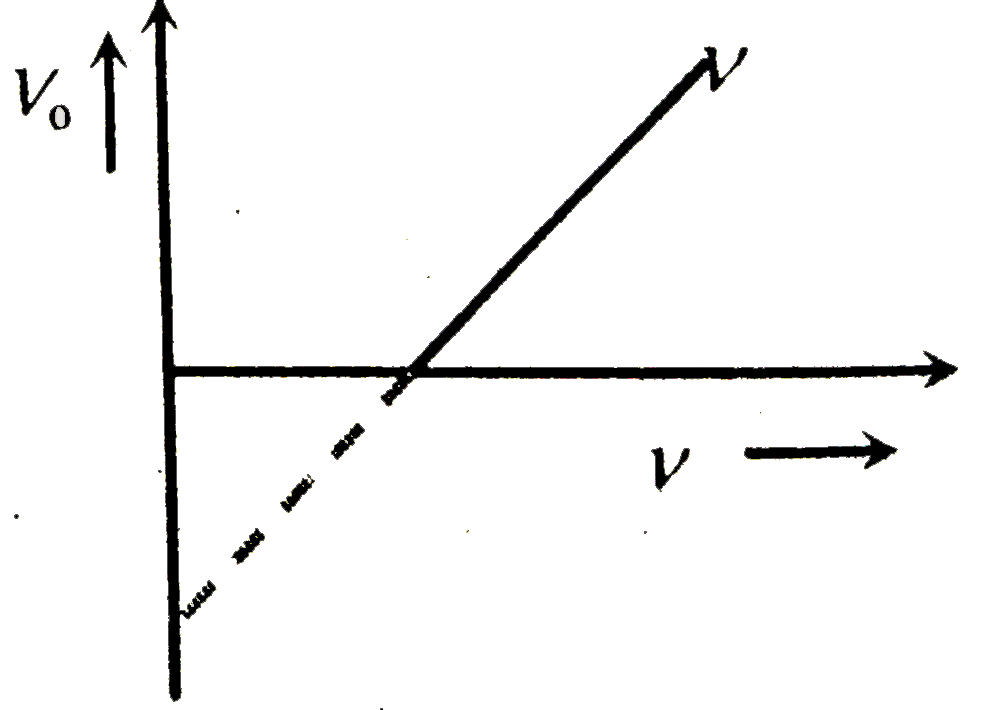
- Question 2 - Select One
For a photoelectric cell, the graph shown the variation of cut off voltage (V0) with frequency (v) of incident light is
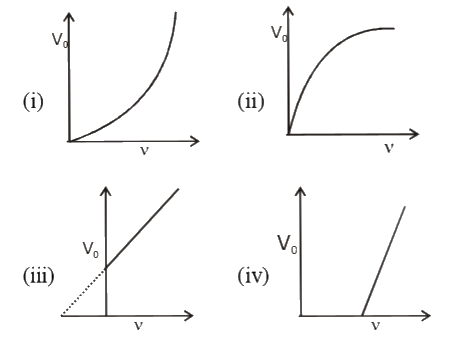 A(i)B(ii)C(iii)D(iv)
 - Question 3 - Select One
For a photoelectric cell the graph showing the variation of cut of voltage (V0) with frequency (v) of incident light is best represented by
 A
A B
B C
C D
D
Plot a graph showing variation of stopping potential (V0) with the frequency (v) of the incident radiation for a given photosensitive material. Hence, state the significance of the threshold frequency in photoelectric emission.
Using the principle of energy conservation, write the equation relating the energy of incident photon, threshold frequency and the maximum kinetic energy of the emitted photoelectrons.View Solution(a) Write Einstein's photoelectric equation. State clearly how this equation is obtained using the photon picture of electromagnetic radiation.
(b) Write the three salient features observed in photoelectric effect which can be explained using this equation.View SolutionFor photoelectric effect in sodium, fig. shows the plot of cut-off voltage versus frequency of the incident radiation. Caclculate:
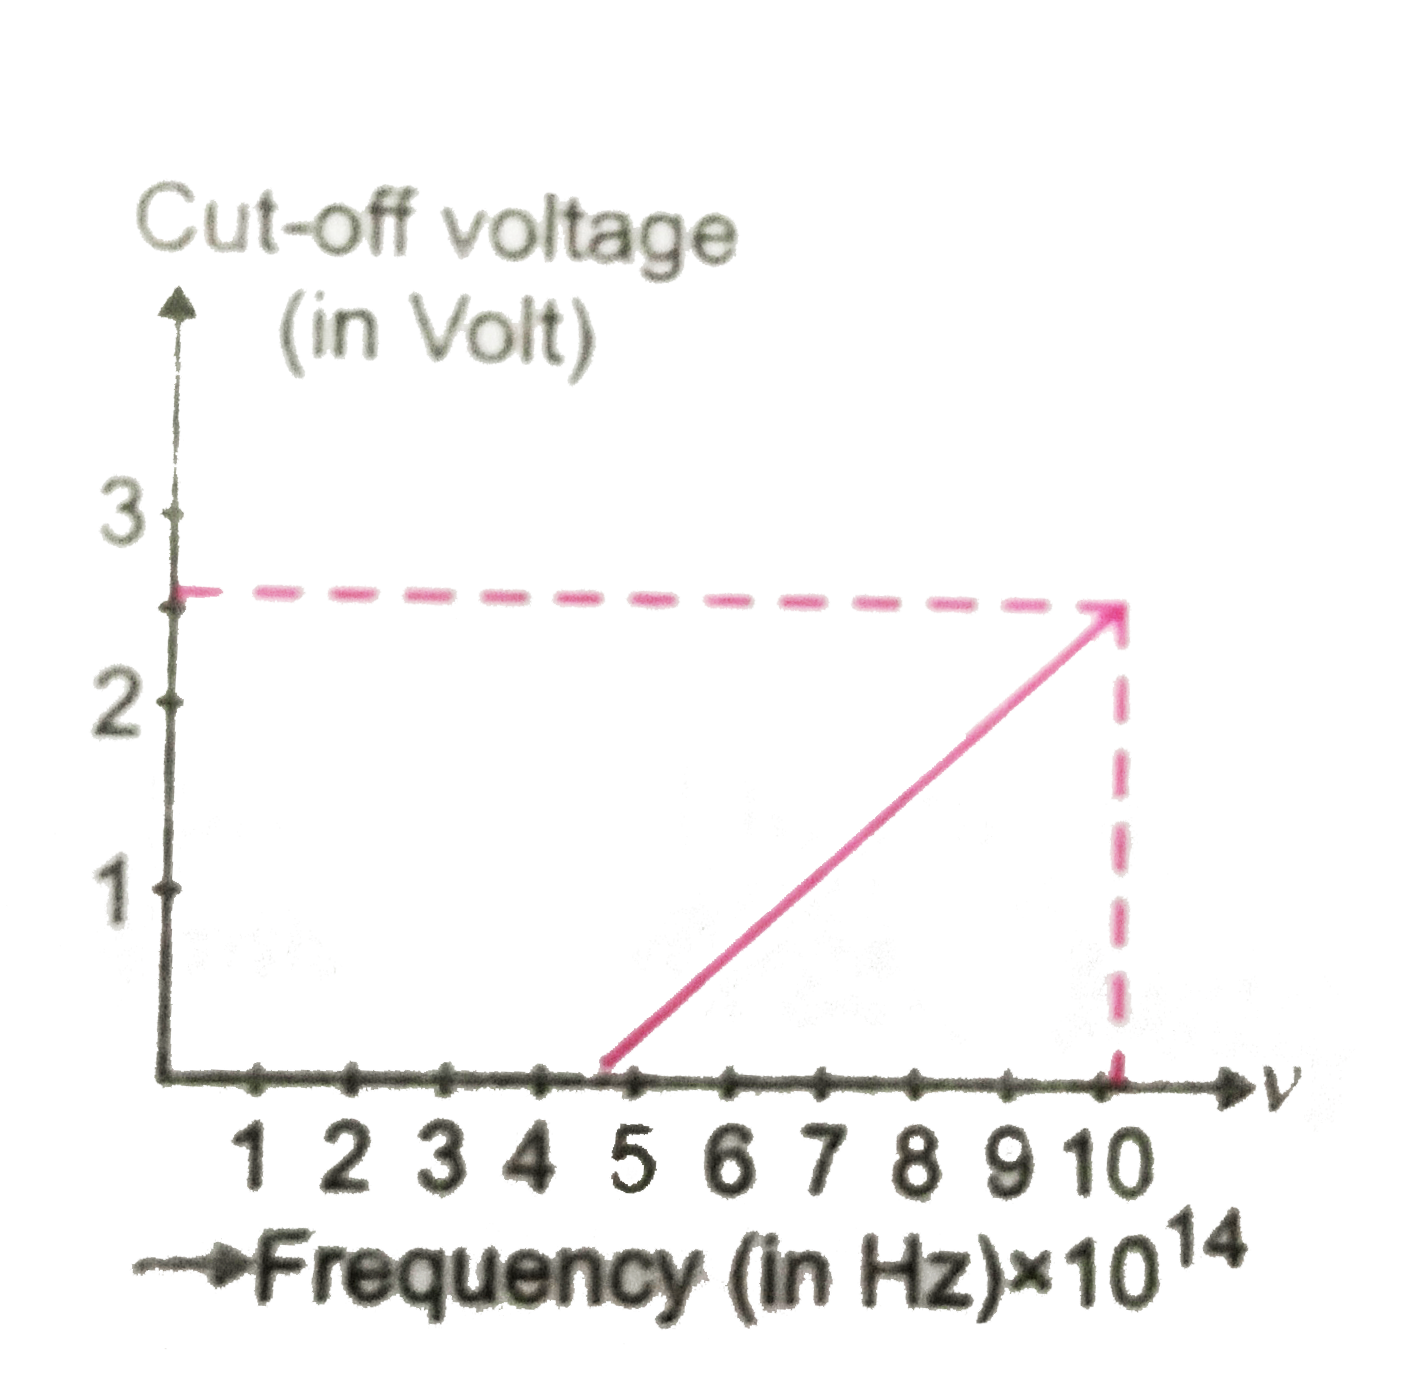
(i) the threshold frequency
(ii) the work function for sodium. (Use h=6.6×10⁻³⁴Js)View SolutionWhat is photoelectric effect? Give any two practical applications of this effect. Write Einstein's photoelectric equation and use it to explain (i) independence of maximum energy of the emitted photoelectrons from intensity of incident light (ii) existence of a threshold frequency of the emitted photoelectrons from intensity of incident light.
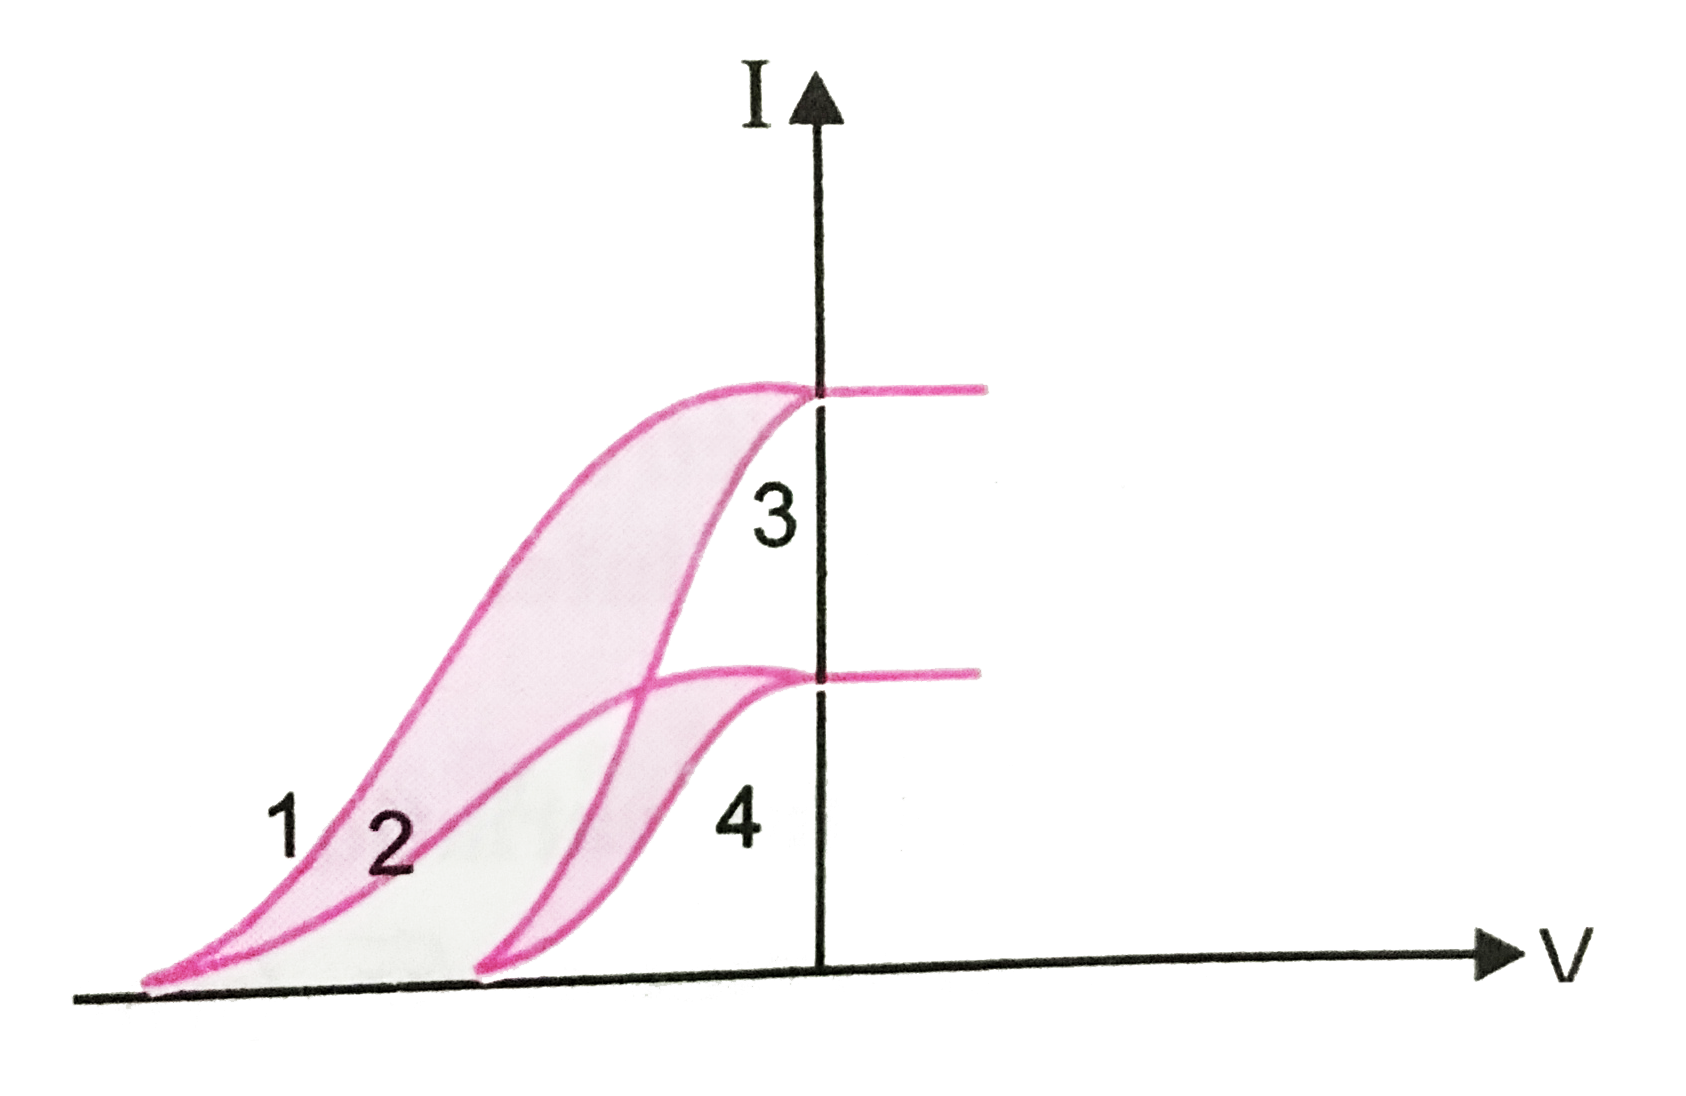
View SolutionThe graph of Fig. shows the variation of photoelectric current (I) versus applied voltage (V) for the two different photosensitive materials for two different intensities of the incident radiation. Identify the pairs of curves that correspond to different materials but same intensity of incident radiation.
 View Solution

