The figure below shows a graph of potential energy U(s) verses position x for a particle executing on edimensional motion along the x axis. The total mechanical energy of the system is indicated by the dashed line. At t=0 the particle is somewhere between points A and G. For later times choose the correct statement:-
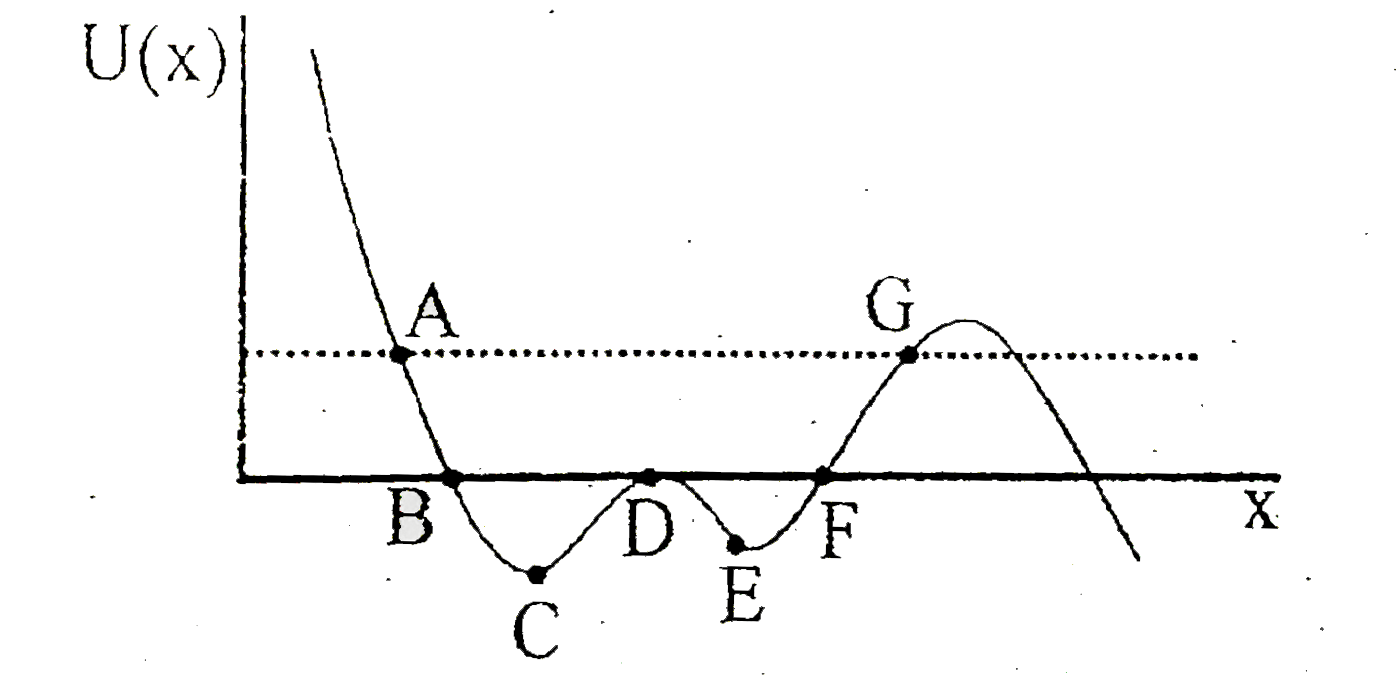
The magnitude of force is maximum at D
The kinetic energy is maximum at B
The velocity is zero at A & G
The magnitude of force is minimum at F
The correct Answer is:C
F=dUdx and K+U=E
Topper's Solved these Questions
- BOOK - ALLENCHAPTER - TEST PAPERSEXERCISE - PAPER 260videos
TEST PAPERS
- BOOK - ALLENCHAPTER - TEST PAPERSEXERCISE - PAPER 3100videos
TEST PAPERS
- BOOK - ALLENCHAPTER - TEST PAPER 4EXERCISE - PHYSICS45videos
TEST PAPER 4
- BOOK - ALLENCHAPTER - UNIT & DIMENSIONS, BASIC MATHS AND VECTOR EXERCISE - Exercise (J-A)7videos
UNIT & DIMENSIONS, BASIC MATHS AND VECTOR
Similar Questions
The potential energy of 1kg particle free to move along x-axis is given by U(x)=[x^4/4-x^2/2]J. The total mechanical energy of the particle is 2J. The maximum speed of the particle is
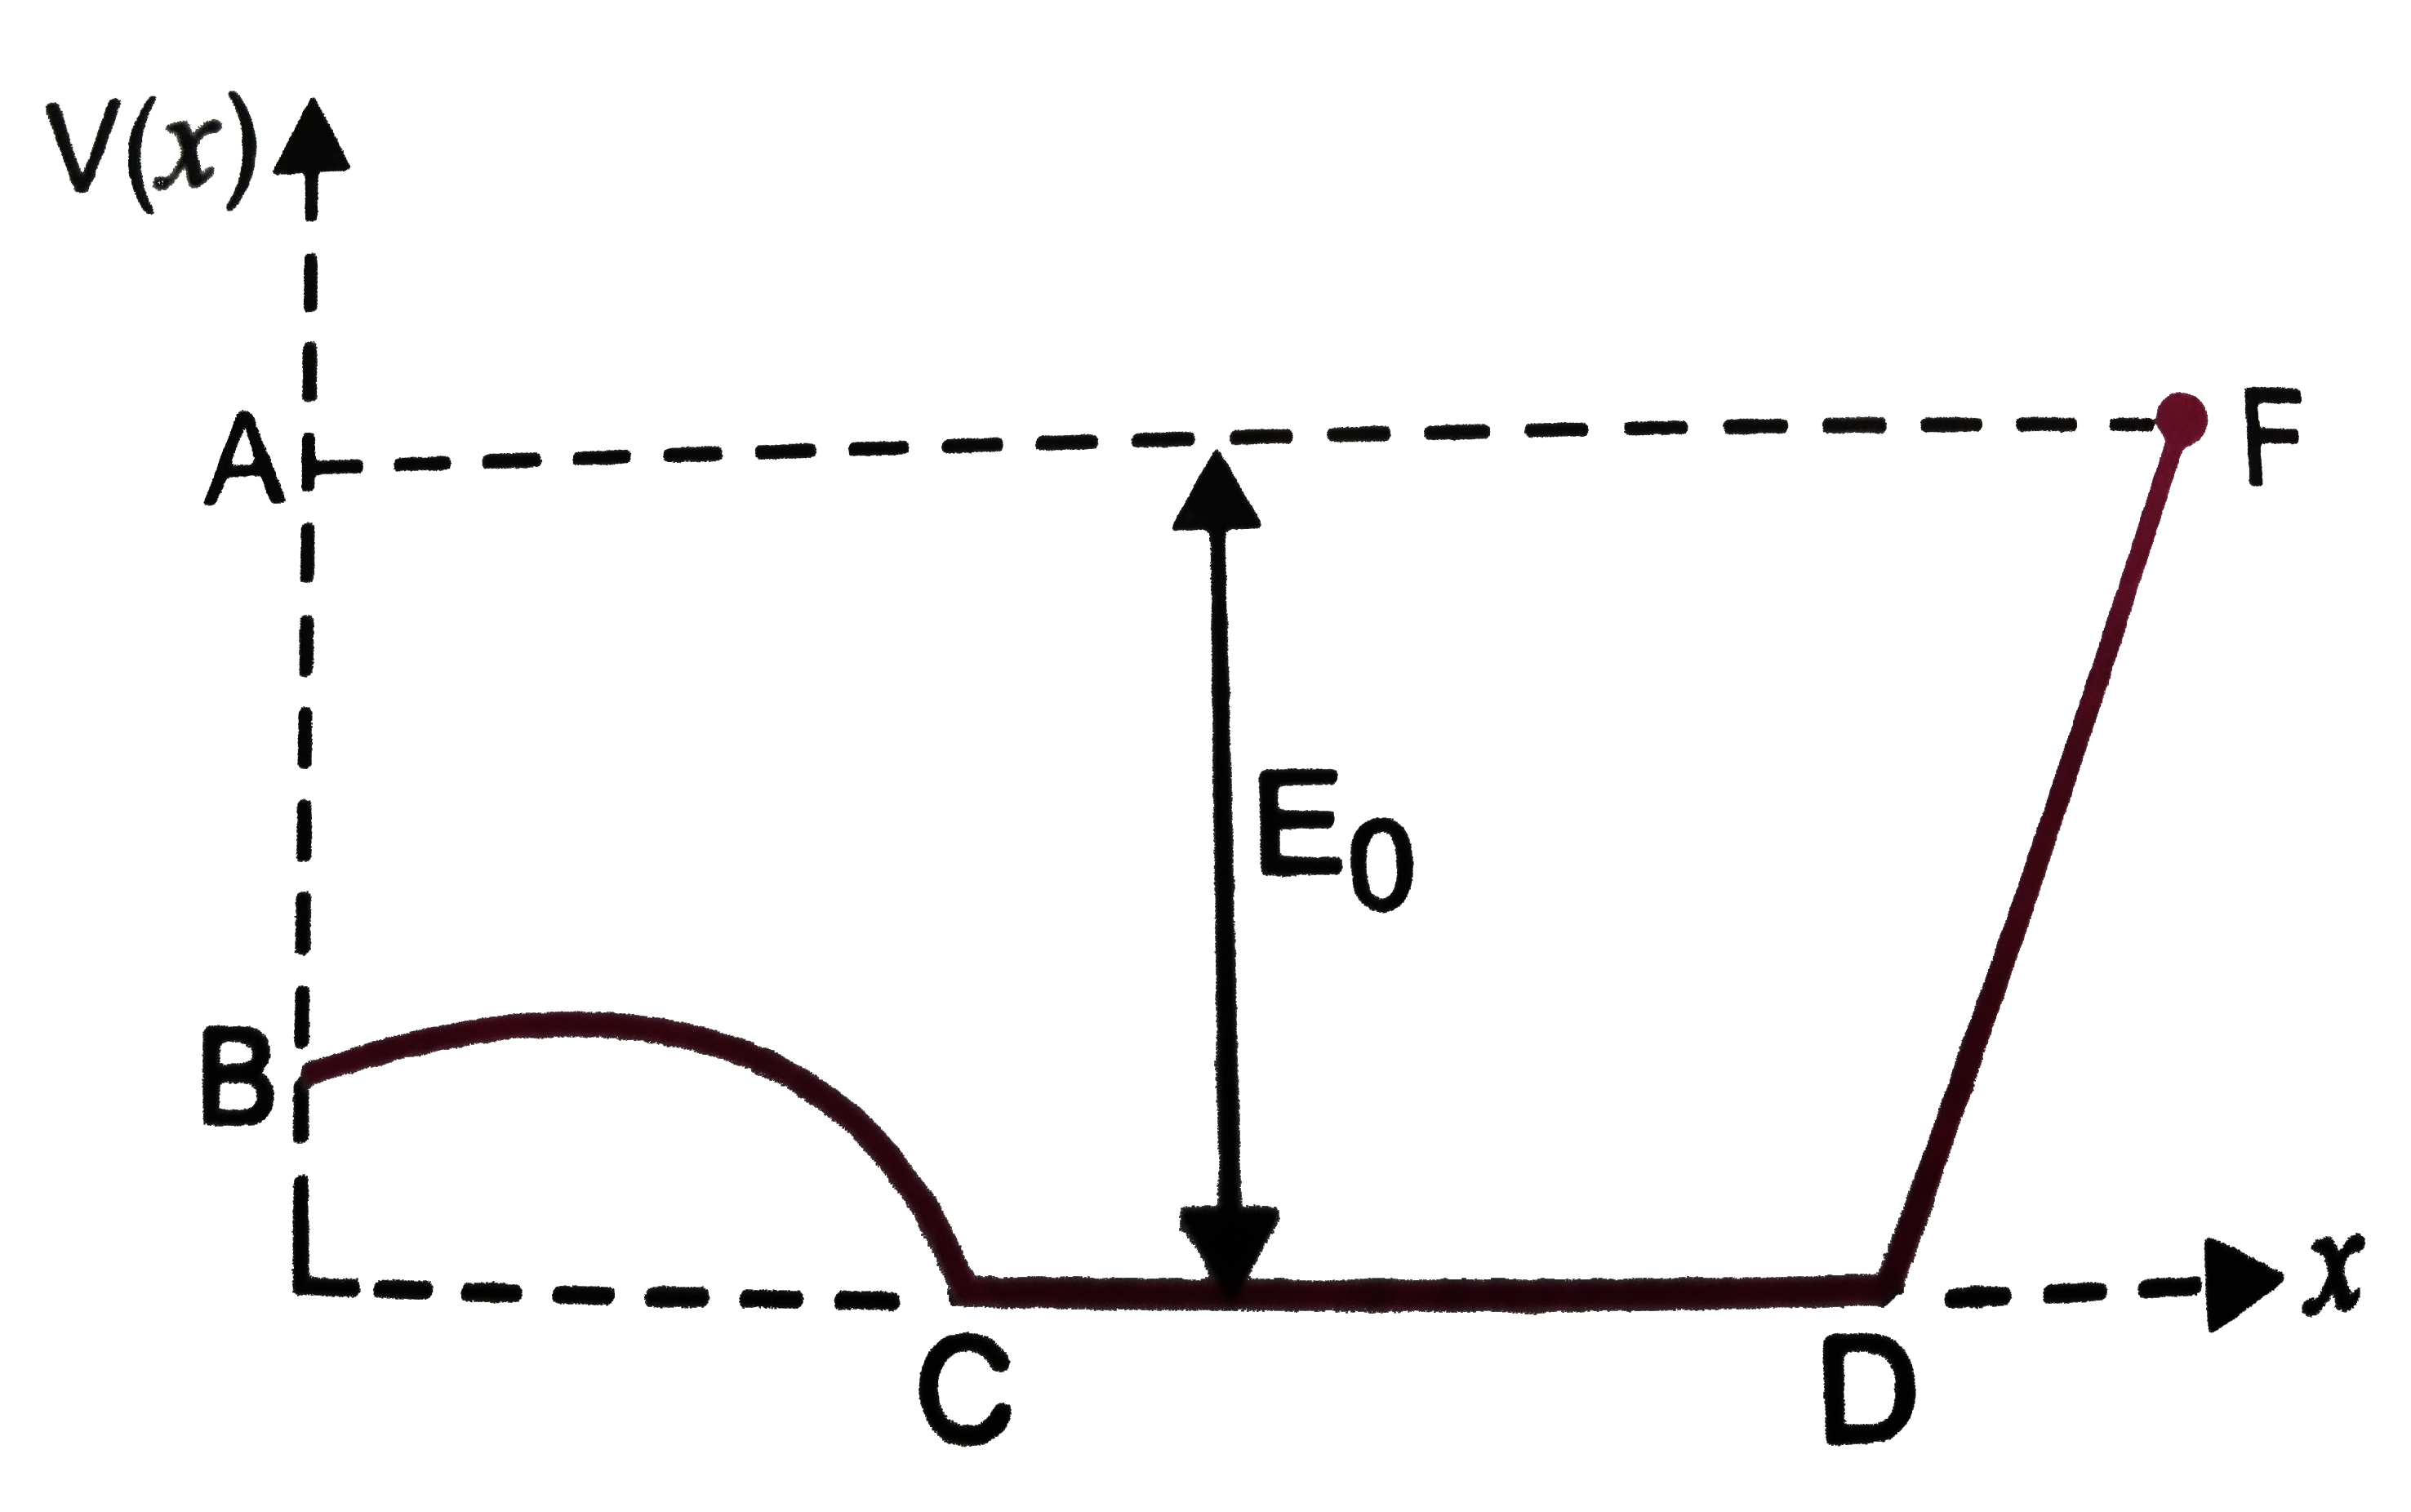
View SolutionA graph of potential energy V(x) verses x is shown in figure. A particle of energy E0 is executing motion in it. Draw graph of velocity and kinetic energy versus x for one complete cycle AFA.
 View Solution
Knowledge Check
- Question 1 - Select One
Figure shows a plot of the potential energy as a function of x for a particle moving along the x-axis. Which of the following statement(s) is/are true?
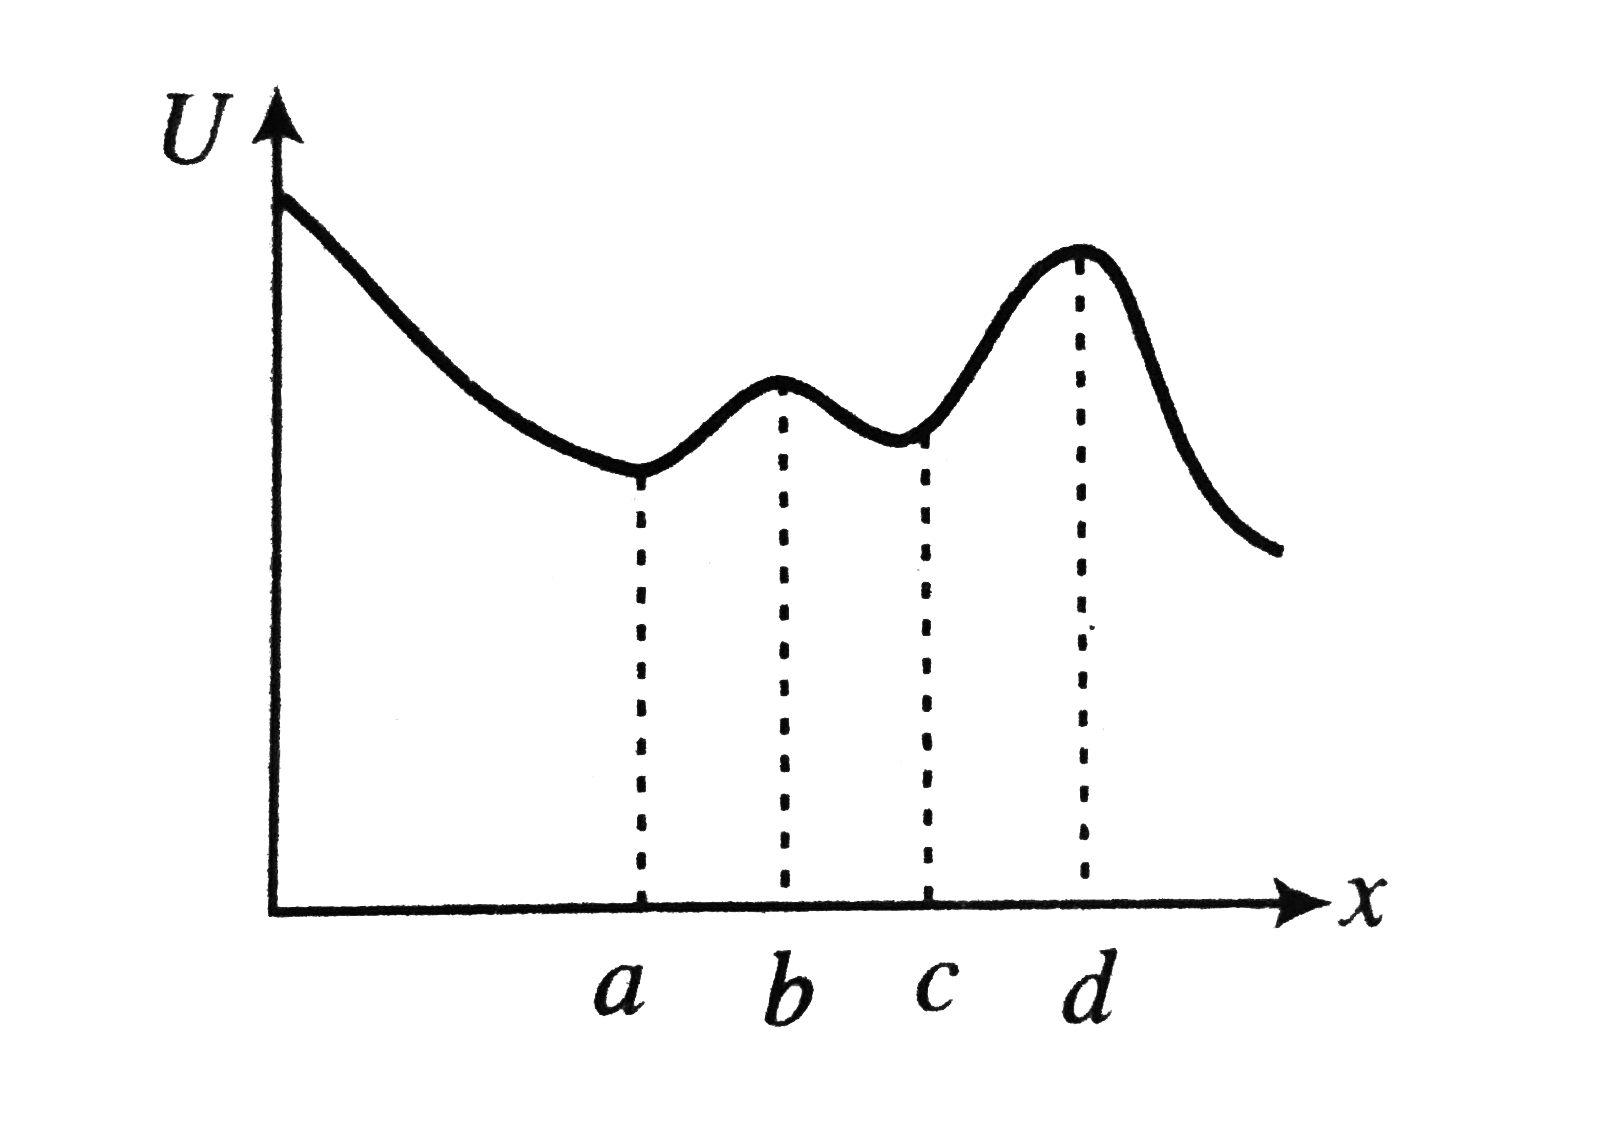 Aa, c, and d are points of equilibriumBa is a point of stable equilibriumCb is a unstable equilibrium pointDAll of the above
 - Question 2 - Select One
Potential energy curve U of a particle as function of the position of a particle is shown. The particle has total mechanical energy E of 3.0 joules. Then select correct alternative.
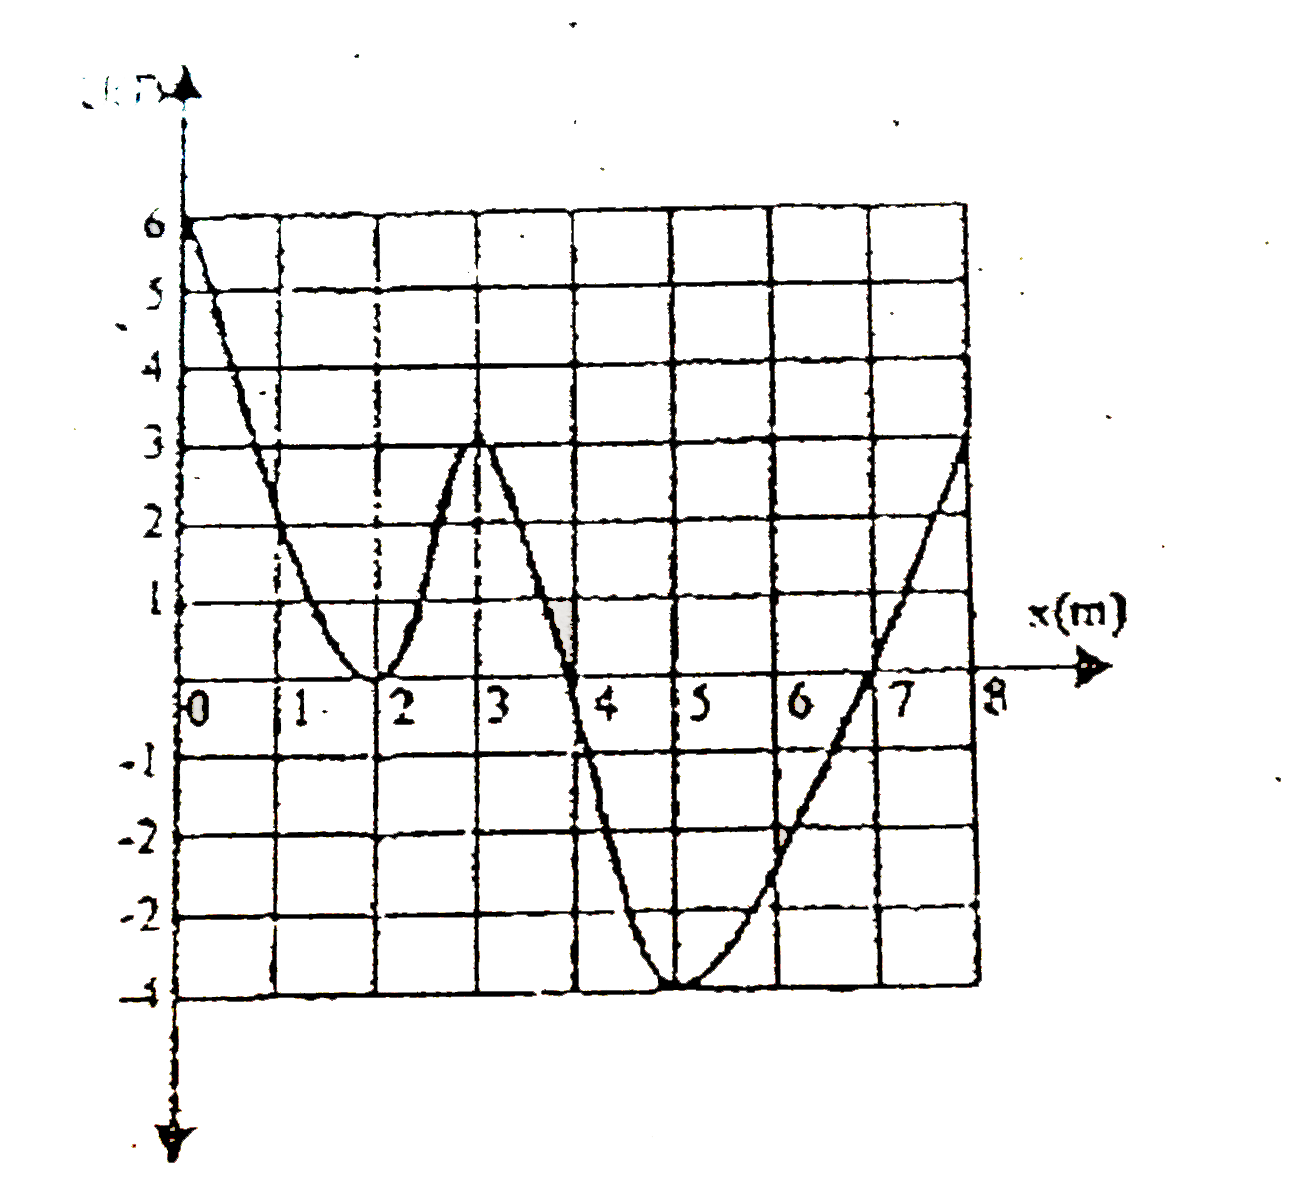 AIt can never be present at x=0mBIt can never be present at x=5mCAt x=2 its kinetic energy is 0JDAt x=1 its kinetic energy 3J
 - Question 3 - Select One
Figure shows a graph of potential energy.
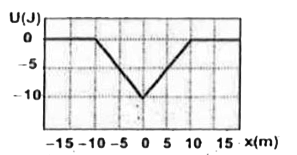
Consider the following graphs of position and time.
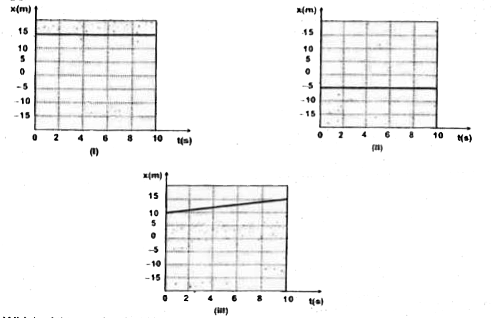
Which of the graphs could be the motion of a particle in the given potential?AIBIICI and IIDI and III
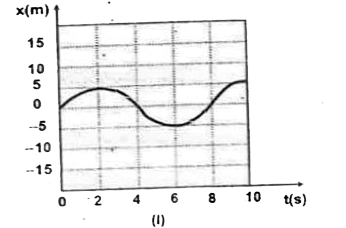
The variation of displacement with time of a particle executing free simple harmonic motion is shown in the figure.

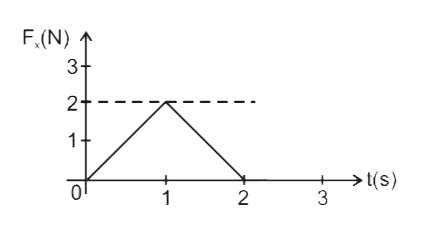
The potential energy U(x) versus time (t) plot of the particle is correctly shown in figure :View SolutionThe given figure shows a plot of the time dependent force Fx acting on a particle in motion along the x-axis. What is the total impulse delivered by this force to the particle from time t = 0 to t = 2second?
 View Solution
The potential energy of a 2kg particle free to move along the x− axis is given by
V(x)[x44−x22]joule
The total mechanical energy of the particle is 0.75J. The maximum speed of the particle (in m/s) is :View SolutionIn the one-dimensional motion of a particle, the relation between position x and time t is given by x2+2x=t (here x>0). Choose the correct statement.
View SolutionFigure shows a graph of potential energy.
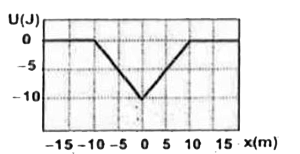
Consider the following graph of position and time , which represents the motion of the certain particle in the given potential. What is the total energy of the particle?
 View Solution

