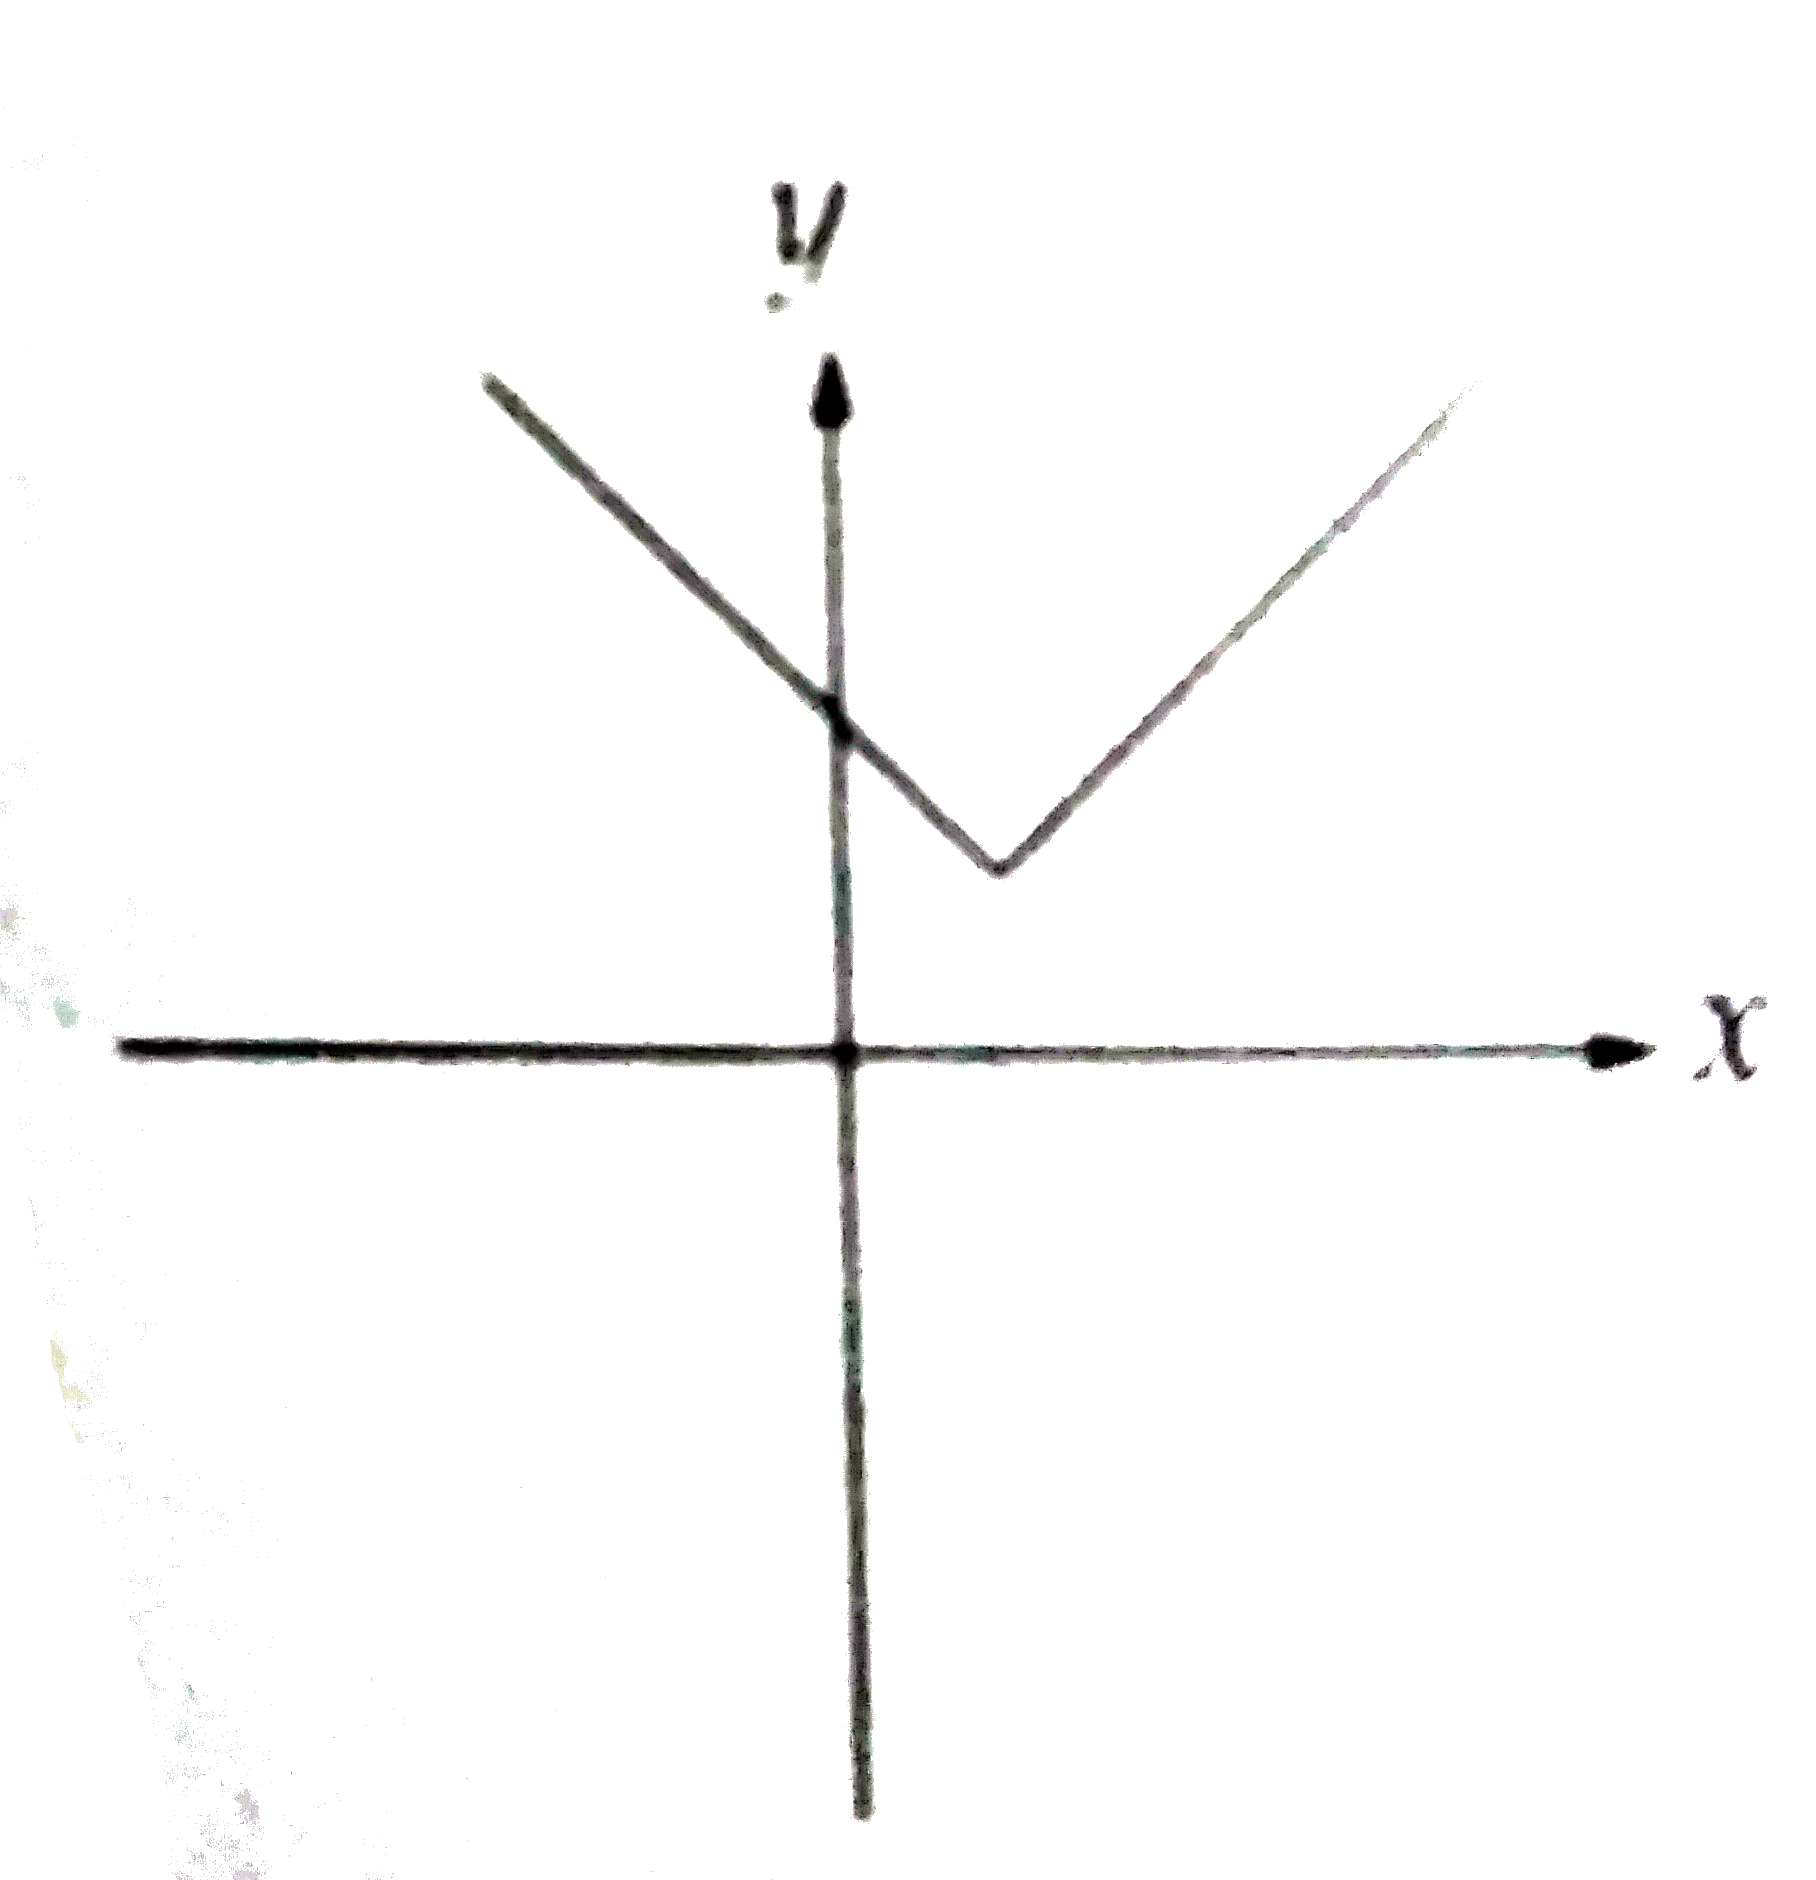
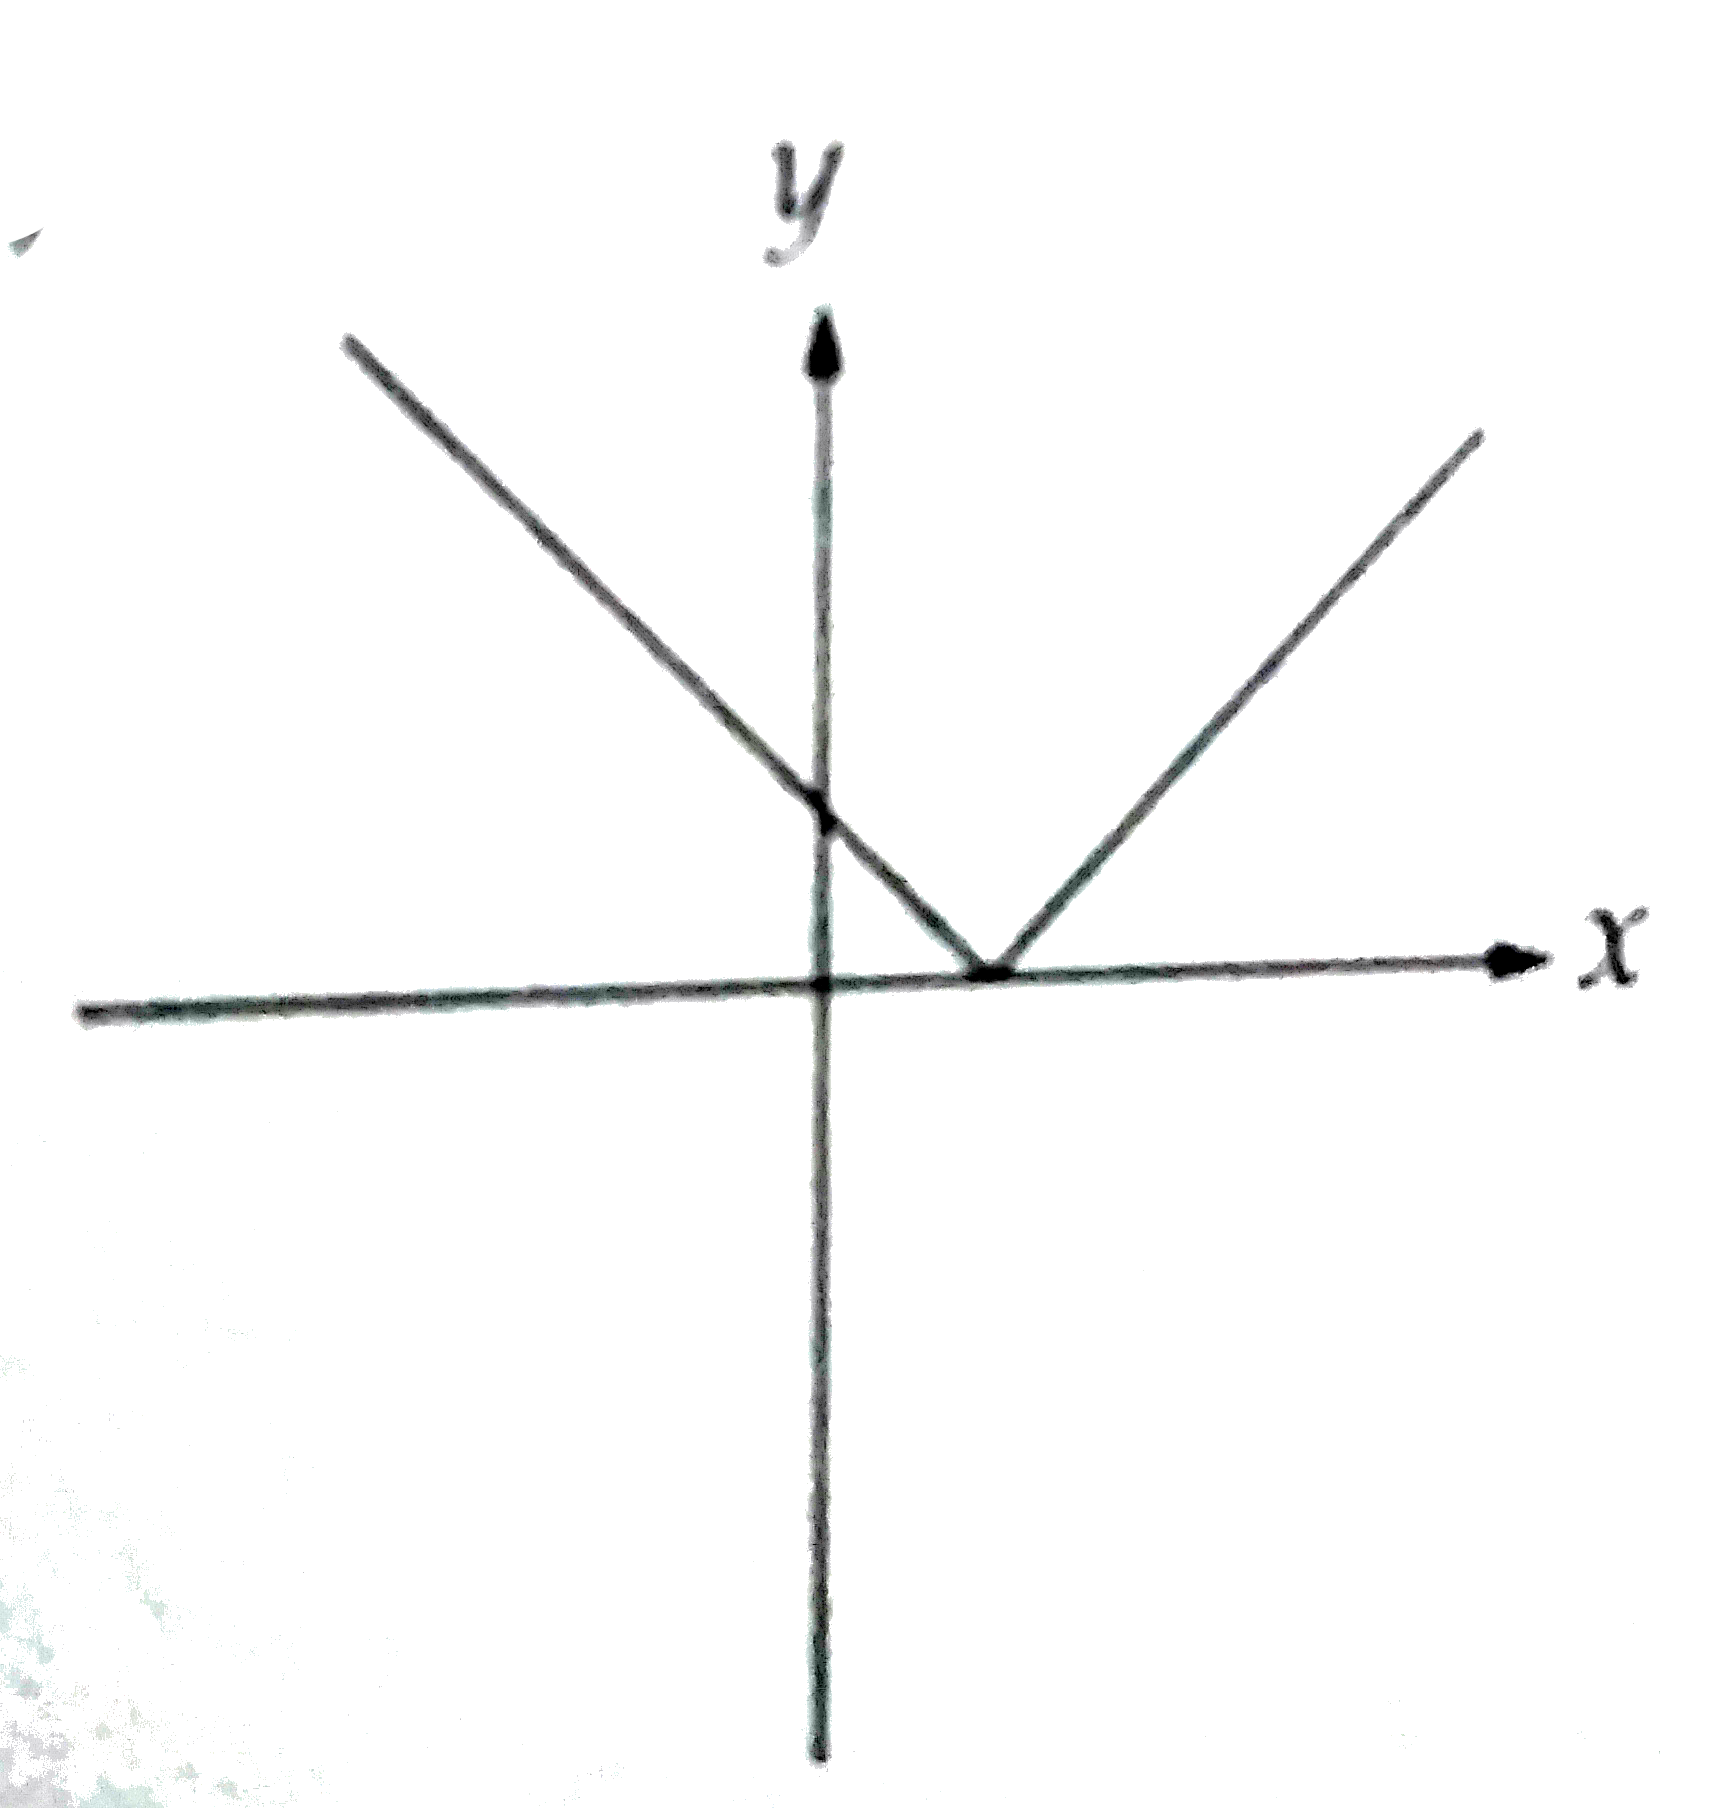
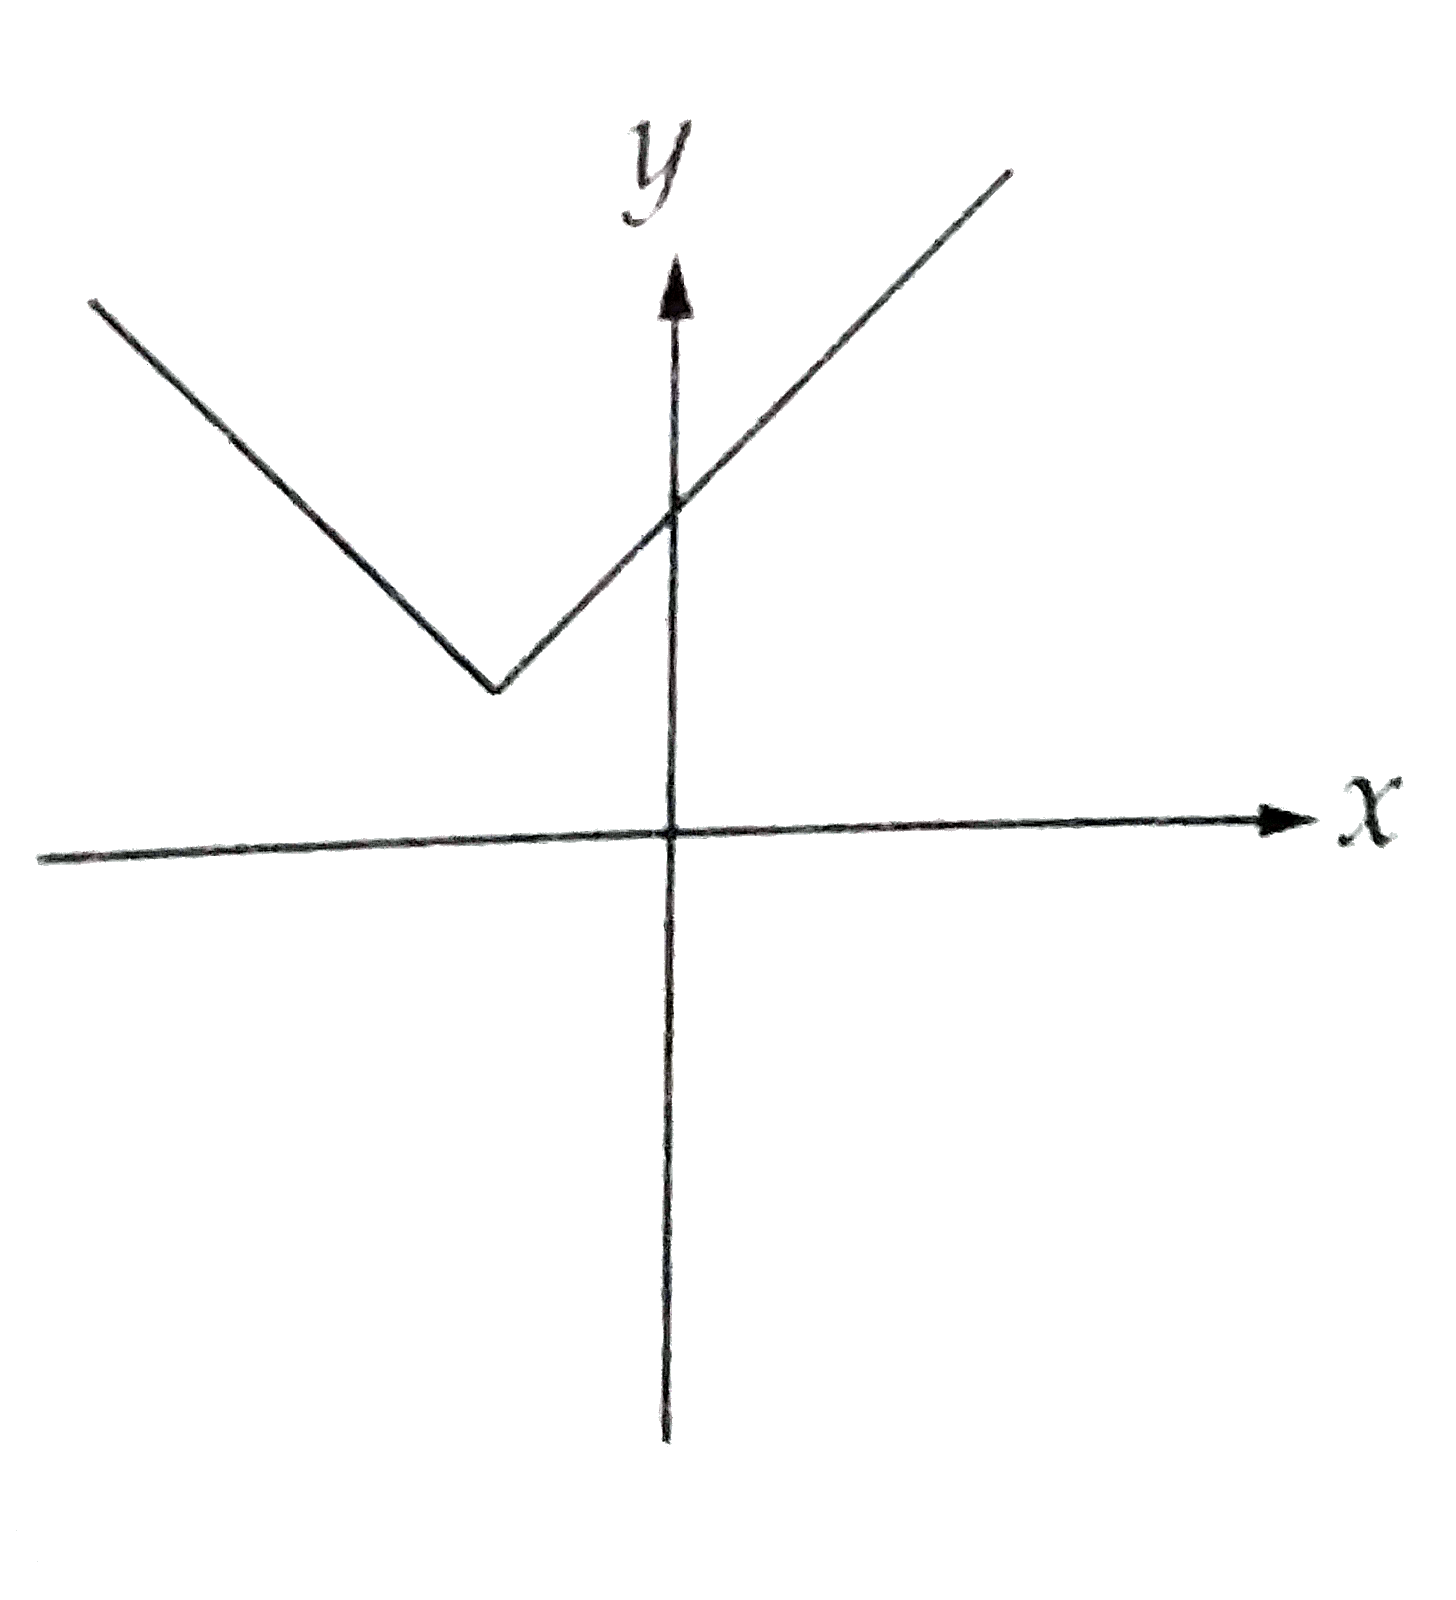
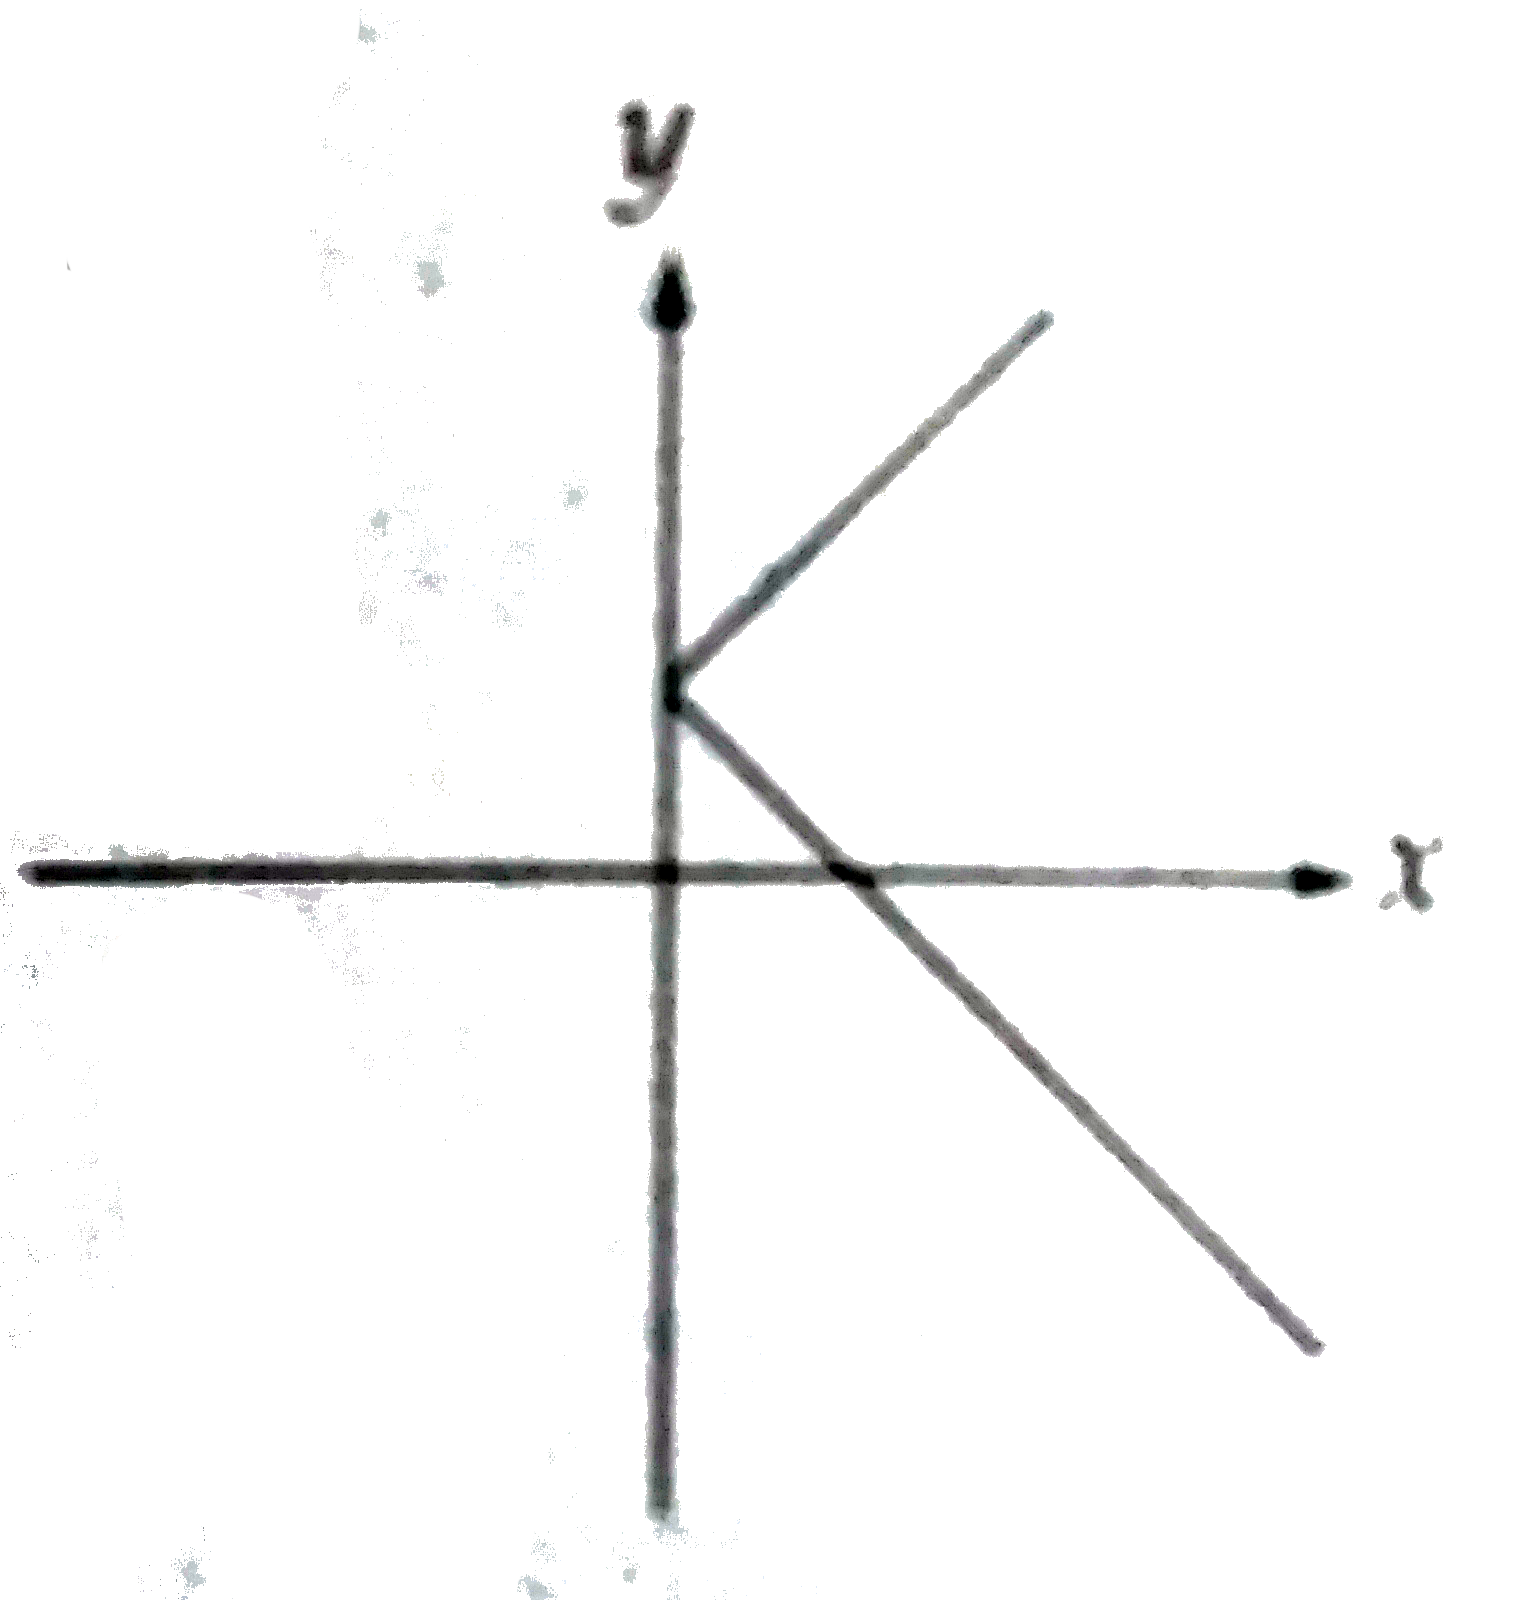
If p(x)=|2−x|+12, which of the following could be the graph of y=p(x) ?
A
B
C
D
Video Solution
Text Solution
The correct Answer is:A
The question says p(x)=|2−x|+12 and asks for the graph of y=p(x) - meaning the graph of y=|2−x|+12.
The smallest that y can be is 12, because the absolute value of anything is nonnegative. That narrows the choices to (A) and (C ). Notice that (D) cannot be functions, because for some values of x they show two associated values of y. A function, by definition, yields no more than one y for any particular x.
To choose between (A) and (C ), think about what value of x yields y=12 .
|2−x|+12=12
|2−x|=0
2−x=0
2=x
So the graph reaches its minimum point at x = 2, which means the answer must be (A).
|
Updated on:21/07/2023
Topper's Solved these Questions
- BOOK - KAPLANCHAPTER - FUNCTIONS EXERCISE - FUNCTIONS FOLLOW - UP TEST6videos
FUNCTIONS
- BOOK - KAPLANCHAPTER - EXPONENTS, RADICALS, POLYNOMIALS, AND RATIONAL EXPRESSIONS EXERCISE - Multiple Choice Question20videos
EXPONENTS, RADICALS, POLYNOMIALS, AND RATIONAL EXPRESSIONS
- BOOK - KAPLANCHAPTER - FUNCTIONS AND FUNCTION NOTATIONEXERCISE - Multiple Choice Question20videos
FUNCTIONS AND FUNCTION NOTATION
Similar Questions
Knowledge Check
- Question 1 - Select One
Which of the following could be the graph of y=3−2x ?
A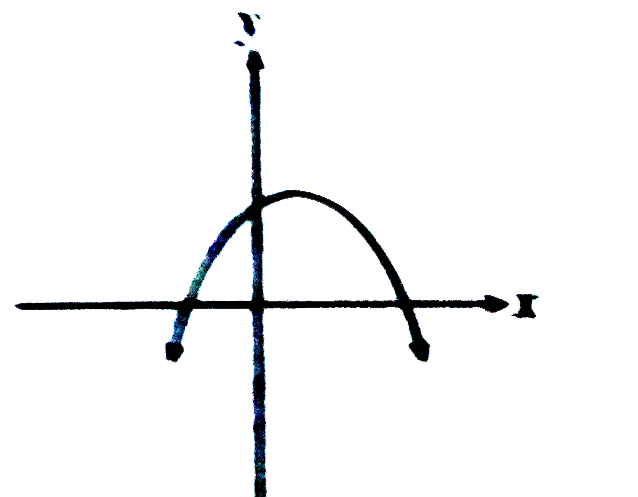 B
B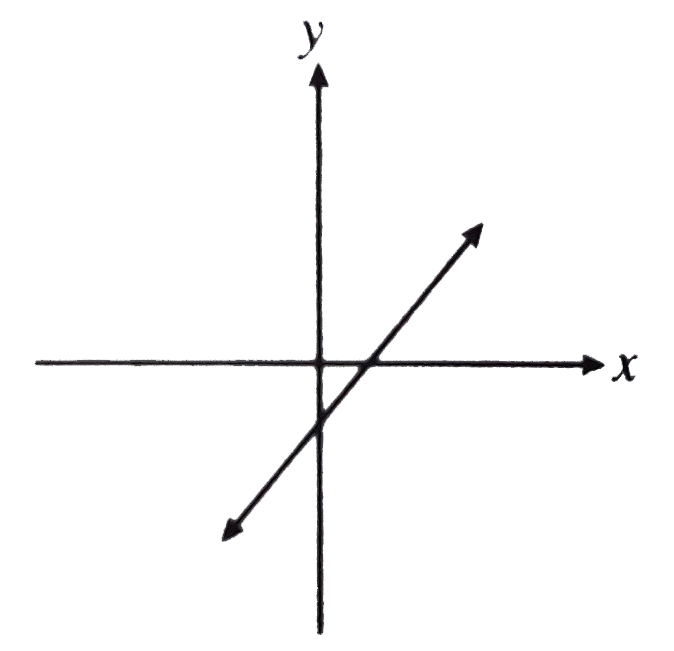 C
C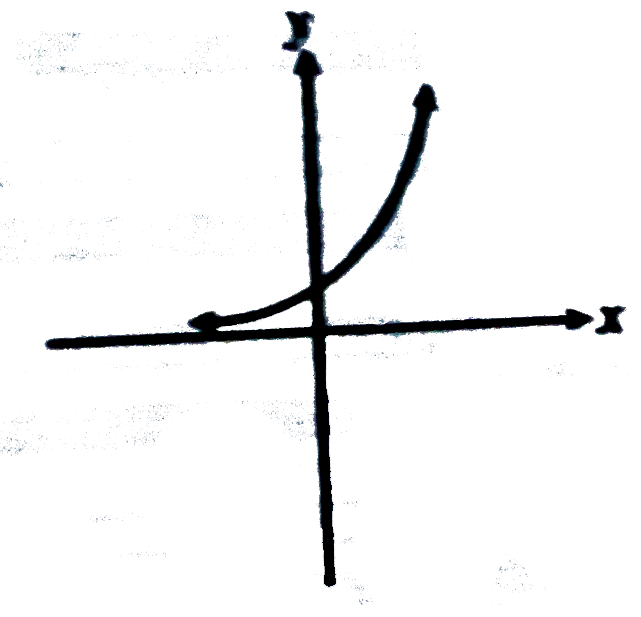 D
D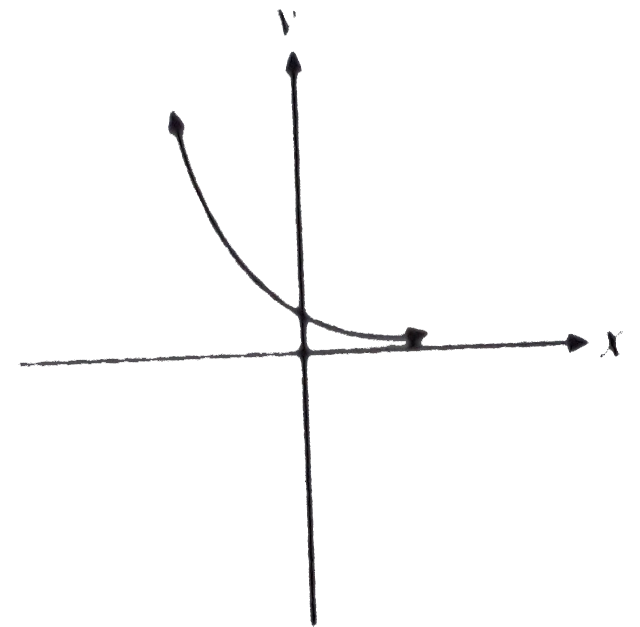
- Question 2 - Select One
Which of the following could be the graph of 2x+3y+12=0 ?
A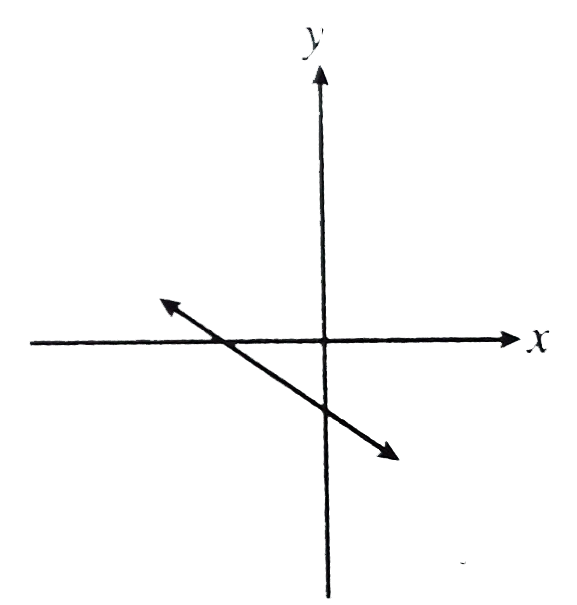 B
B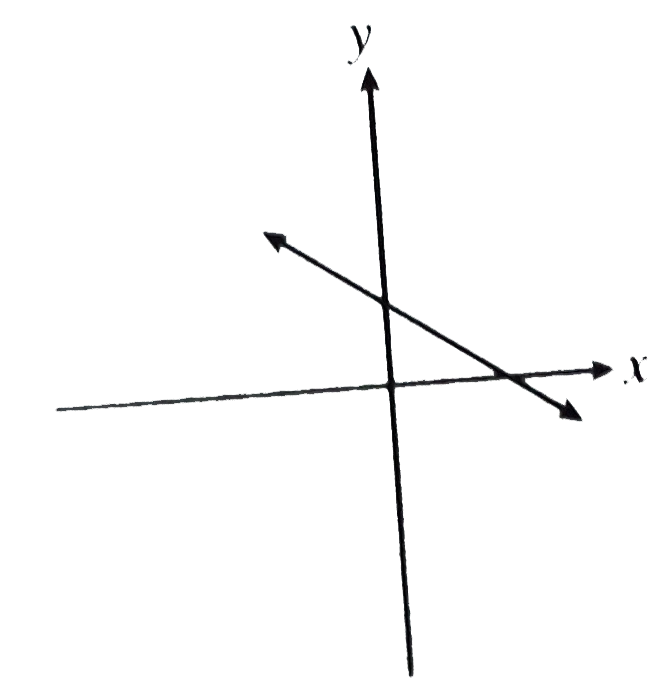 C
C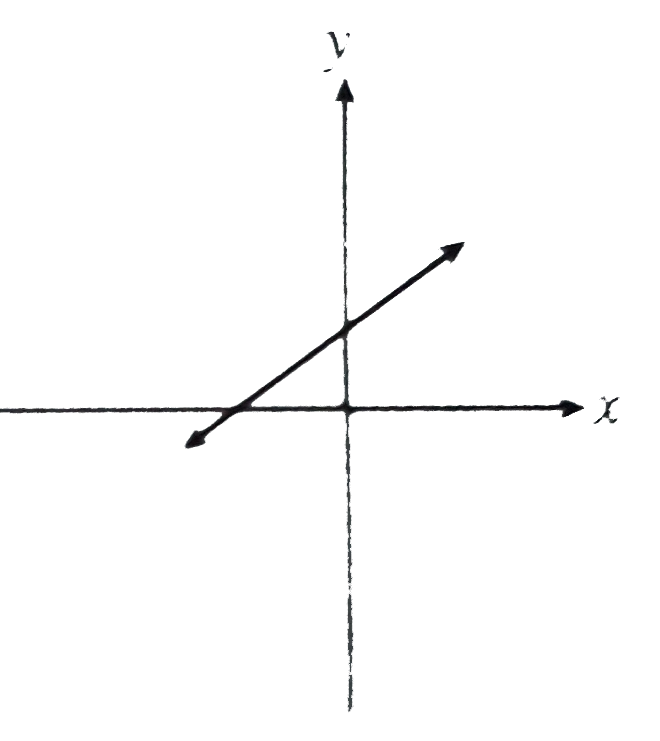 D
D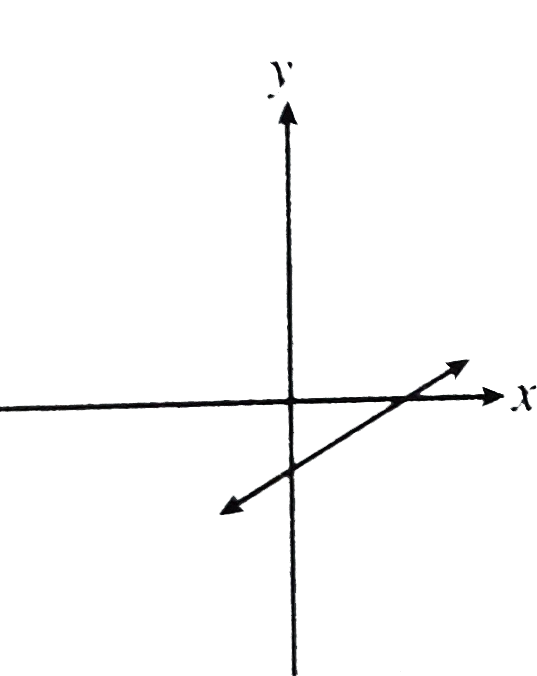
- Question 3 - Select One
Which of the following could be the graph of 2x+3y+12=0 ?
A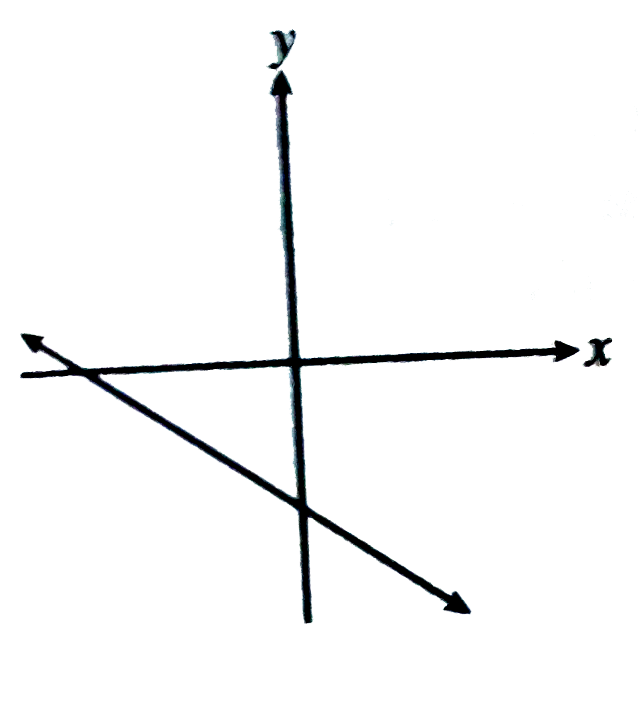 B
B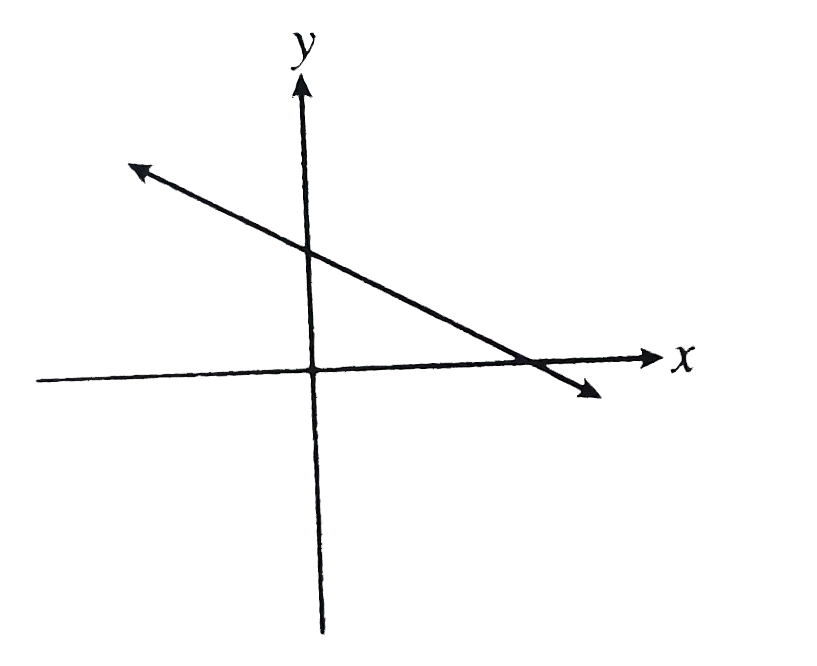 C
C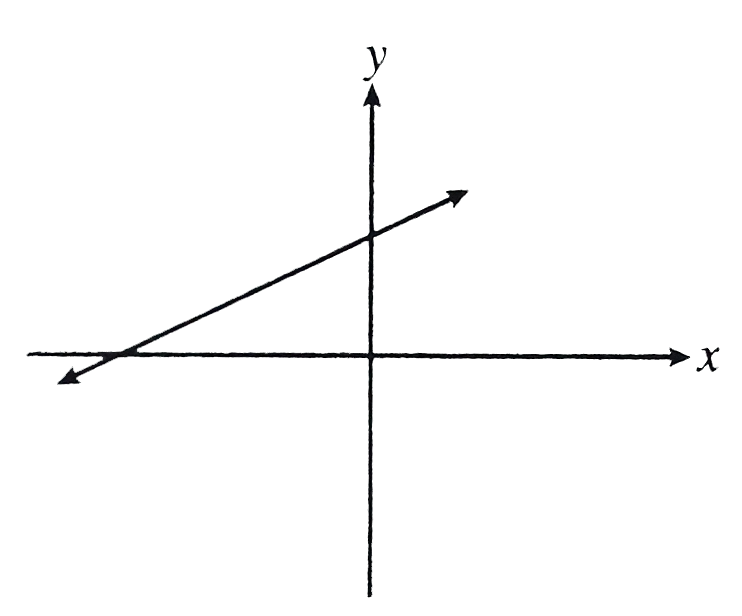 D
D
If k is a positive constant such that 0<k<1, which of the following could be the graph of y−x=k(x+y) ?
View Solution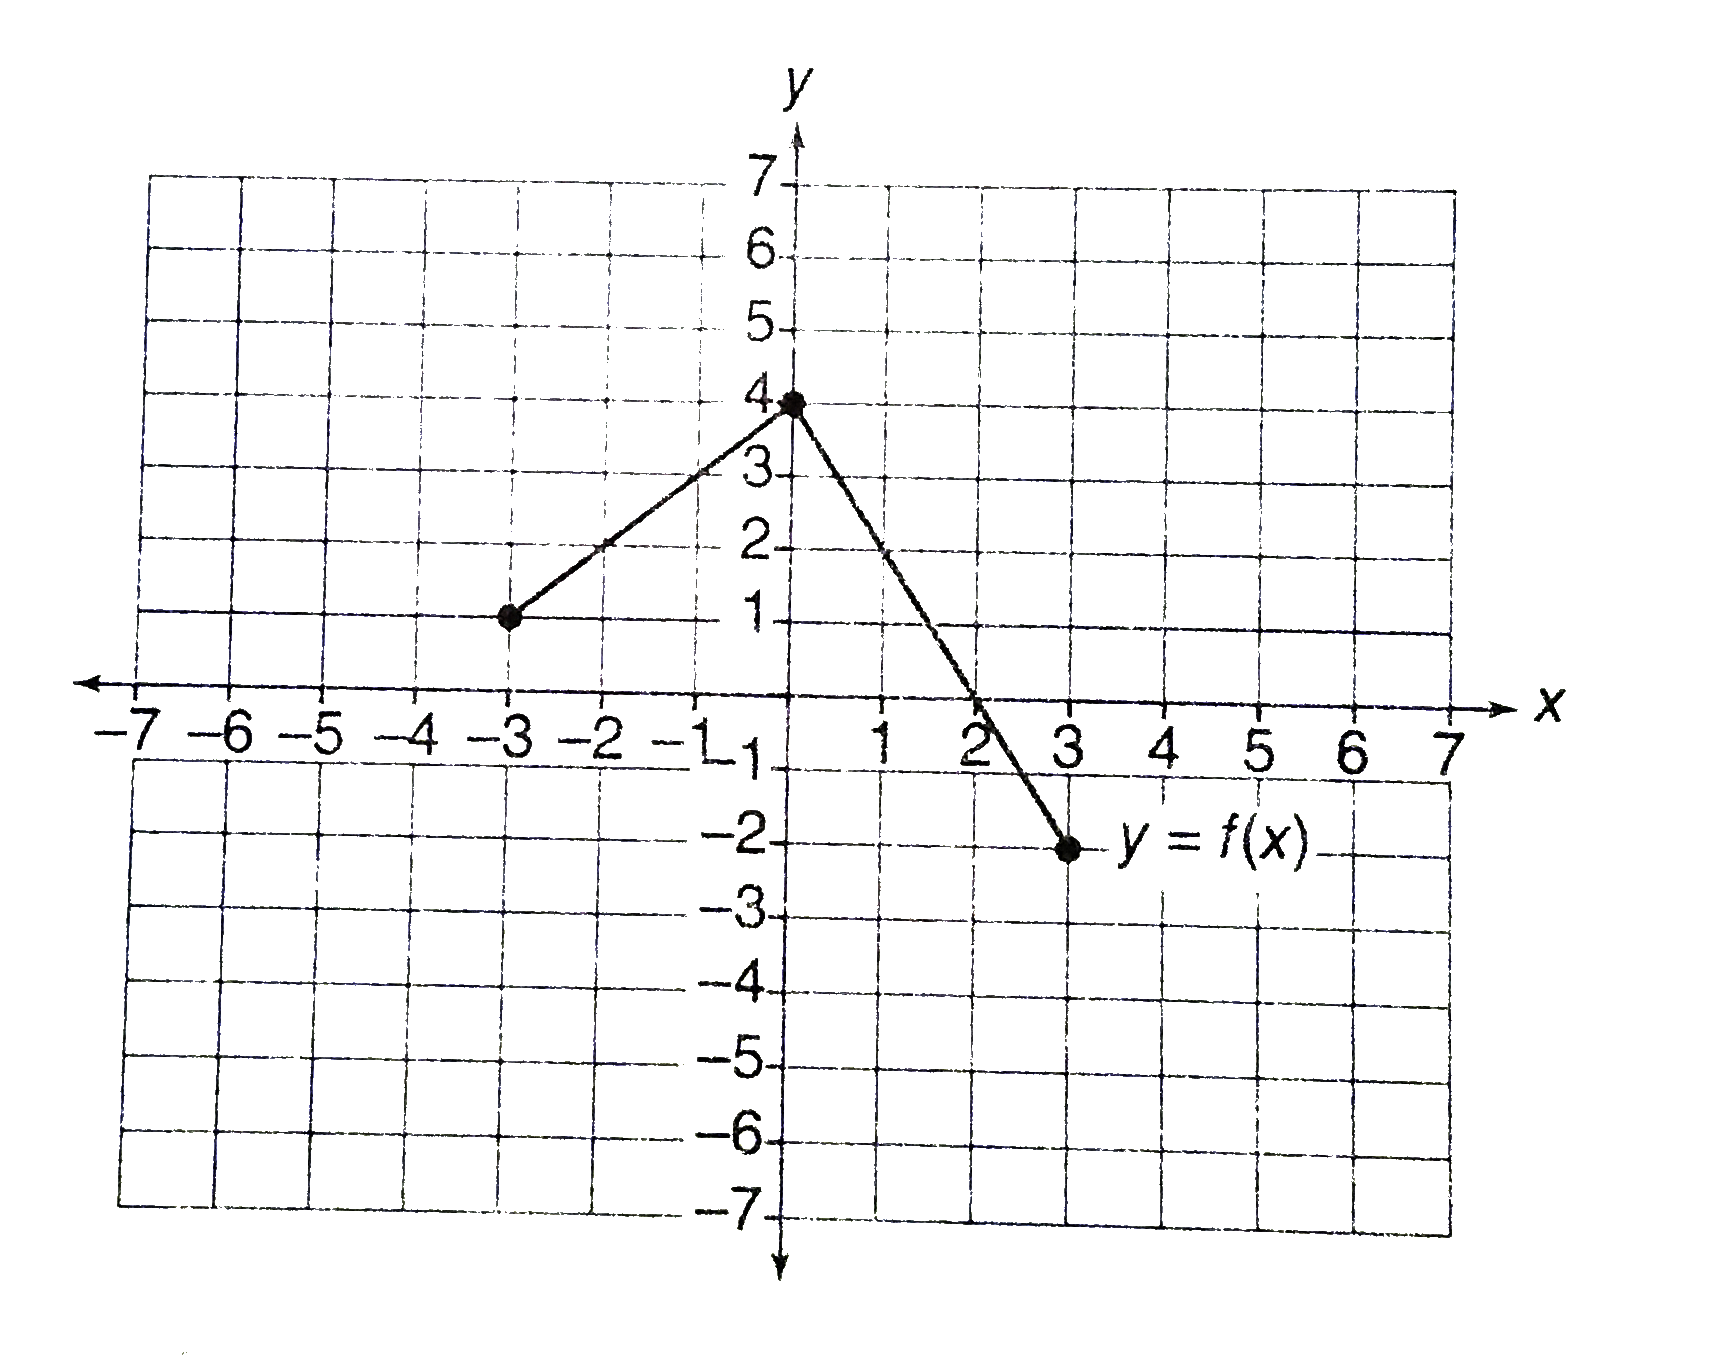
If the accomanying figure above shows the graph of function f, which of the following could represent the graph of y=f(x+1)?View SolutionThe graph of y=f(x) is shown below.
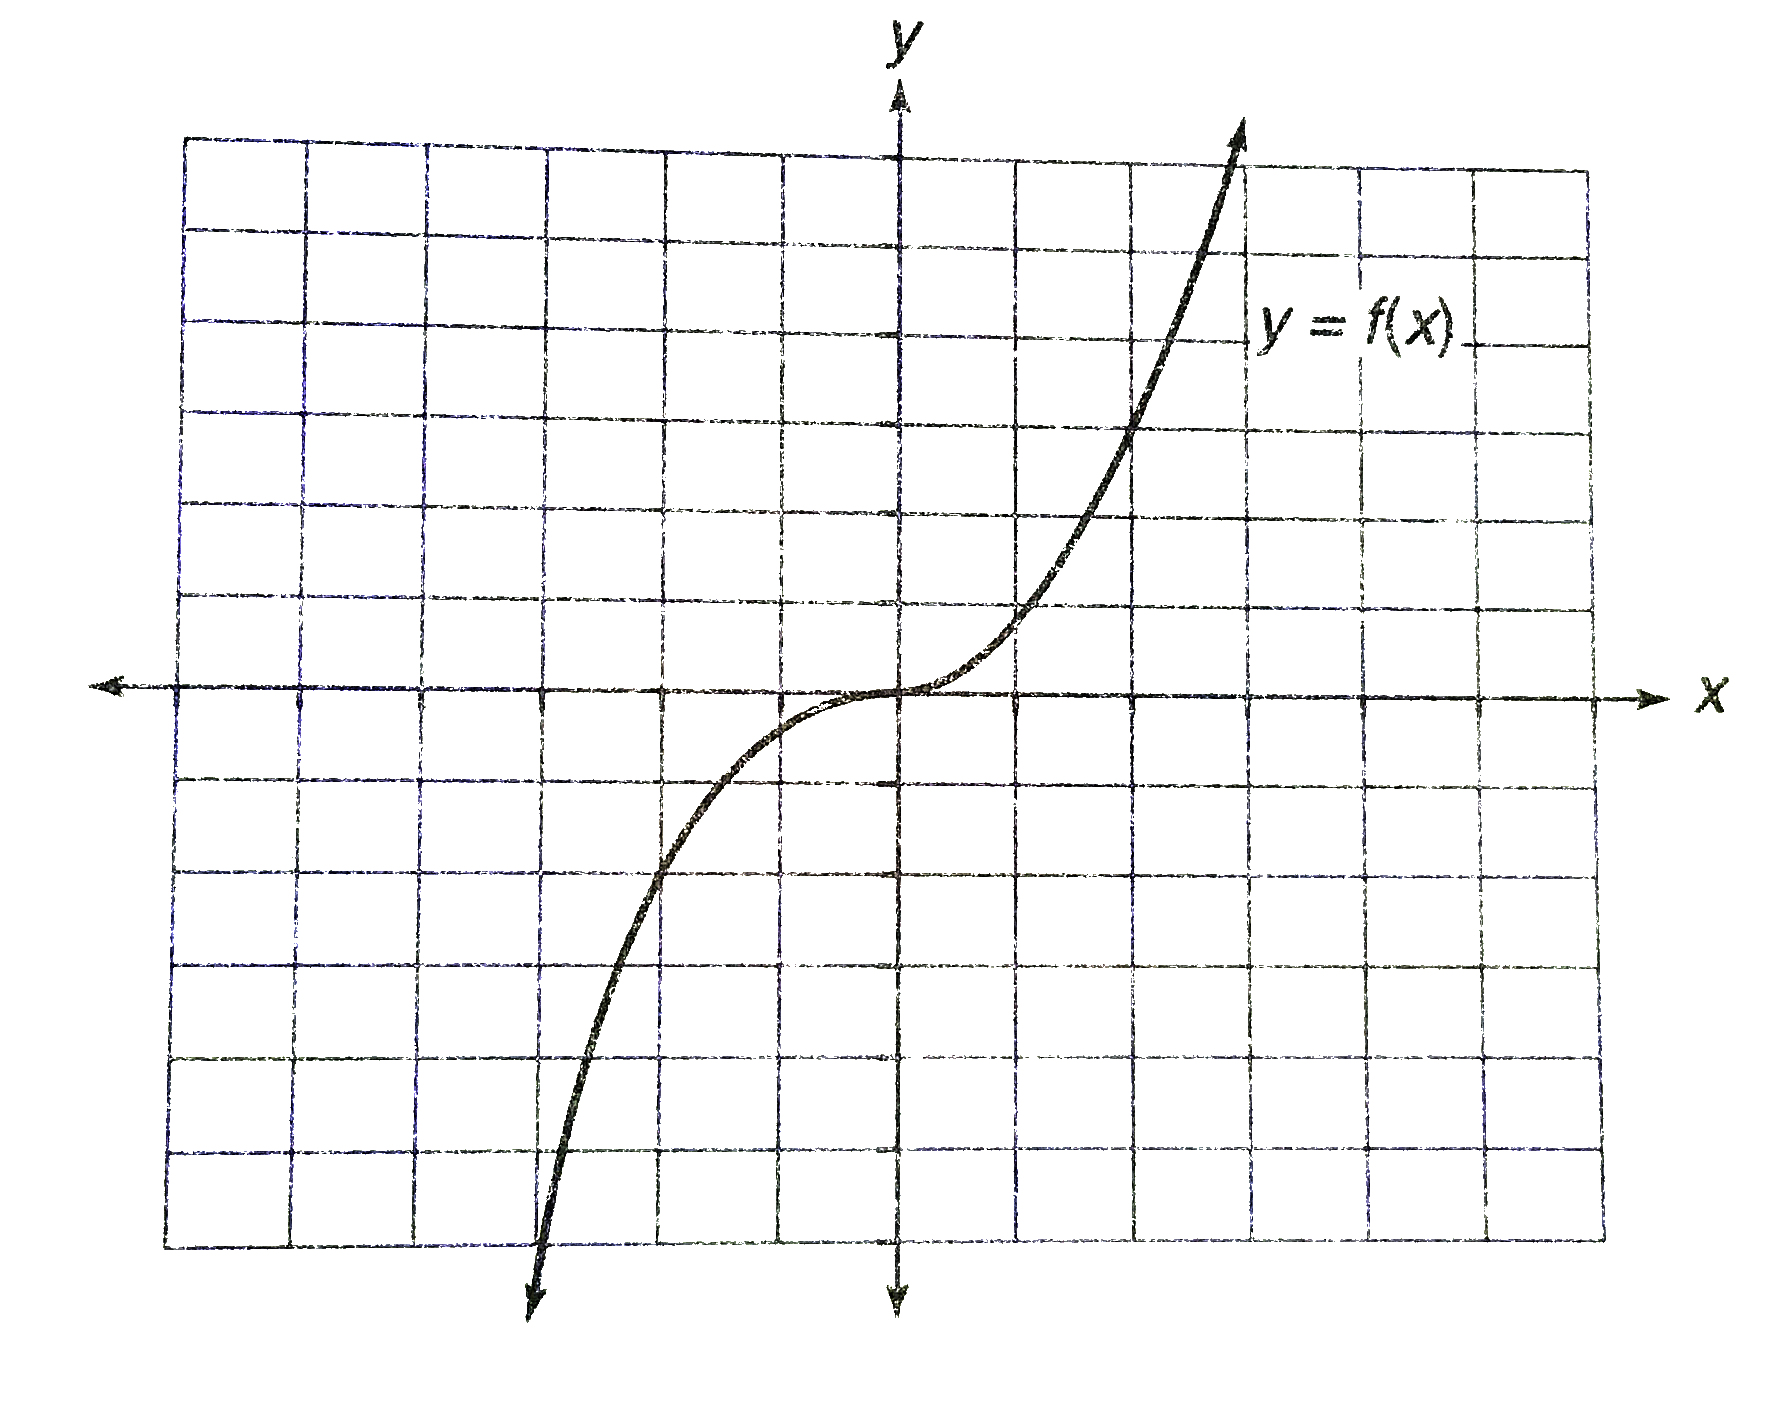
Which of the following could represents the graph of y=f(x−2)+1?View SolutionIF x2+2xy+y2=64 and y-x=12, which of the following could be the value of x?
View SolutionIf (x,y) represents a point on the the graph of y=2x+1, which of the following could be a portion of the graph of the set of points (x,y2)?
View Solution

