Each month. The Bureau of Labor Statistics conducts a survey called the Current Population Survey (CPS) to measure unemployement in the United States. Across the country, about 60,000 households are included in the survey sample. These households are grouped by geographic region. A summery of the January 2014 survey results for make responds in one geographica region is shown in the table below.

Q. According to data in the table, for which age group did the smallest percentage of men report that they were unemployed in January 2014?
20 to 24 years
35 to 44 years
45 to 54 years
Over 54 years
The correct Answer is:D
Step by step video & image solution for Each month. The Bureau of Labor Statistics conducts a survey called the Current Population Survey (CPS) to measure unemployement in the United States. Across the country, about 60,000 households are included in the survey sample. These households are grouped by geographic region. A summery of the January 2014 survey results for make responds in one geographica region is shown in the table below. Q. According to data in the table, for which age group did the smallest percentage of men report that they were unemployed in January 2014? by Maths experts to help you in doubts & scoring excellent marks in Class 10 exams.
Updated on:21/07/2023Topper's Solved these Questions
Similar Questions
Each month. The Bureau of Labor Statistics conducts a survey called the Current Population Survey (CPS) to measure unemployement in the United States. Across the country, about 60,000 households are included in the survey sample. These households are grouped by geographic region. A summery of the January 2014 survey results for make responds in one geographica region is shown in the table below.

Q. If one unemployed man from this sample is chosen at random for a follow-up survey, what is the probability that he will be between the ages of 45 to 54?
View SolutionThe species that occur in different geographical regions are called :
View Solution
Knowledge Check
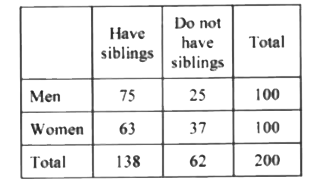
A survey was conducted among a randomly chosen sample of 100 males and 100 females to gather data on family size. The data are shown in the table below.

Which of the following is closest to the perecent of those surveyed who have siblings?A31B63C69D75
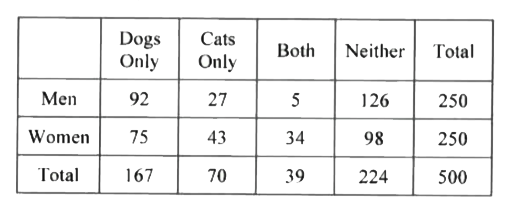
A group of tenth-grade students responded to a survey that asked which math course they were currently enrolled in. The survey data were broken down as shown in the table above. Which of the following categories accounts for approximately 19 percent of all the survey respondents?AFemales taking GeometryBFemales taking Algebra IICMales taking GeometryDMales taking Algebra IA survey was conducted among a randomly chosen sample of 250 single men and 250 single women about whether they owned any dogs or cats. The table below displays a summary of the survey results.

According to the table, which of the following statements is true?AThe number of men that reported they had any pets is greater than the number of people that reported they had dogs only.BThe number of people that reported they had any pets is less than twice the number of women that reported they had dogs only.CThe percentage of men that reported they had dogs only is less than the percentage of people that reported they had cats only.DThe percentage of women that reported they had any pets is greater than the percentage of people that reported they did not have any pets.
Which types of birds are absent on Galapagos islands when they were surveyed by Darwin
View SolutionName the following:
The statistical study of the human population of a region.
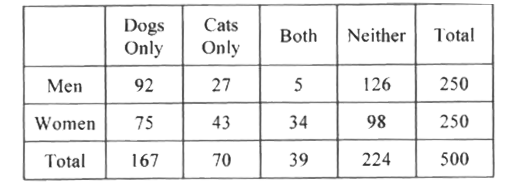
View SolutionA survey was conducted among a randomly chosen sample of 250 single men and 250 single women about whether they owned any dogs or cats. The table below displays a summary of the survey results.

According to the table, which of the following statements is most likely to be false?
View SolutionA resrearcher is conducting a survey for which she currently has 93% confidence level. What would be two actions that she could take that would be most likely to increase the confidence level in her survey result?
View SolutionErica is conducting a survey about the proposed increase in the sports budget in the Hometown School Distrinct. Which survey method would likely contain the most bias?
View Solution
