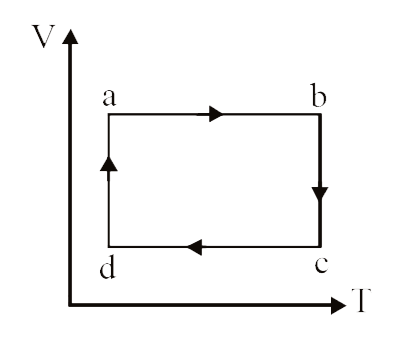
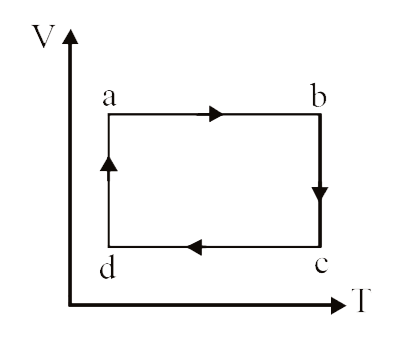
V-T graph of a process of monoatomic ideal gas is shown in figure.
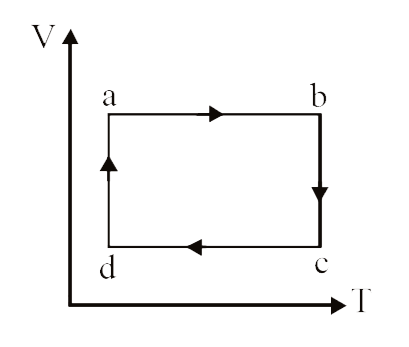
Sum of work done by the gas in process abod is-
zero
positive
Negative
data is insufficient
Step by step video & image solution for V-T graph of a process of monoatomic ideal gas is shown in figure. Sum of work done by the gas in process abod is- by Physics experts to help you in doubts & scoring excellent marks in Class 12 exams.
Topper's Solved these Questions
Similar Questions
Knowledge Check
- Question 1 - Select One
P−V diagram of an ideal gas is as shown in figure. Work done by the gas in process ABCD is
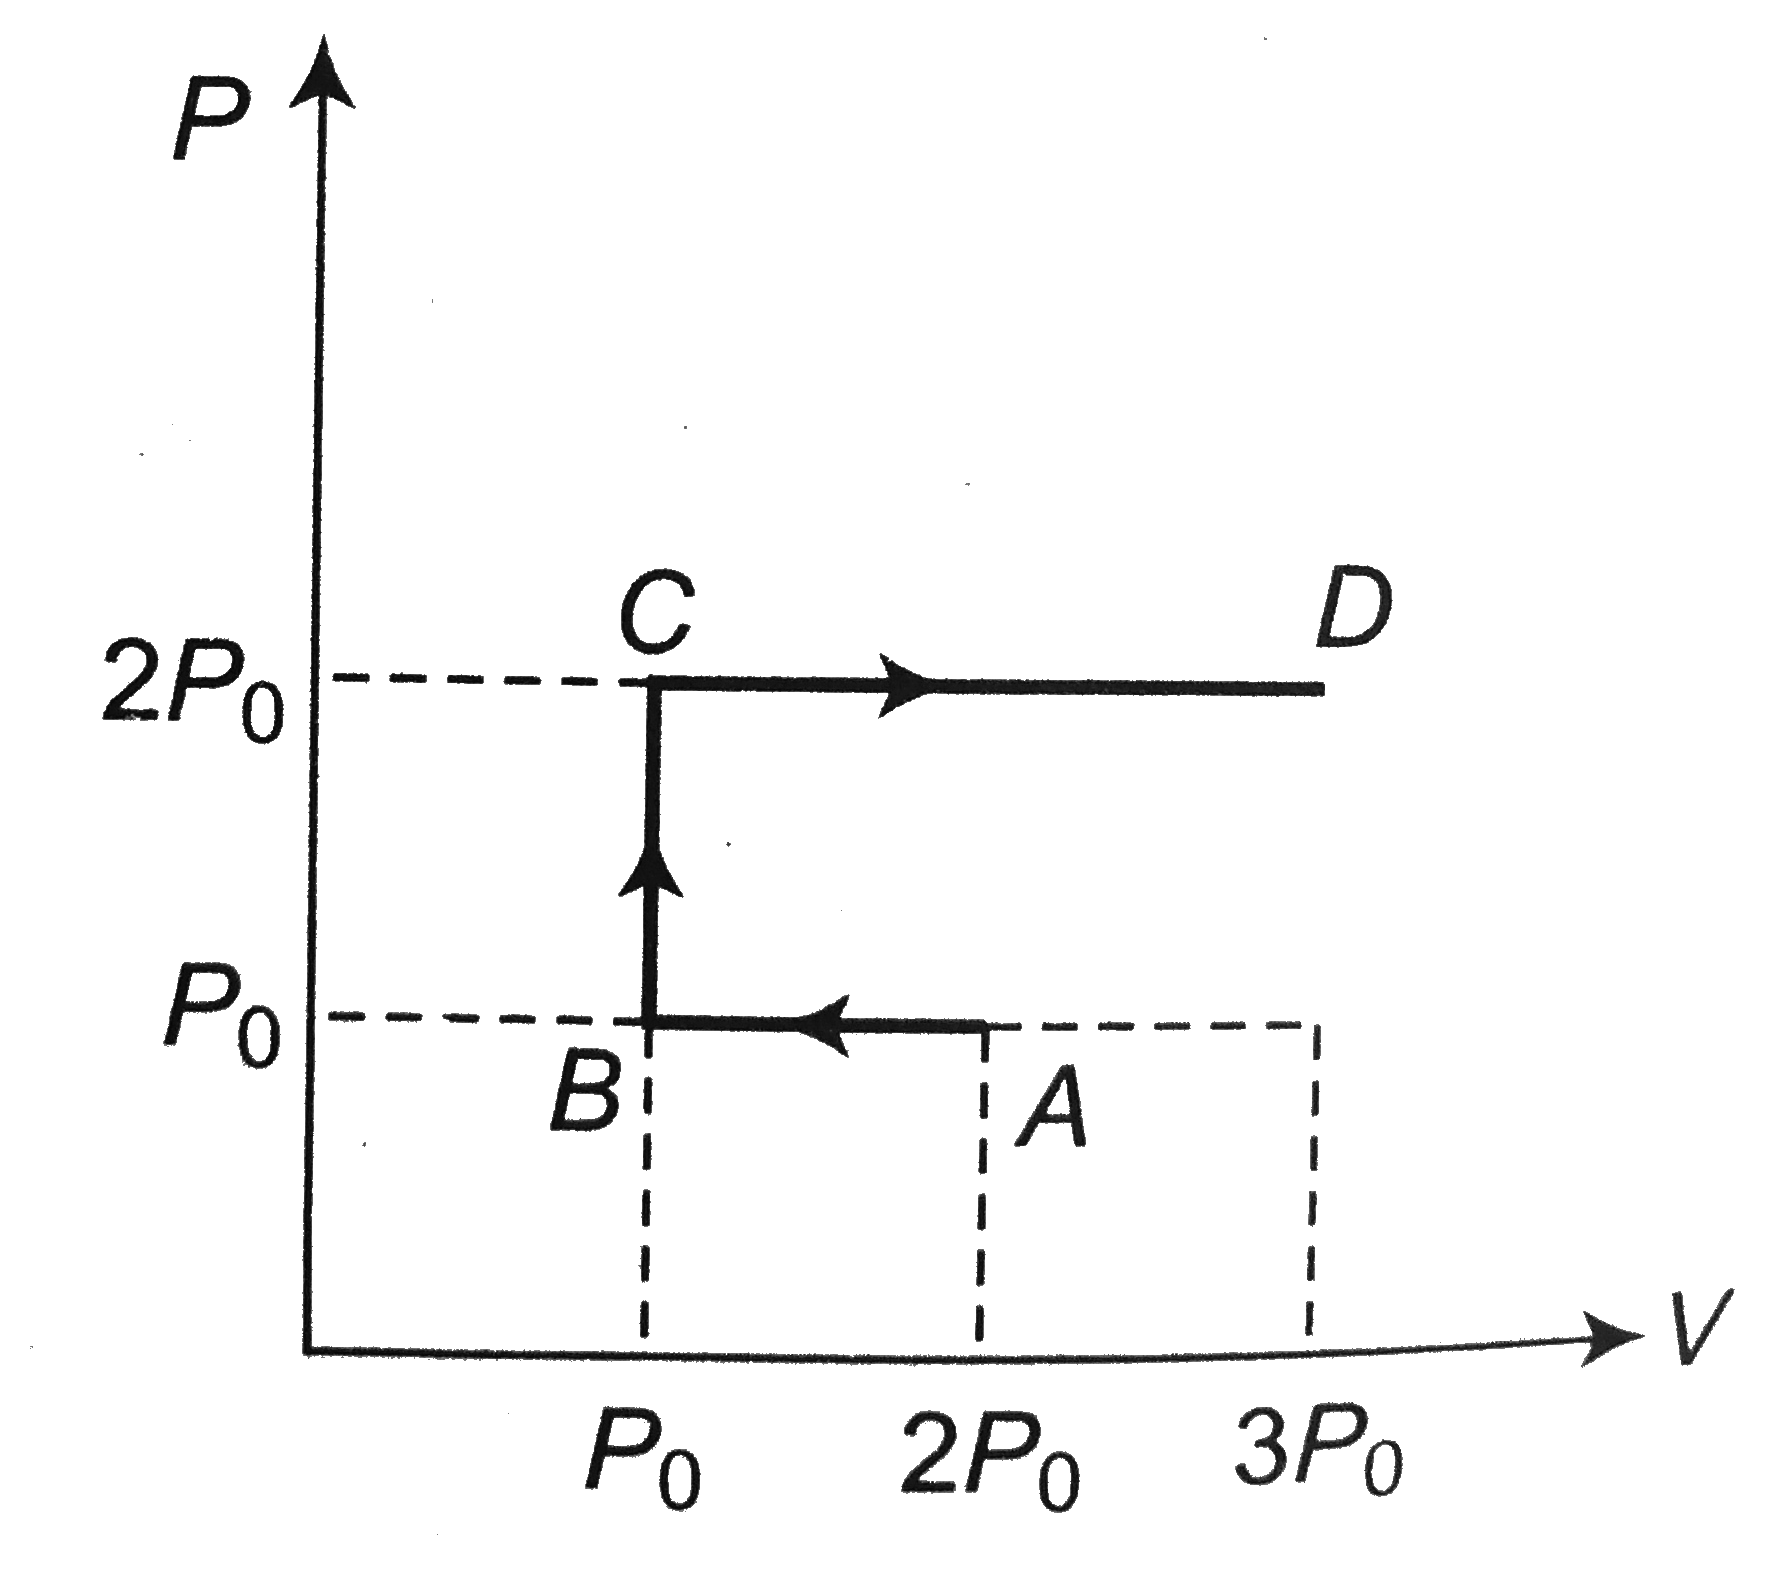 A4P0V0B2P0V0C3P0V0DP0V0
 - Question 2 - Select One
graph of an ideal gas is as shown in figure.

Work done by the gas in complete cyclic process about isAzeroBpositiveCnegativeDData is insufficient - Question 3 - Select One
P-V diagram of an ideal gas is as shown in figure. Work done by the gas in the process ABCD is
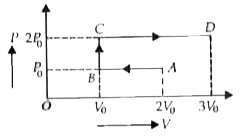 A4P0V0B2P0V0C3P0V0DP0V0
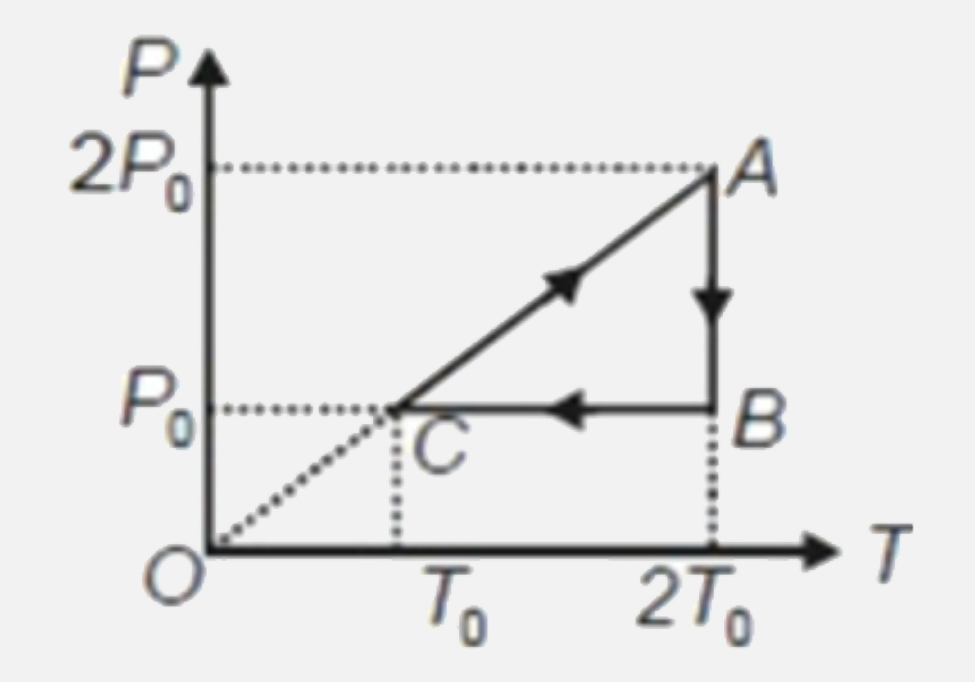
Three moles of an ideal gas undergo a cyclic process shown in figure. The work done by the gas during the process is [Take ln (2)=0.693]
 View Solution
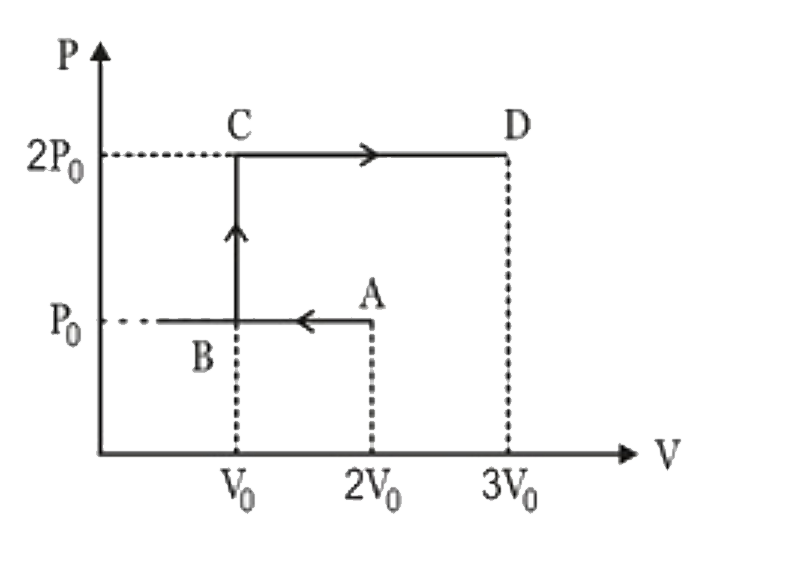
P−V diagram of an ideal gas is as shown in figure. Work done by the gas in process ABCD is
 View Solution
The process on an ideal gas, shown in figure,is <br><imga≤ocr_imageload∈g=lazysrc=https://d10lpgp6xz60nq.cloudfront.net/physics_imagesHCV_VOL2_C24_E01_027_Q01.pngwh=80%mx-autosty≤=background:white;>
View SolutionP – V graph of an ideal gas is as shown in the diagram . Work done by the gas in the process ABCD is
 View Solution
graph of an ideal gas is as shown in figure.
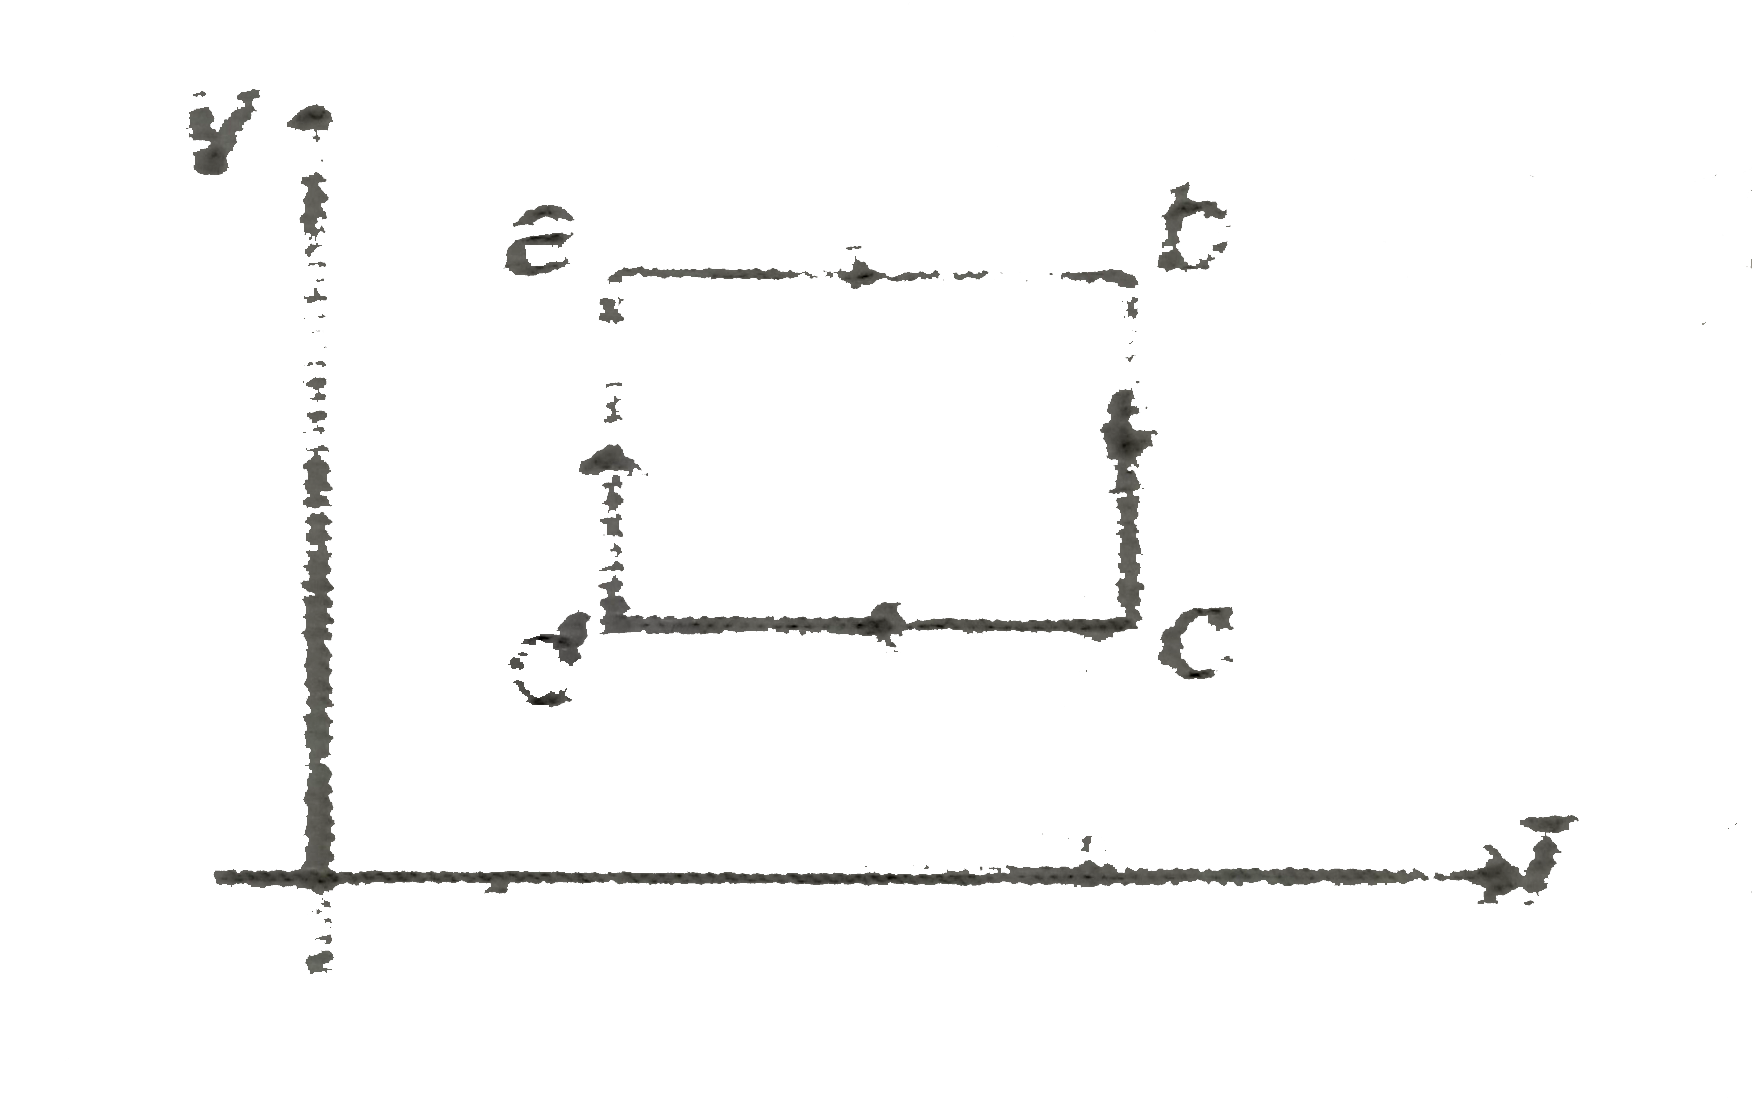
Heat is supplied to the gas in process (s).View Solution


