A ball is thrown vertically upwards. Which of the following graph/graphs represent velocity time graph of the ball during its flight ( air resistance is neglected).
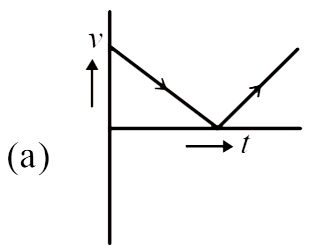
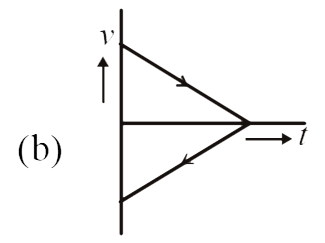
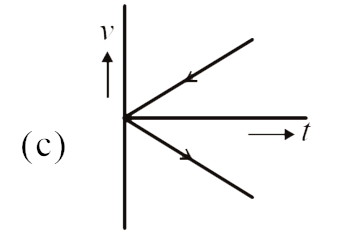
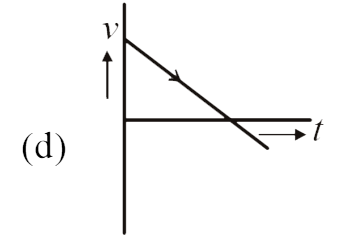
Step by step video & image solution for A ball is thrown vertically upwards. Which of the following graph/graphs represent velocity time graph of the ball during its flight ( air resistance is neglected). by Physics experts to help you in doubts & scoring excellent marks in Class 12 exams.
Topper's Solved these Questions
Similar Questions
Knowledge Check
- Question 1 - Select One
A ball is thrown vertically upwards. Which of the following plots represent the speed graph of the ball during its flight if the air resistence is not ignored?
A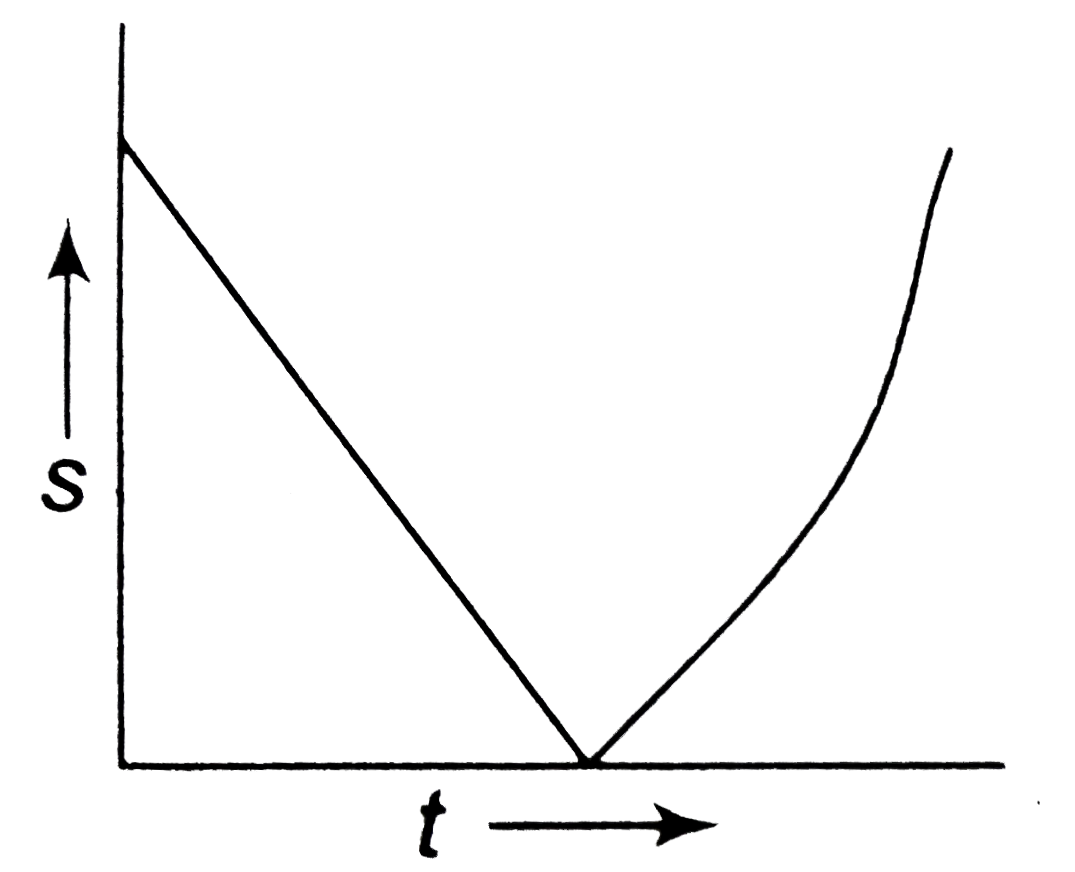 B
B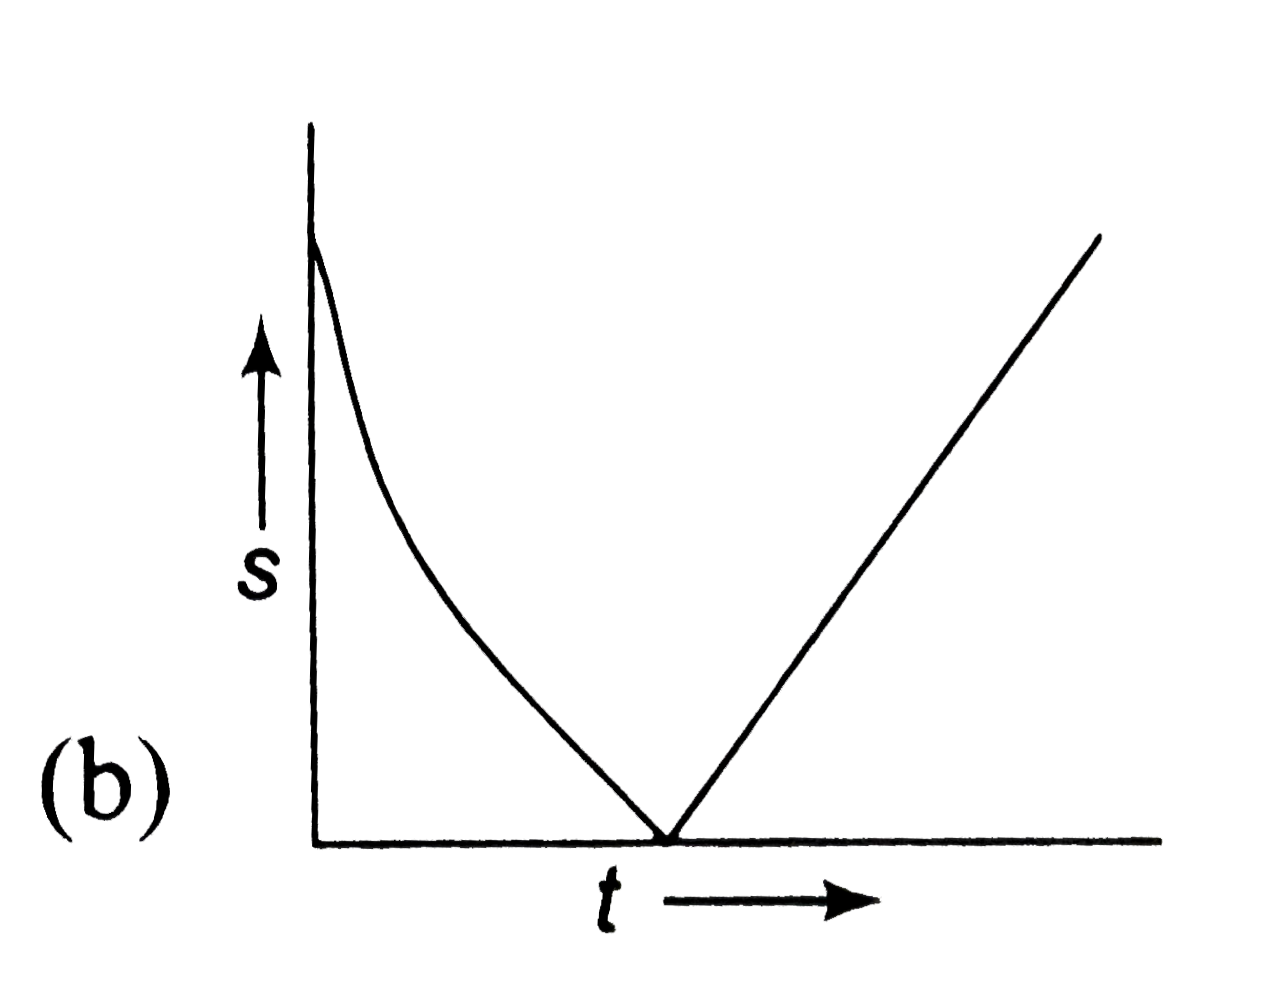 C
C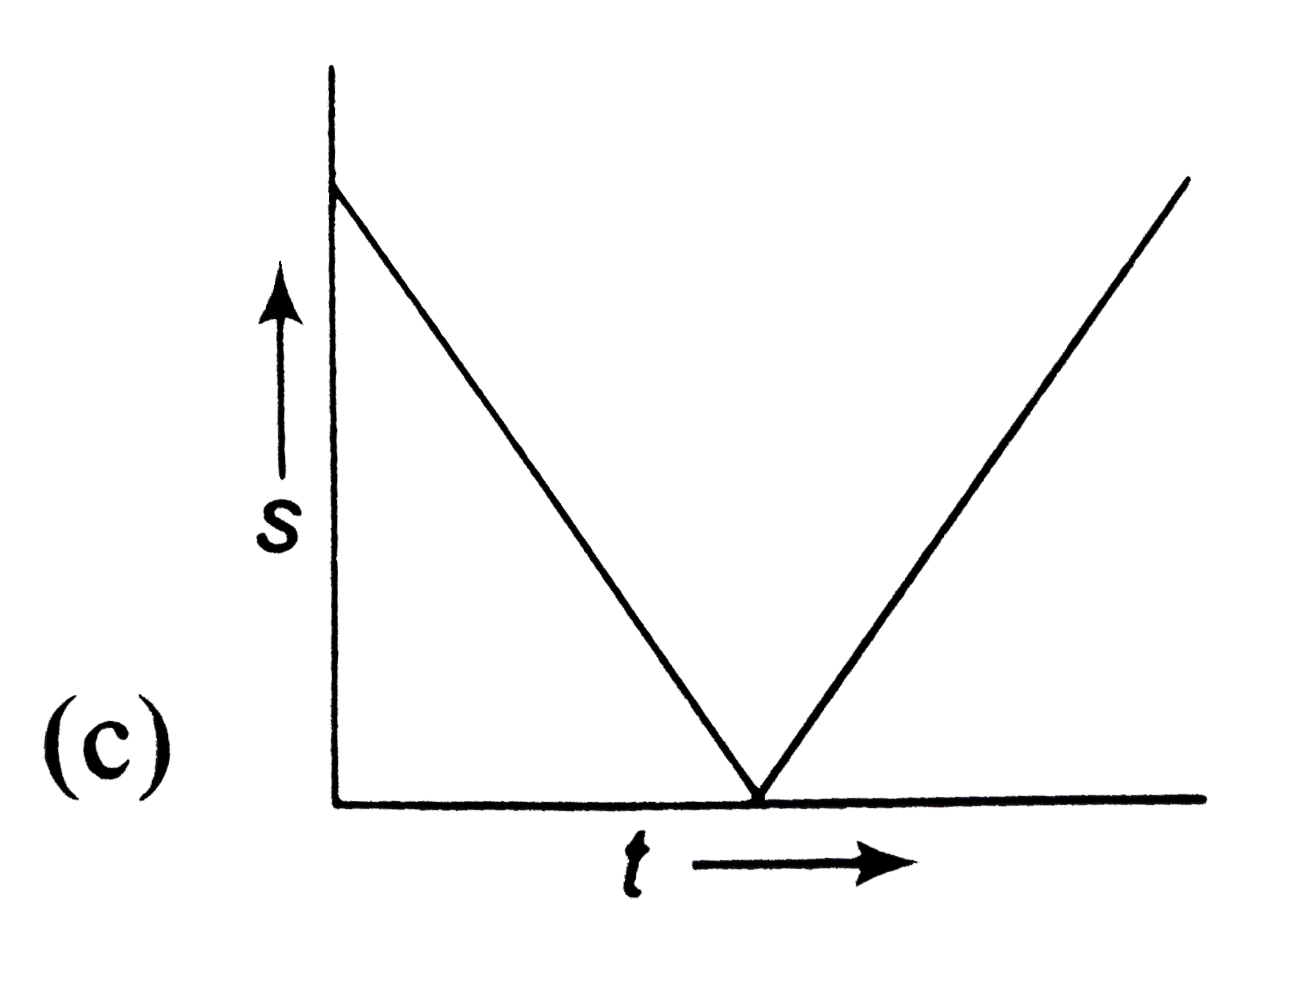 D
D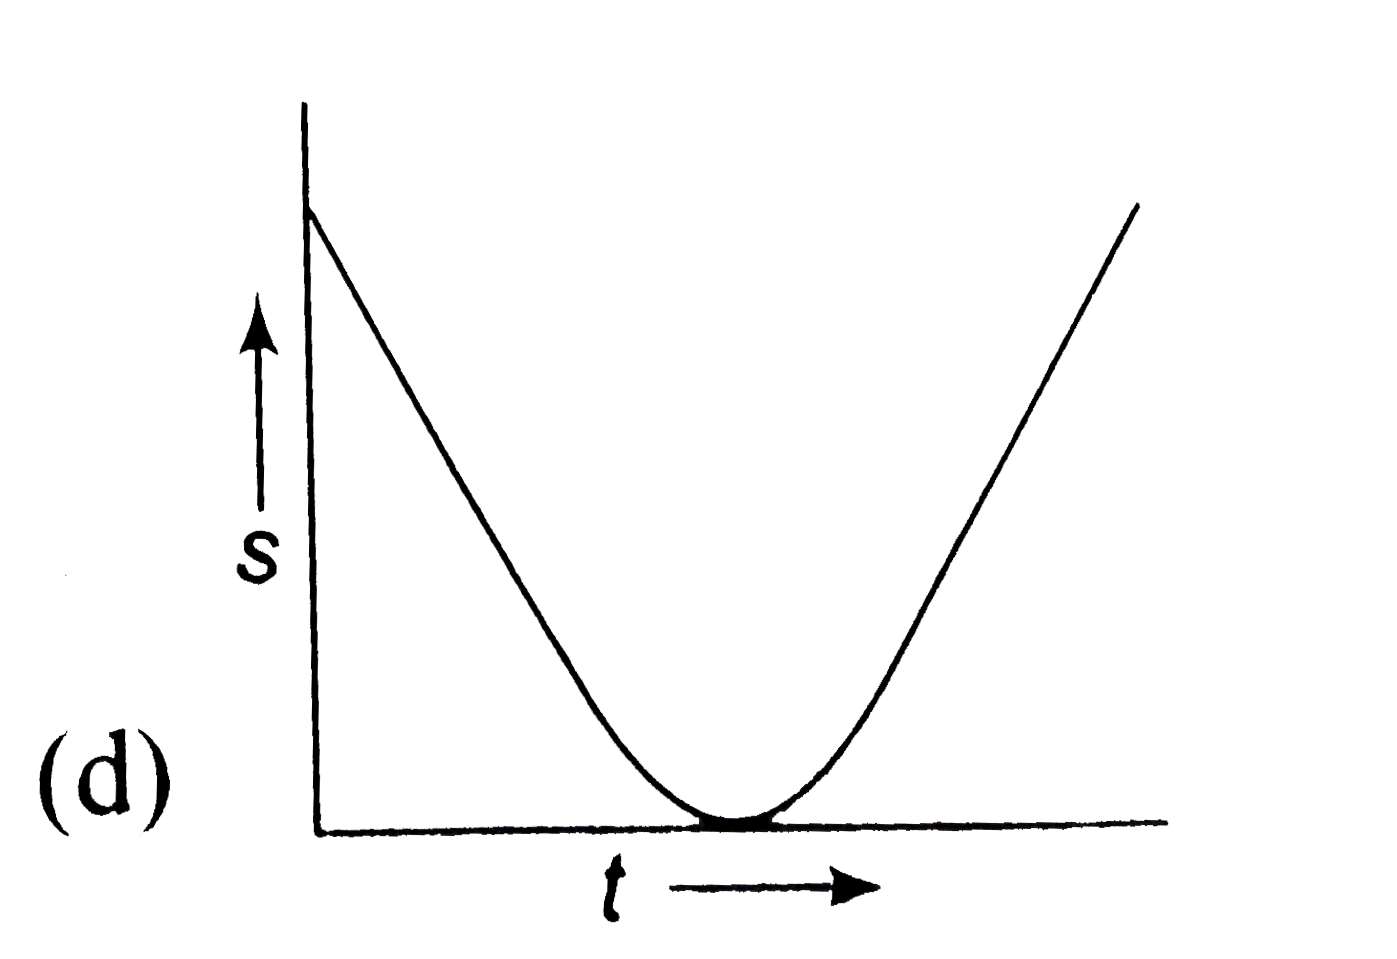
- Question 2 - Select One
A ball is thrown vertically upwards. Which of the following plots represents the speed-time graph of the ball during its height if the air resistance is not ingnored ?
A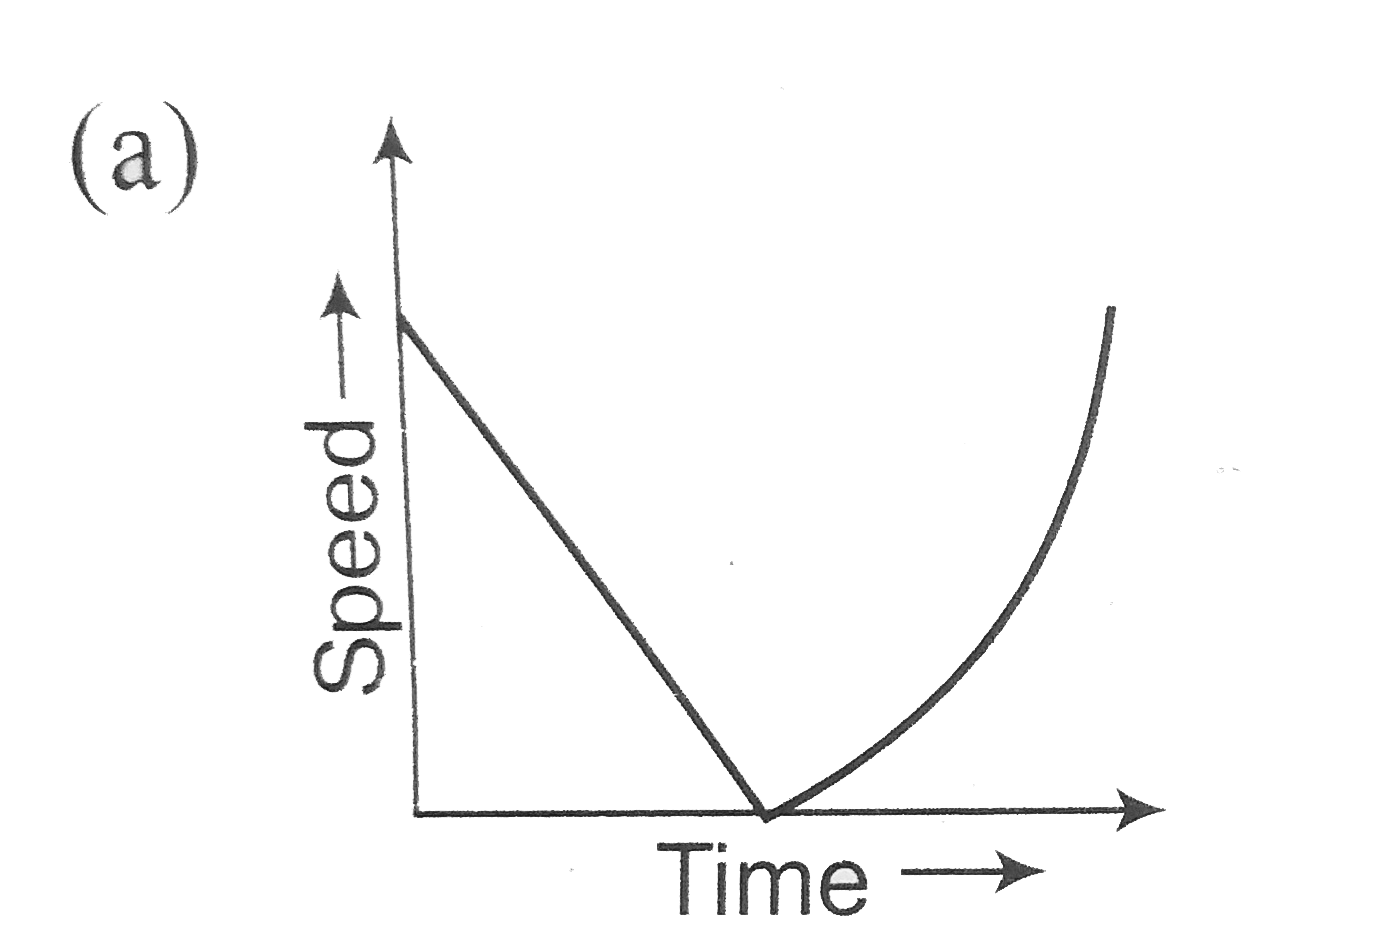 .B
.B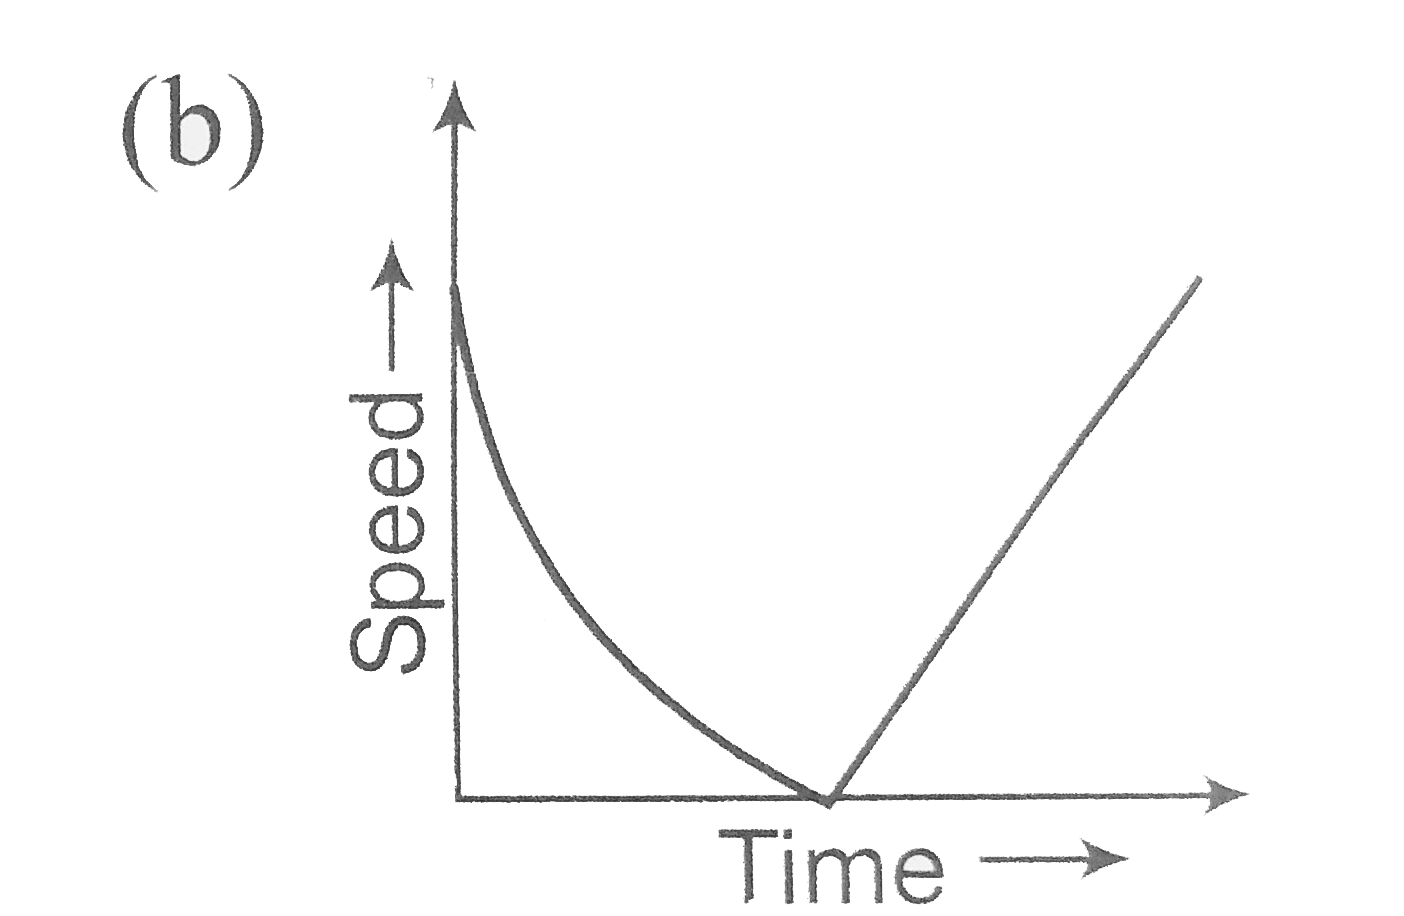 .C
.C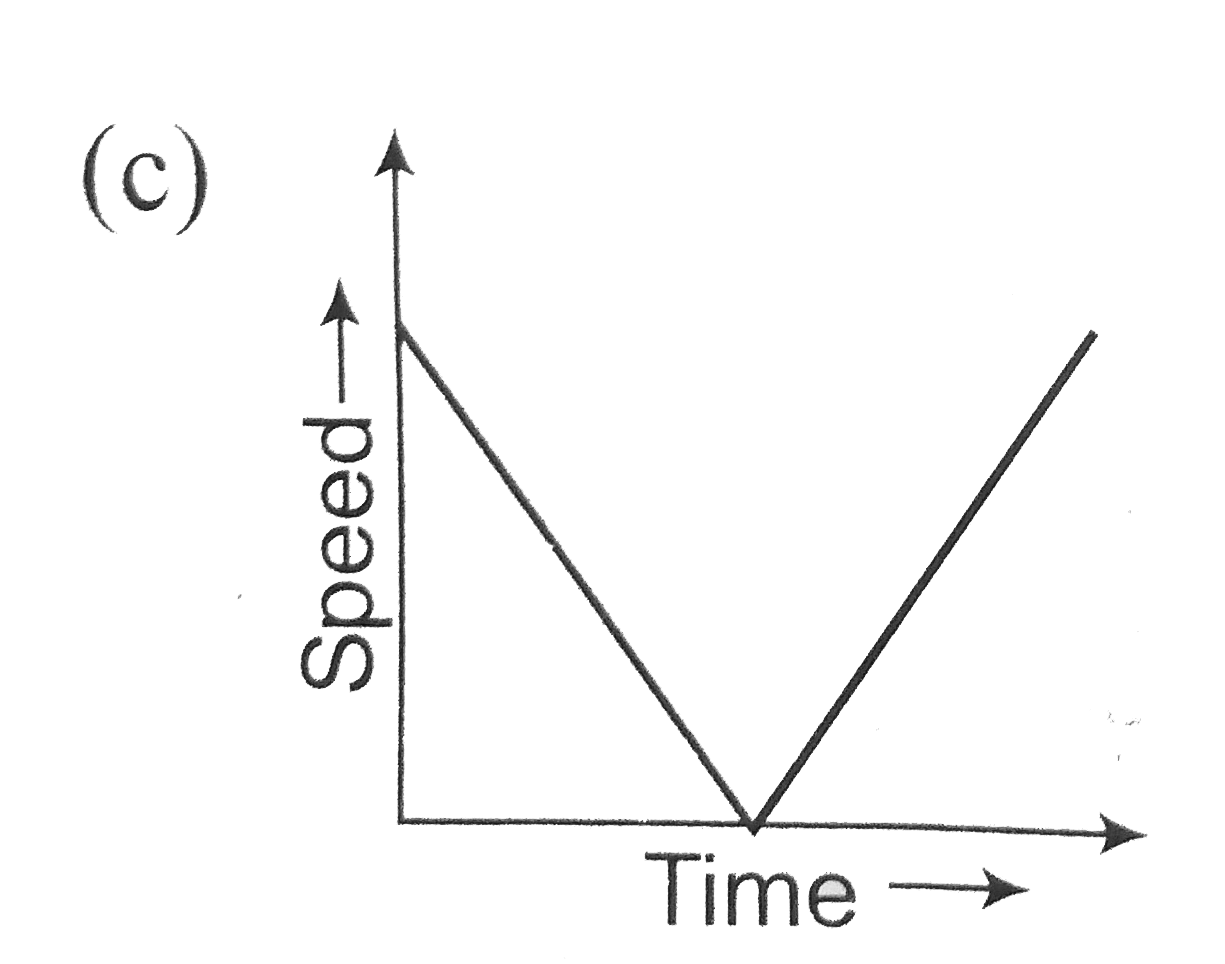 .D
.D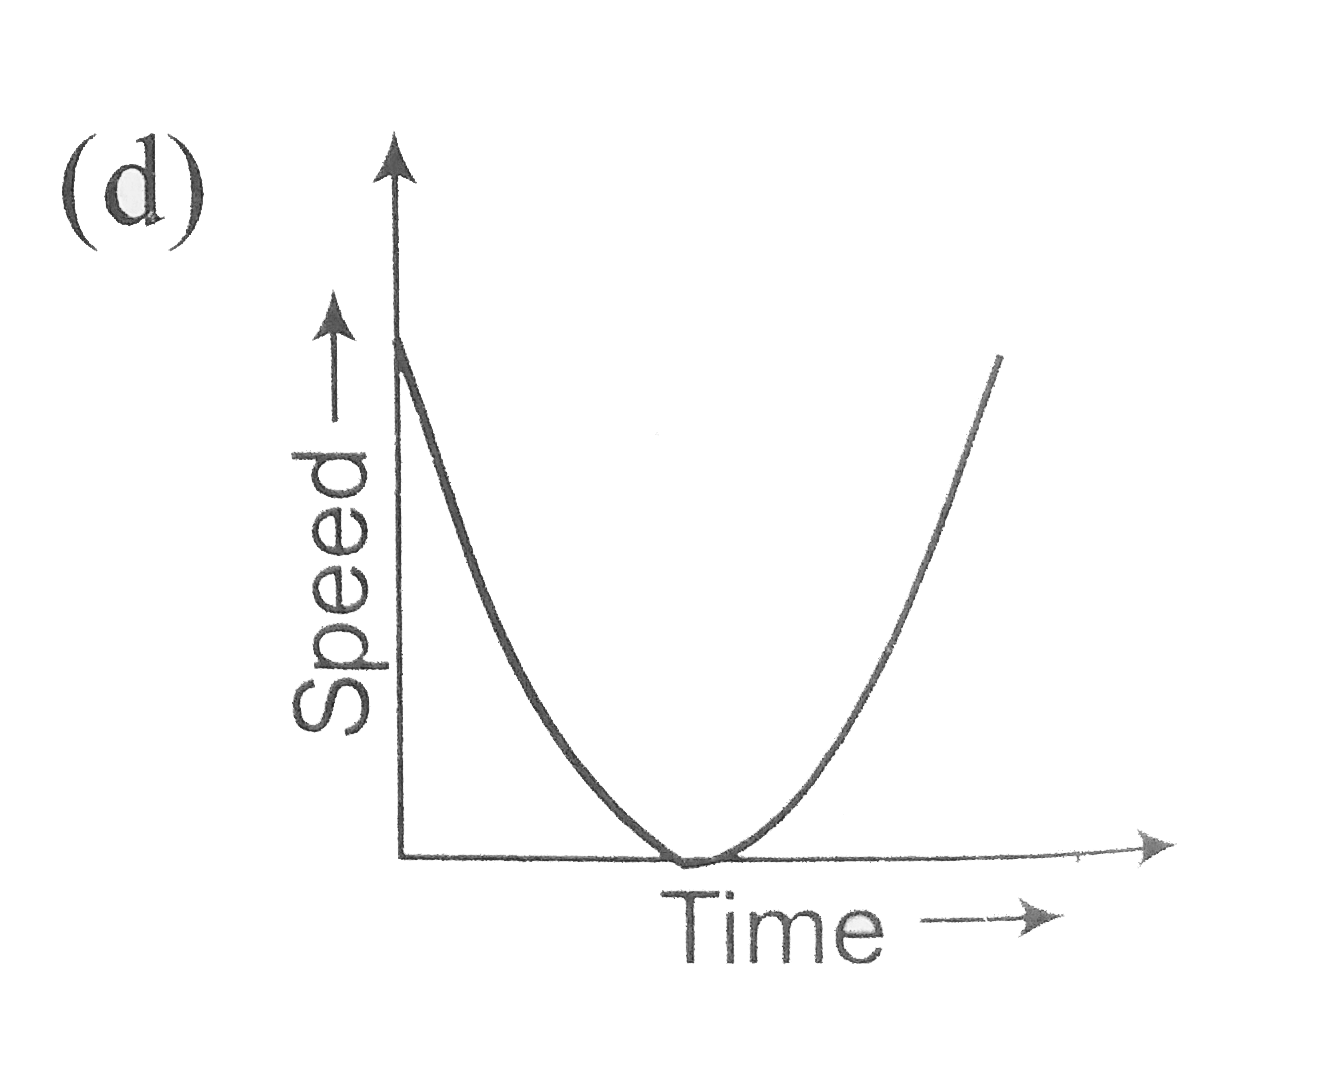 .
. - Question 3 - Select One
A body is thrown vertically upwards. Which one of the following graphs correctly represent the velocity vs time?
A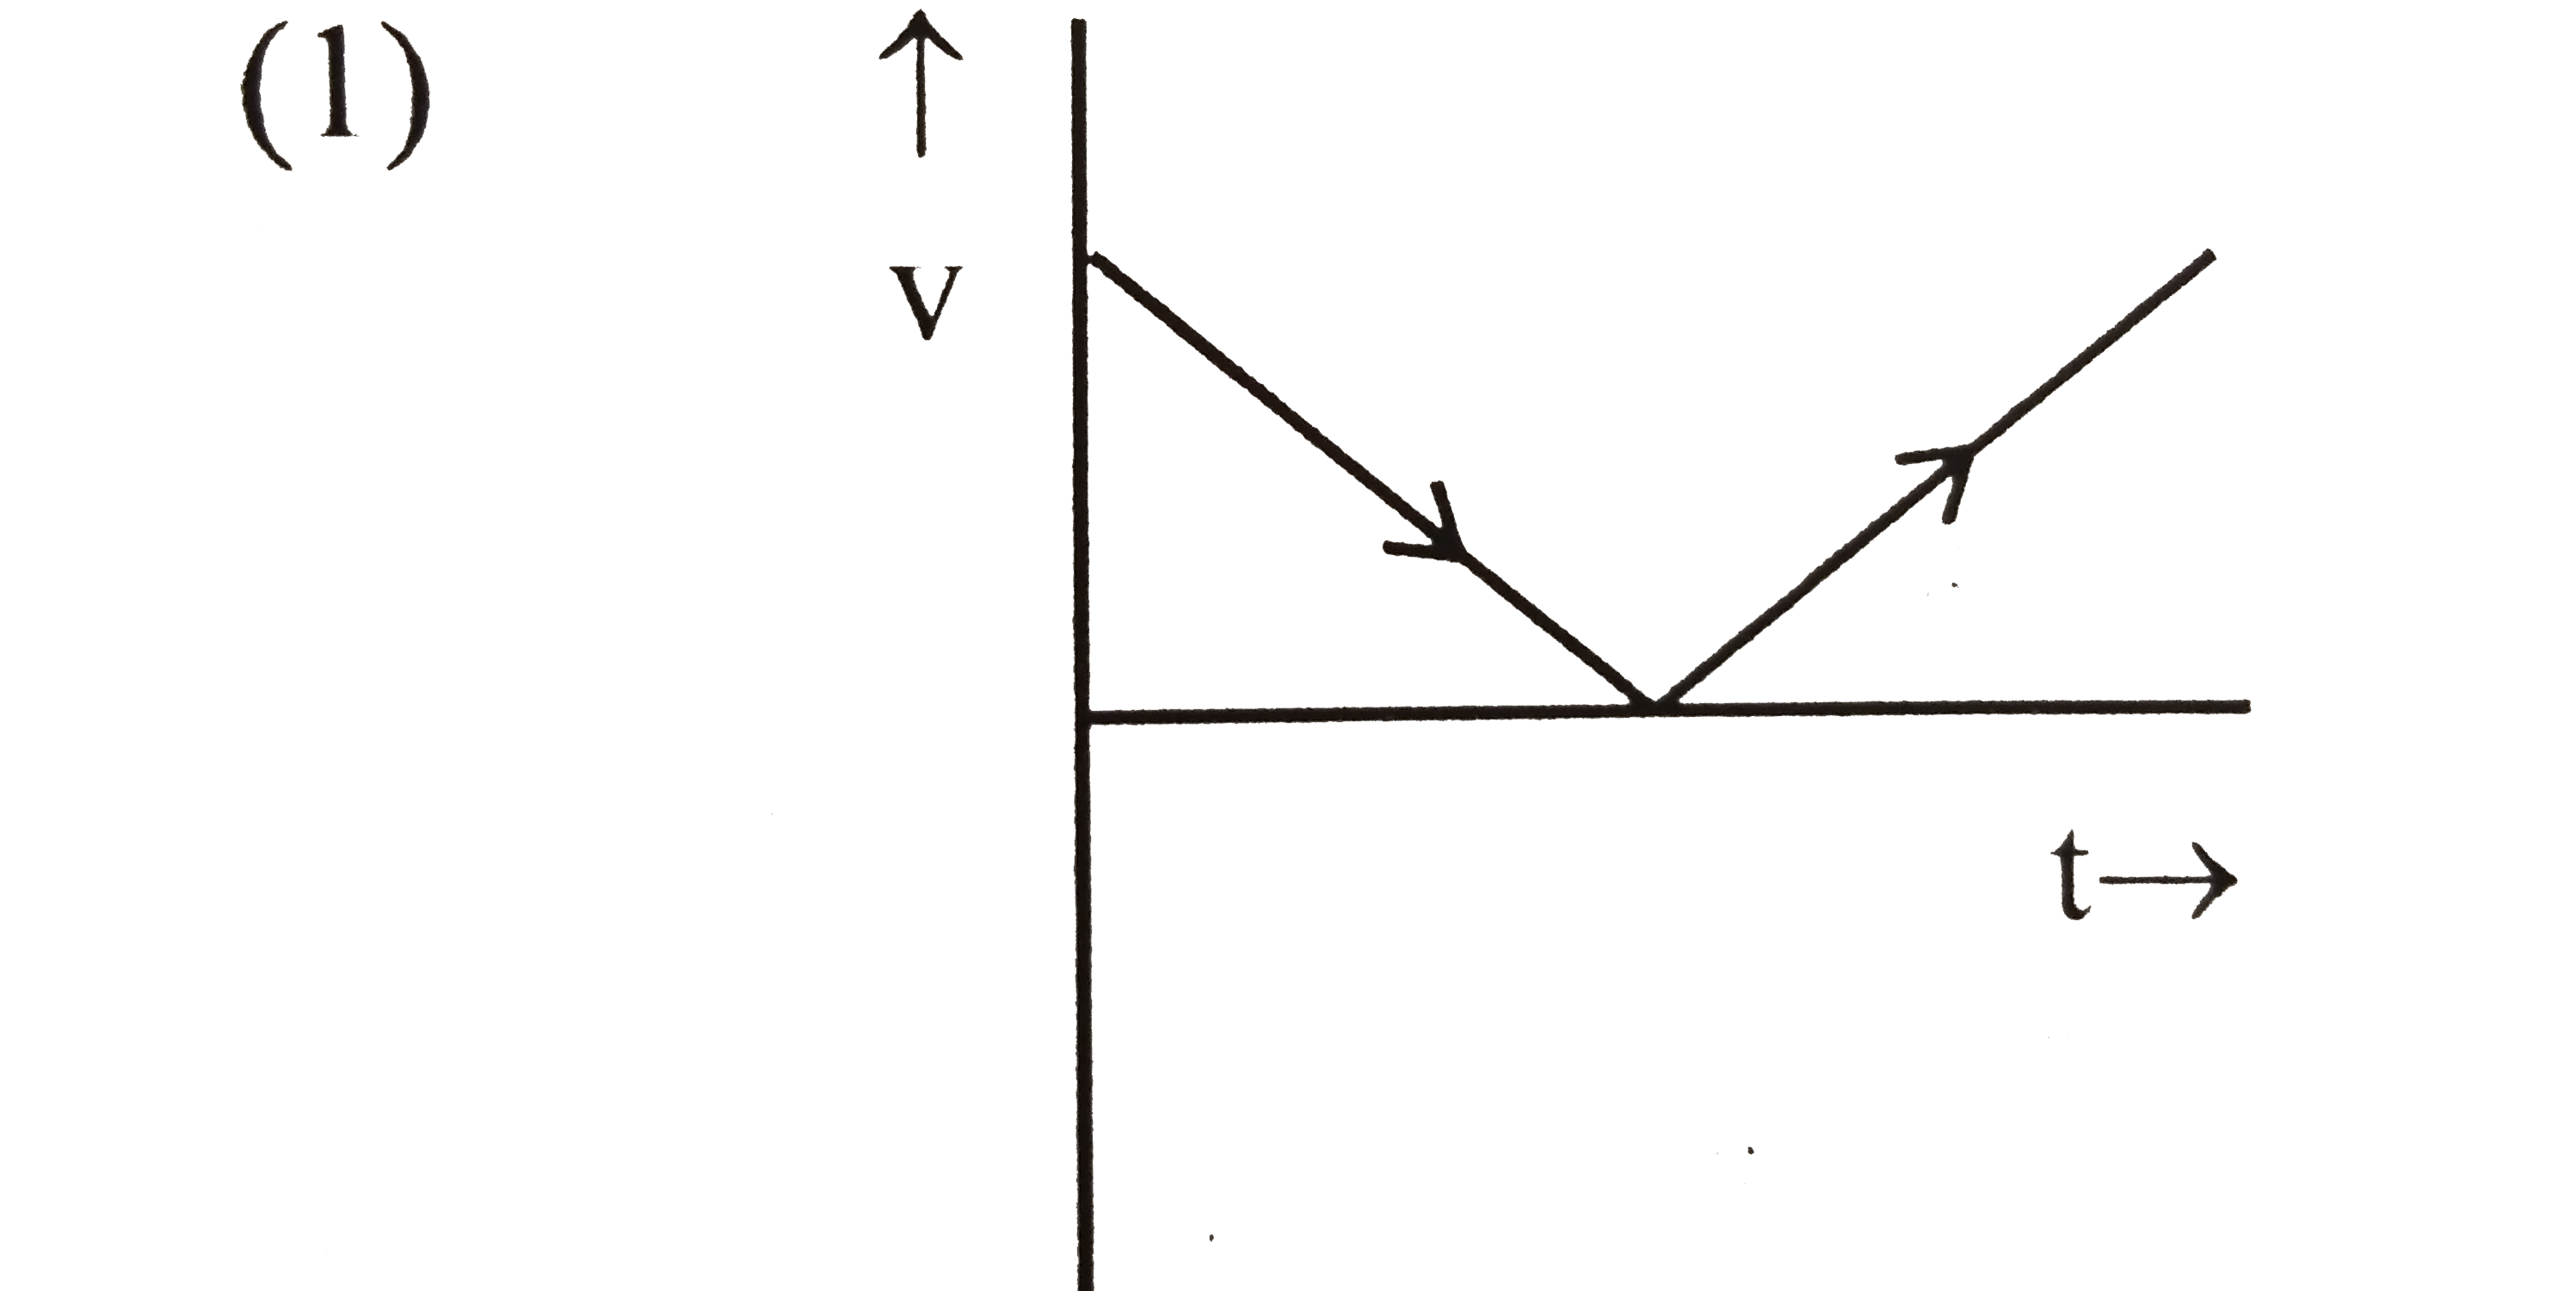 B
B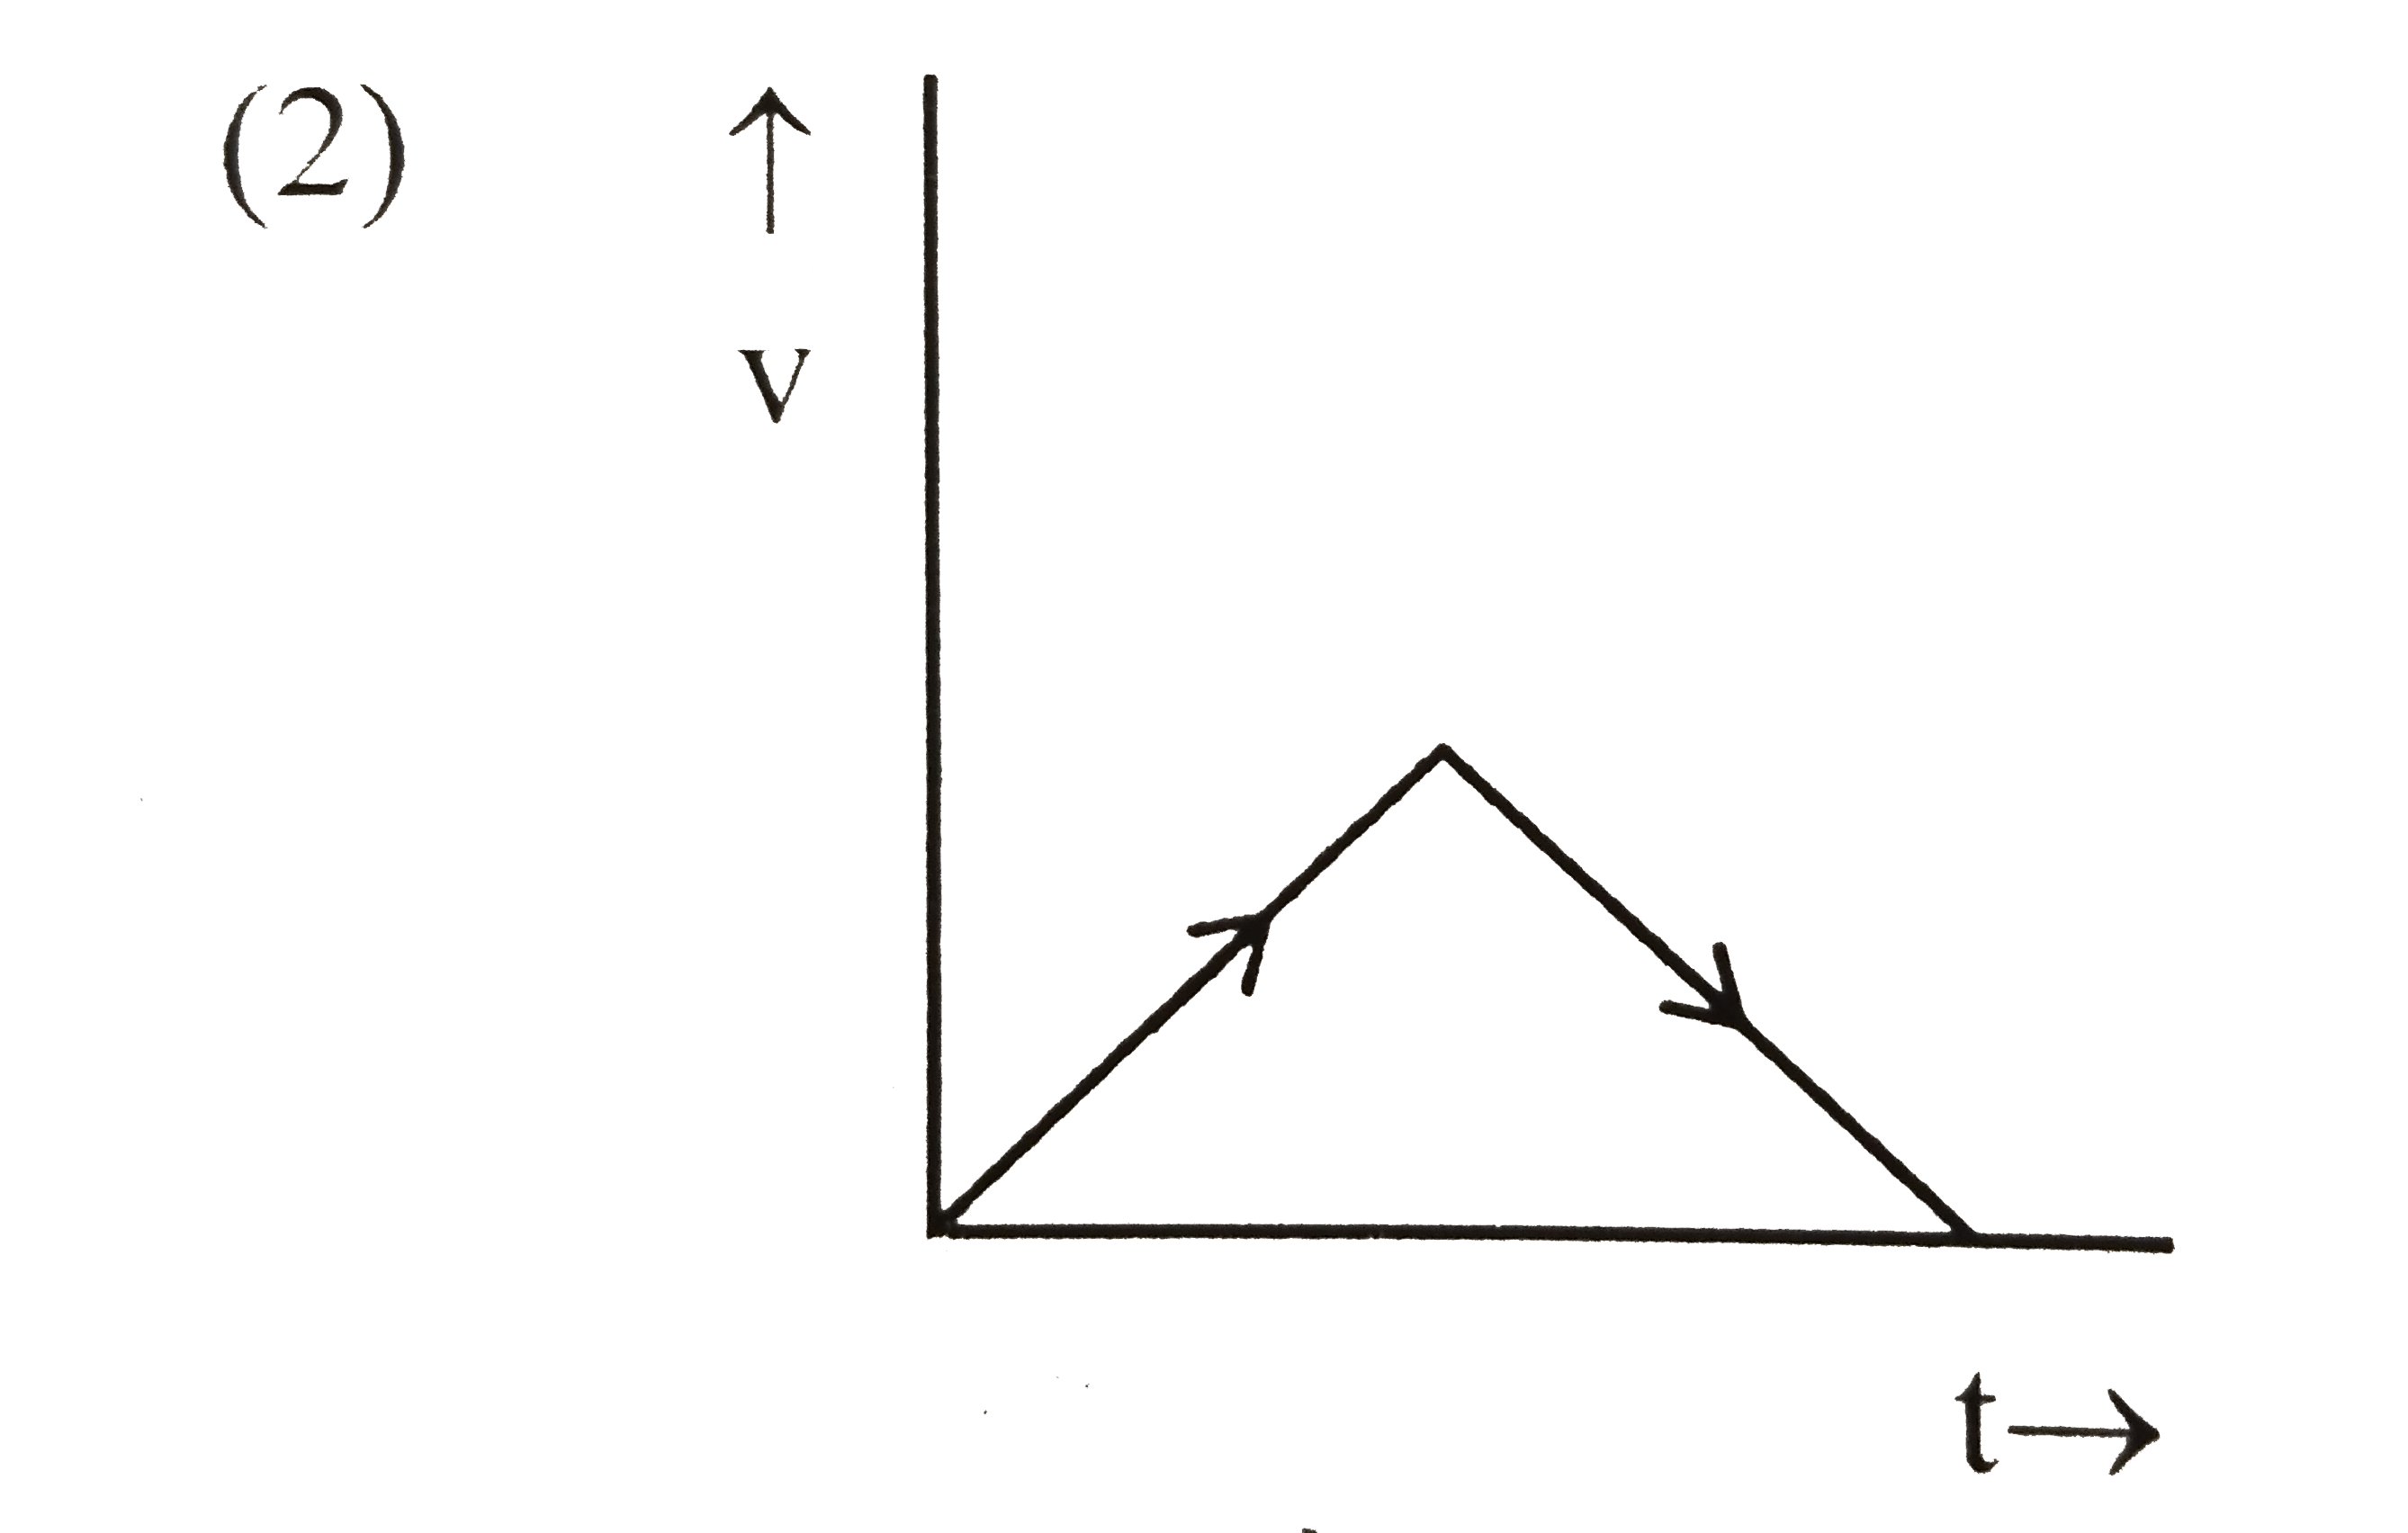 C
C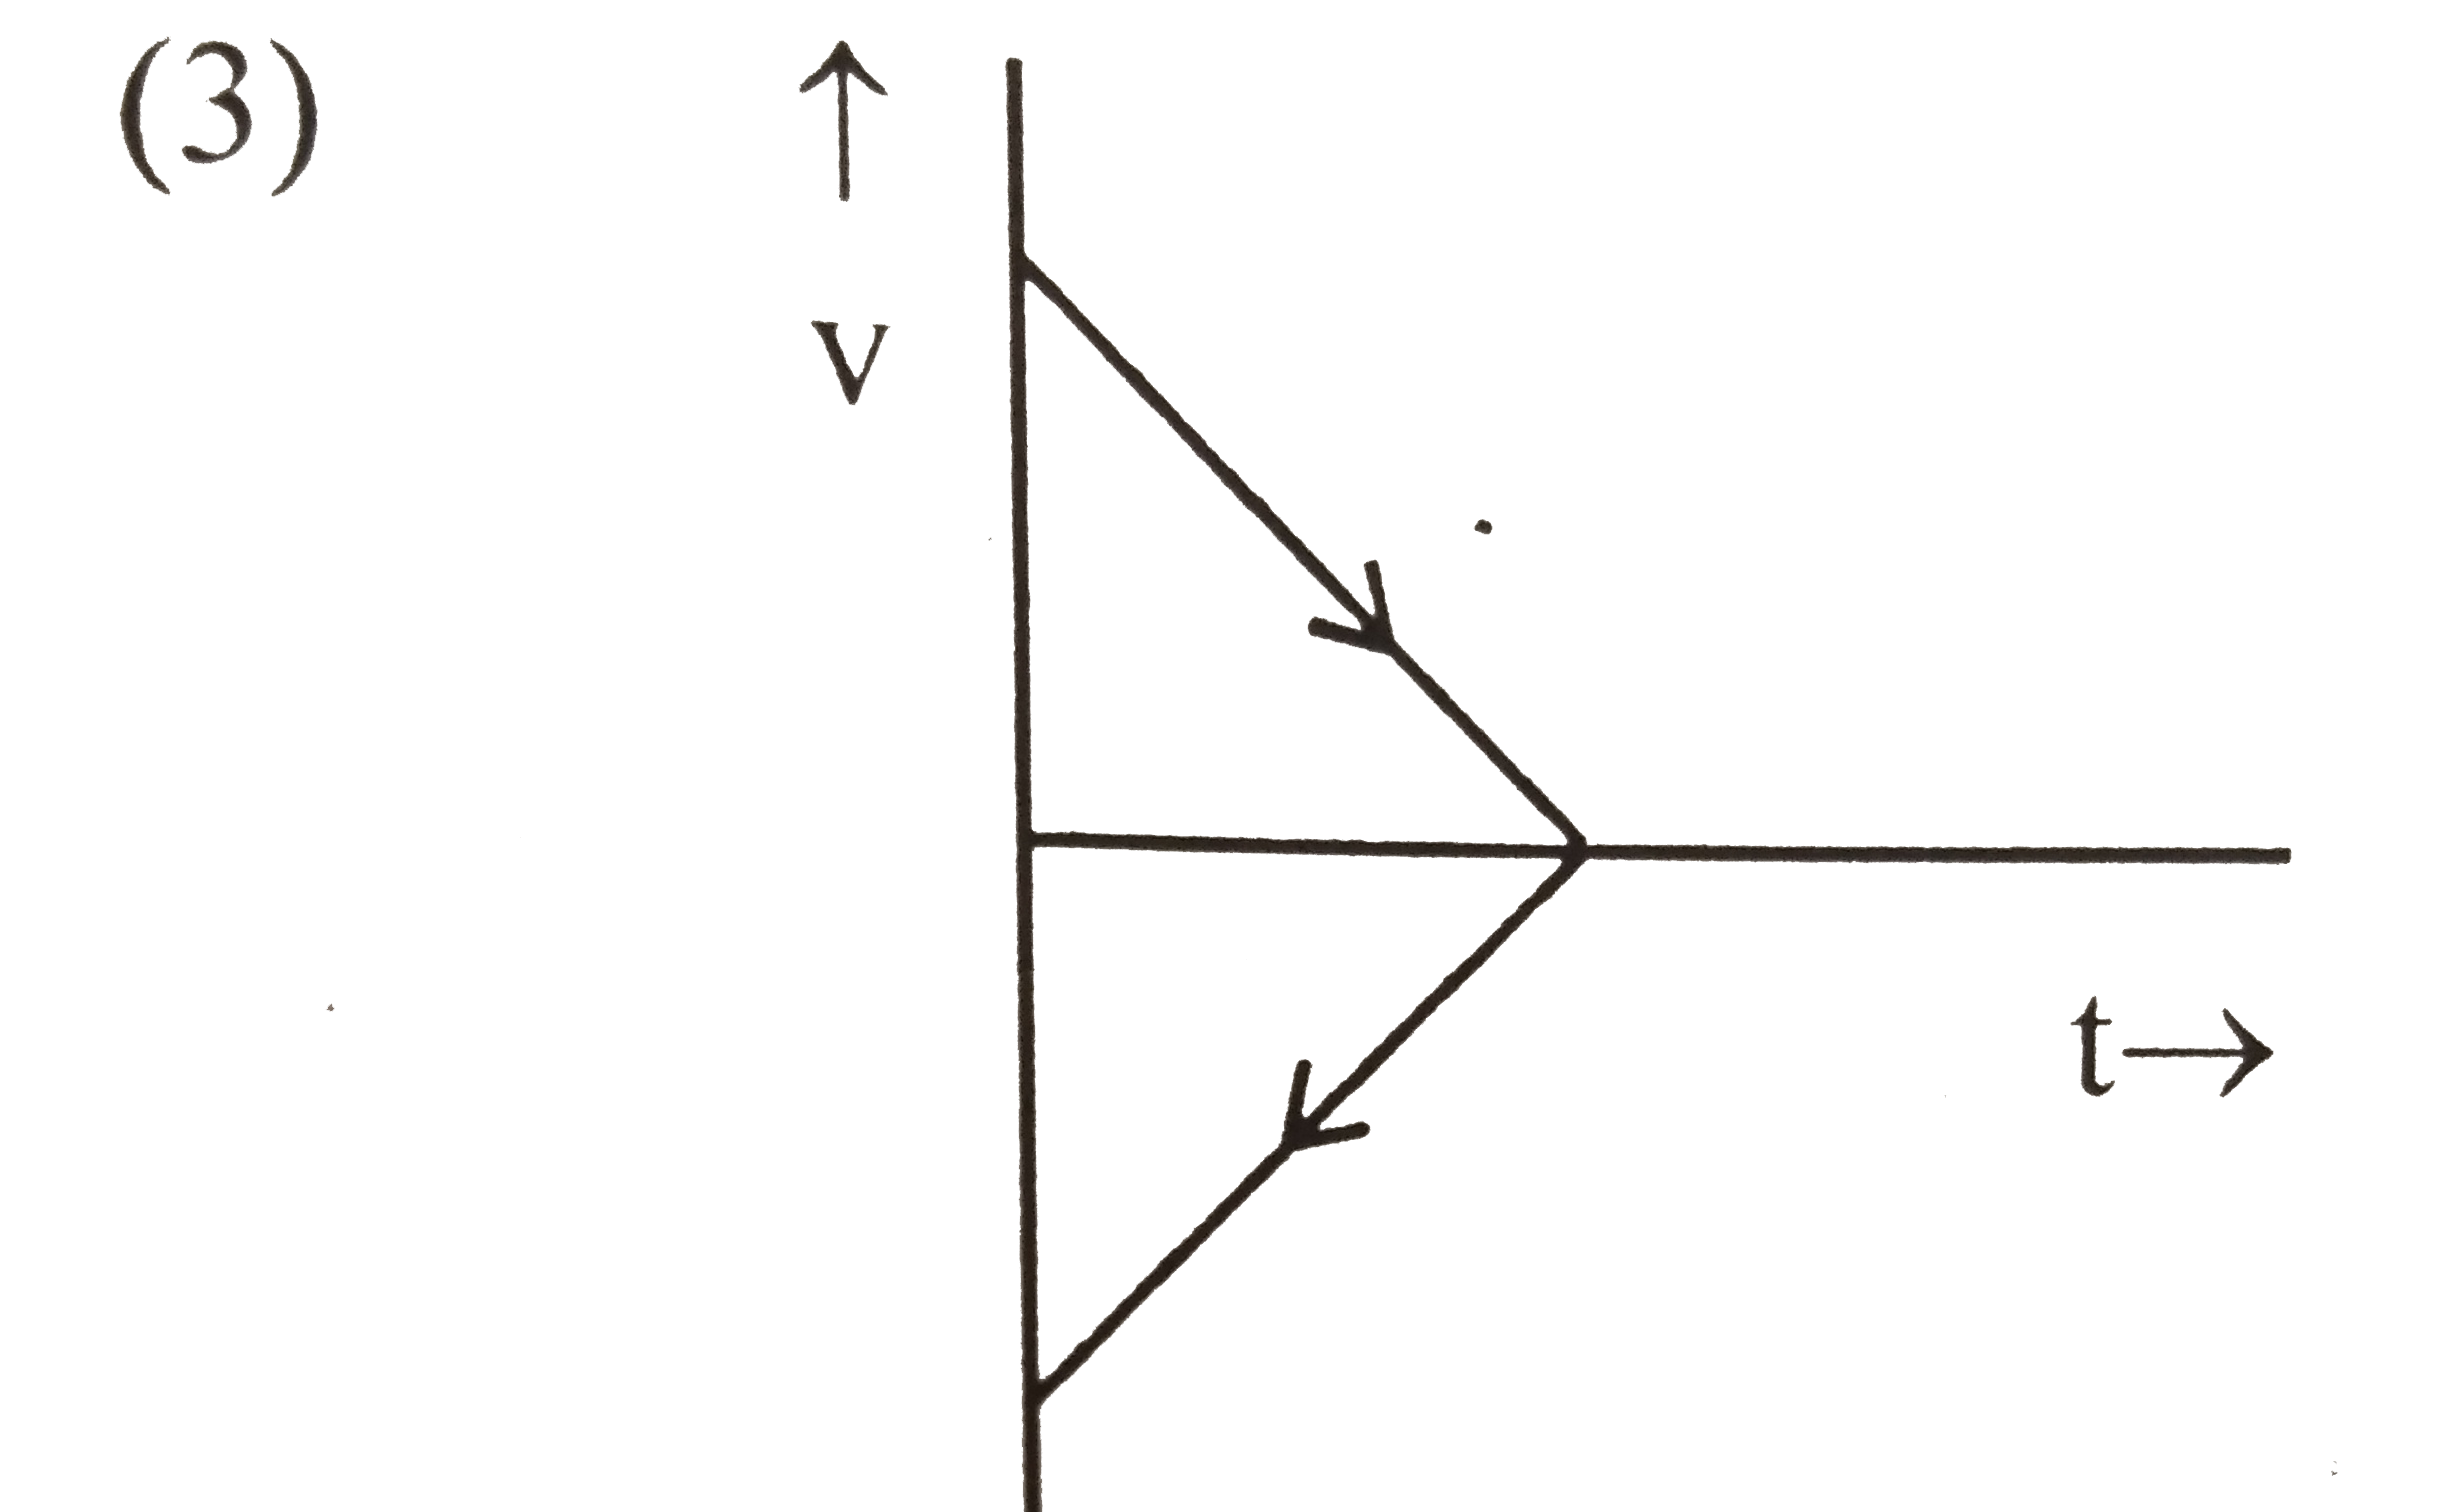 D
D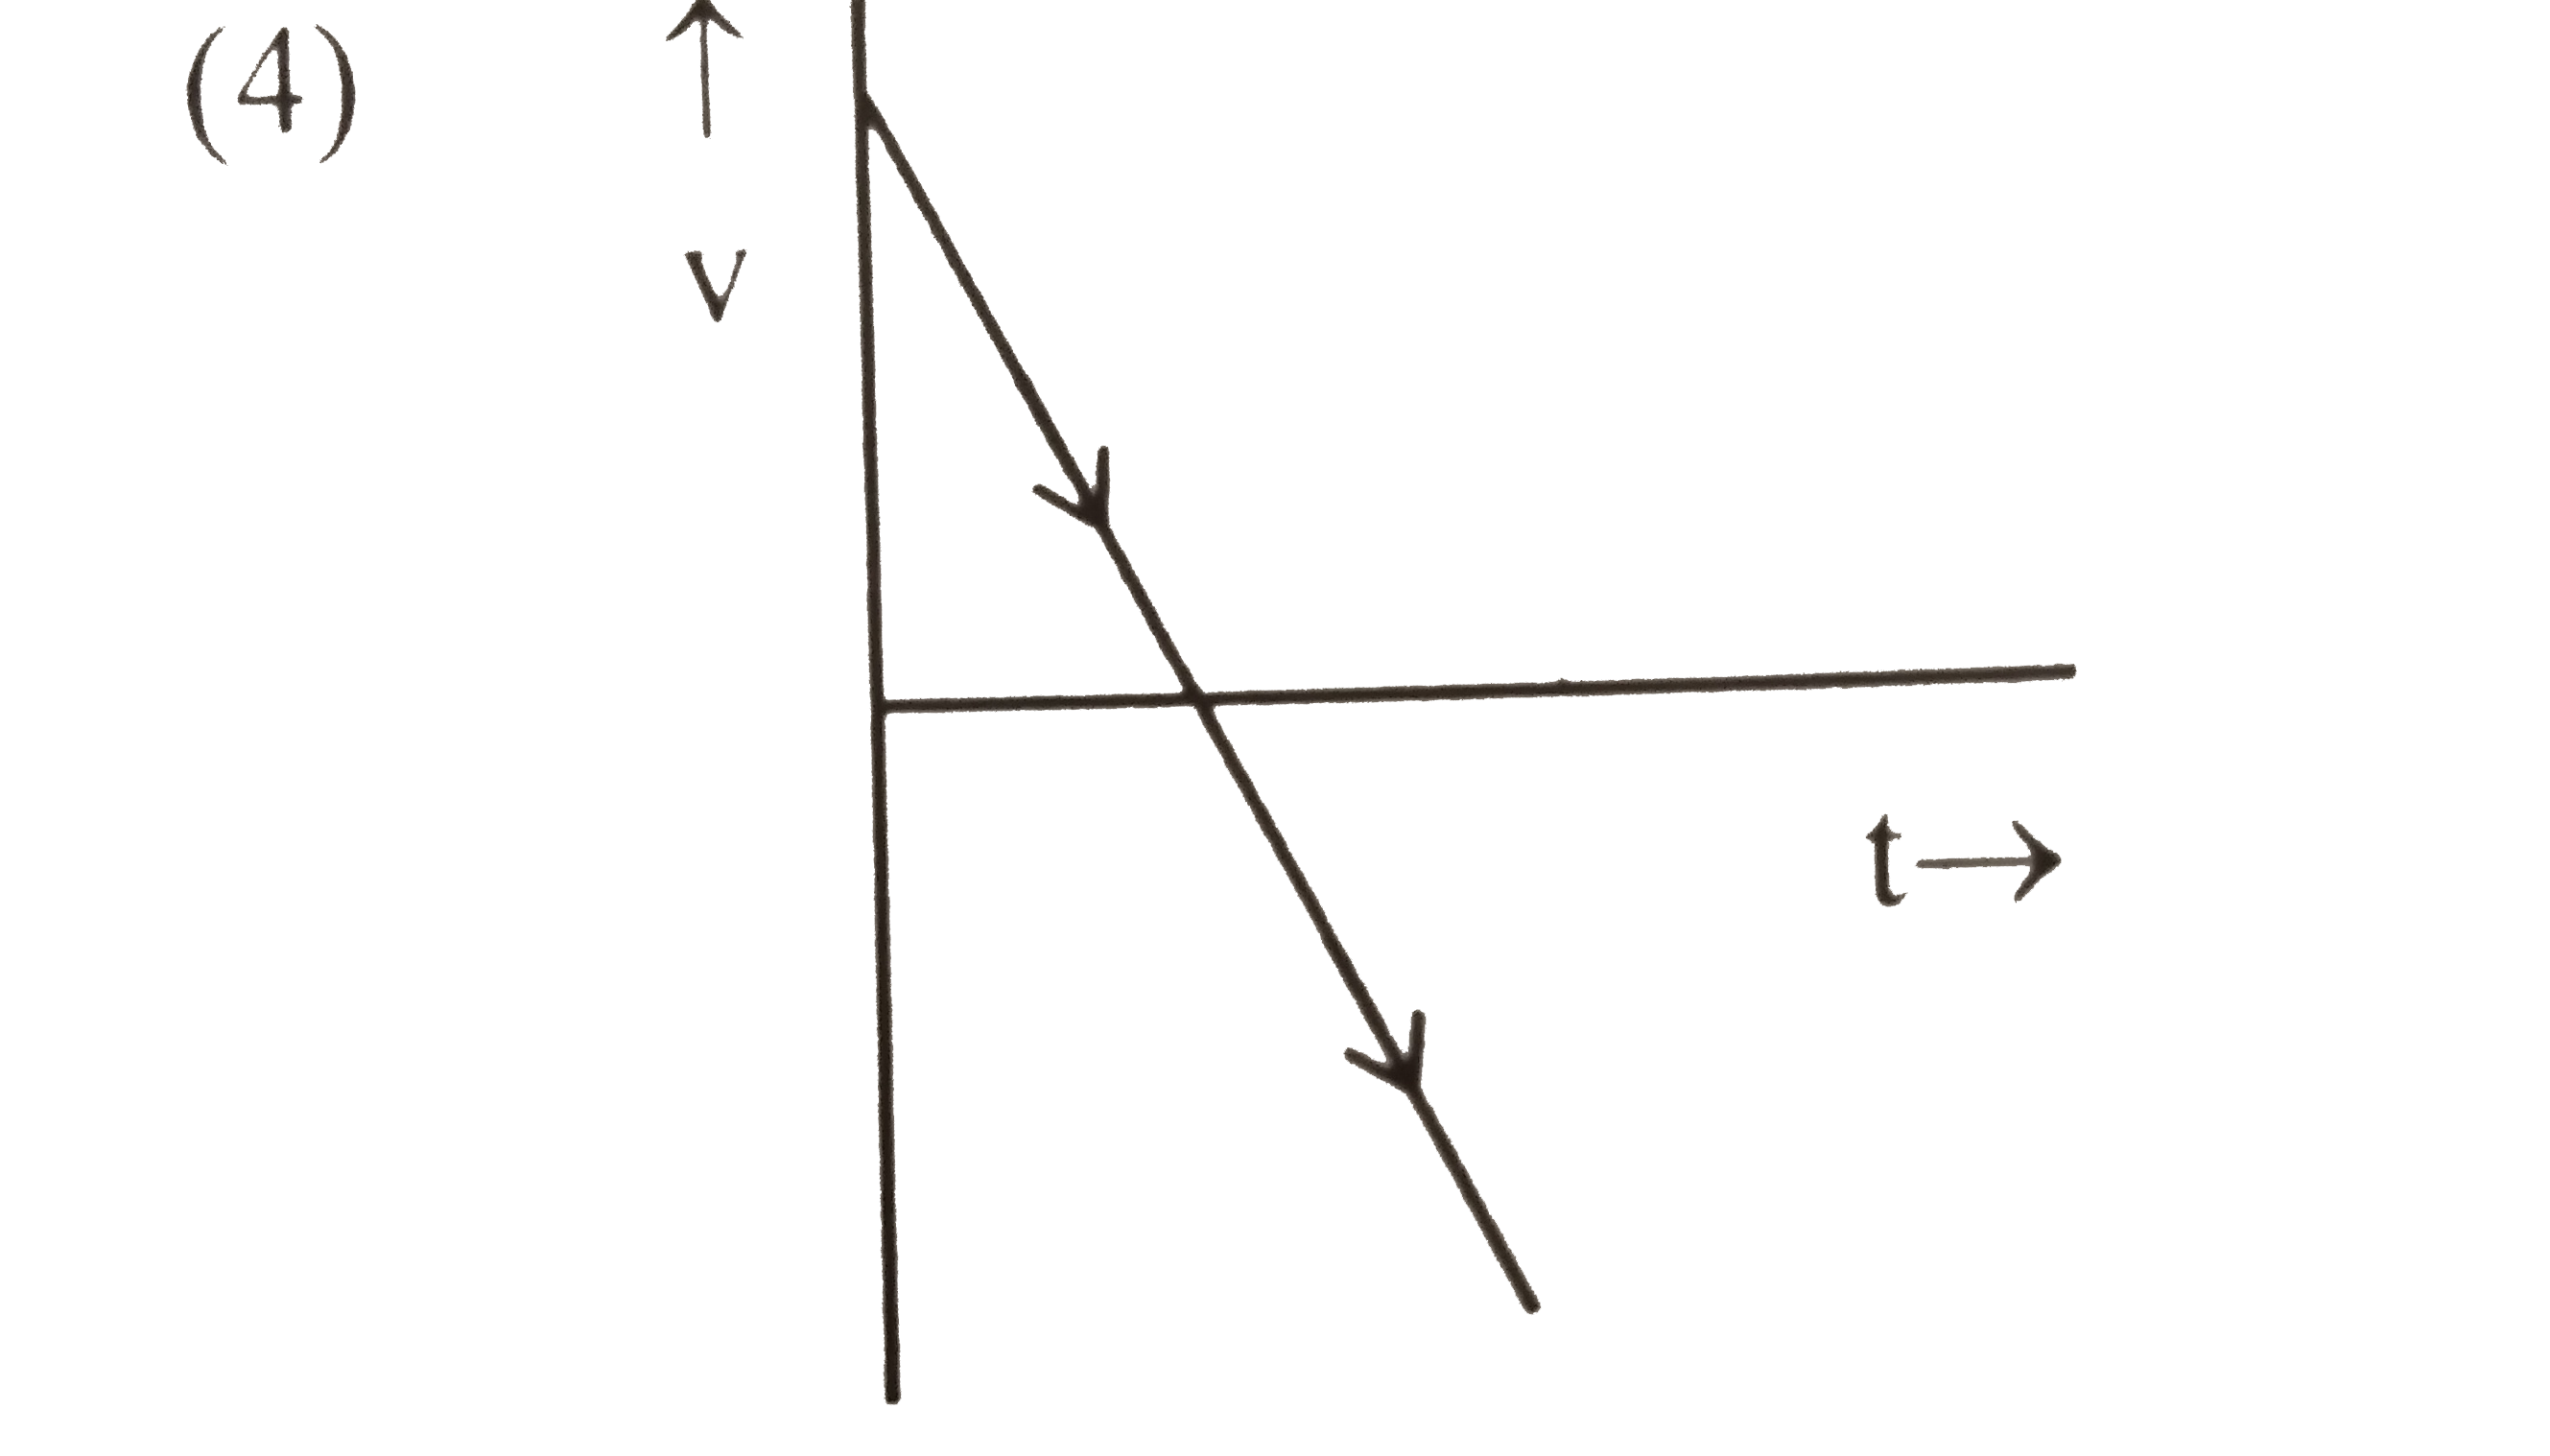
Which of the following graphs represents ohmic resistance?
View SolutionWhich of the following graphs represents the velocity-time relationship for a falling apple?
View SolutionA ball is projected vertically up with an initial velocity. Which of the following graphs represents the KE of the ball?
View SolutionWhich of the following graphs represents the position time-graph of a particle moving with negative velocity?
View SolutionA body is thrown vertically upwards which graph represents variation of velocity w.r.t time
View Solution

