The diagram given here is the representation of 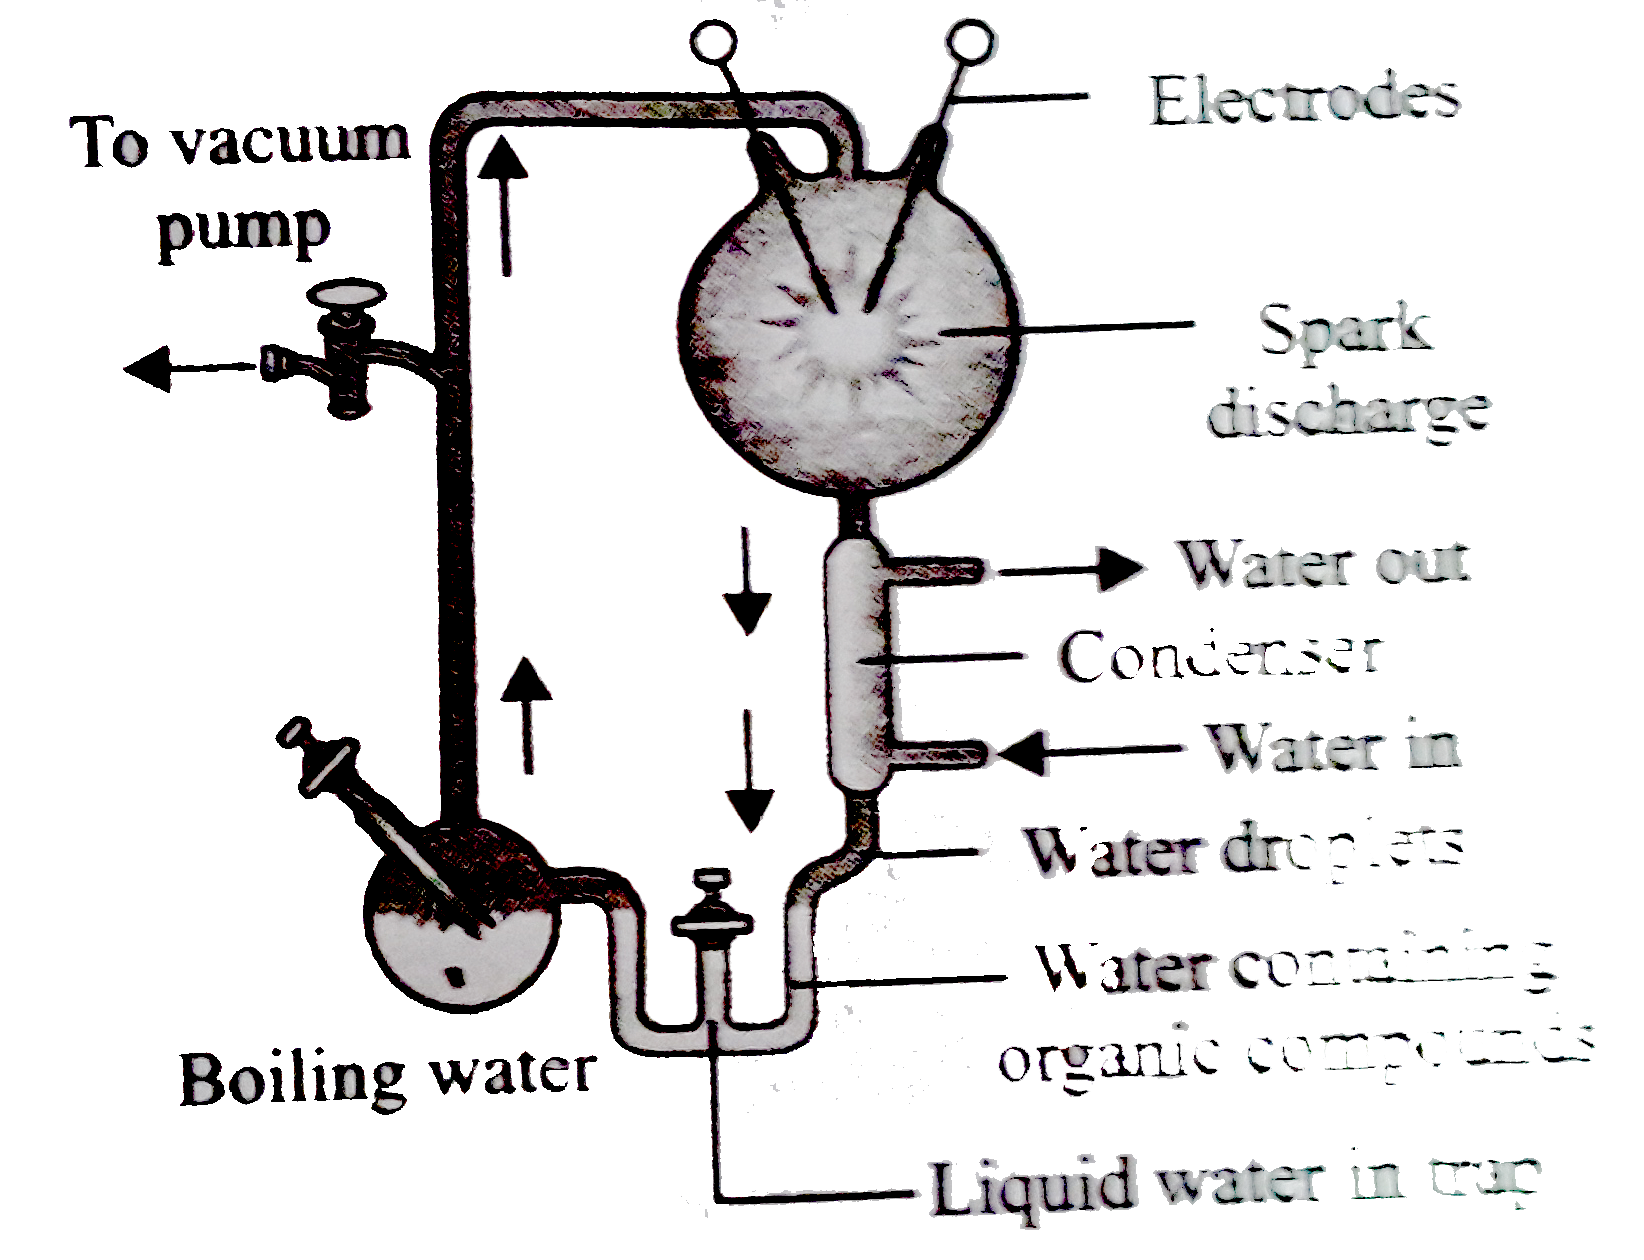
Miller's experiment
Redi's experiment
Louis pasteur's experiment
Spallanzani's experiment
The correct Answer is:A
Step by step video, text & image solution for The diagram given here is the representation of by Biology experts to help you in doubts & scoring excellent marks in Class 12 exams.
Topper's Solved these Questions
Similar Questions
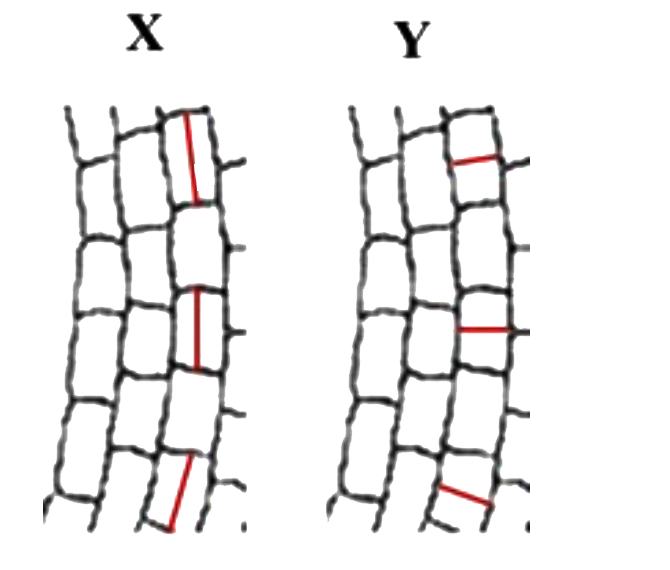
During the formation of gametophytes and embryo in angiosperms, the cell undergo two types of cell divisions. The diagram given below is a representation of them. The red lines indicate their plane of division . What is the correct type of X and Y ?
 View Solution
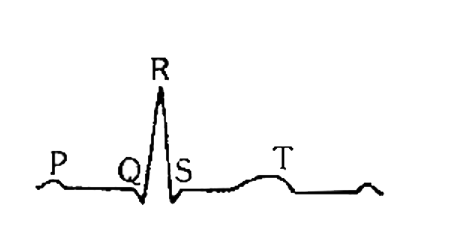
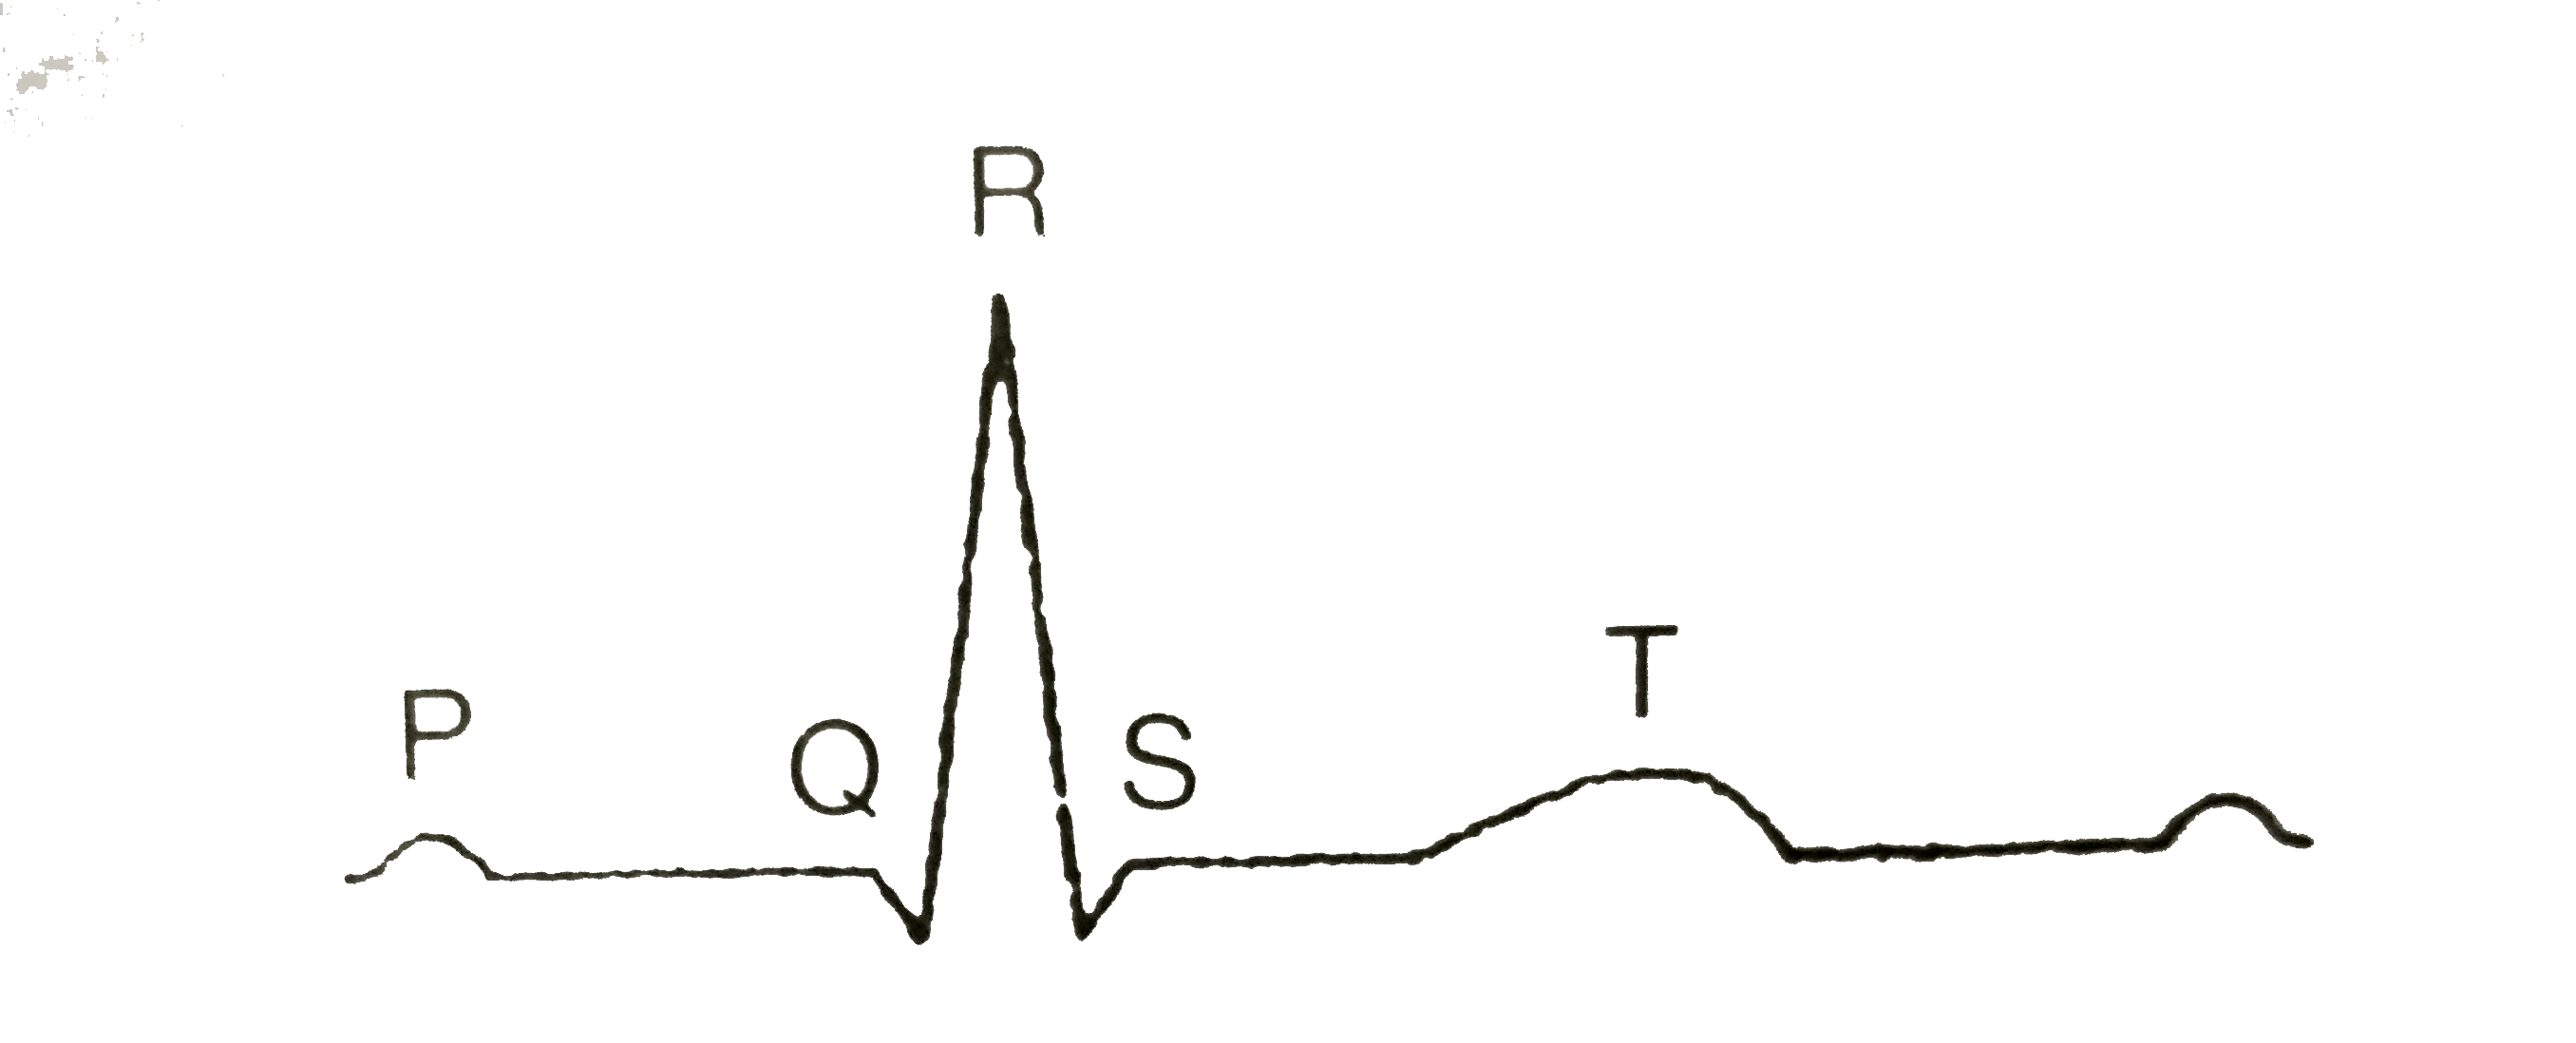
The diagram given here is the standard ECG of a normal person. The P-wave represents the :
 View Solution
Knowledge Check
- Question 1 - Select One
The diagram given here is the standard ECG of a normal person, the P-wave represents the
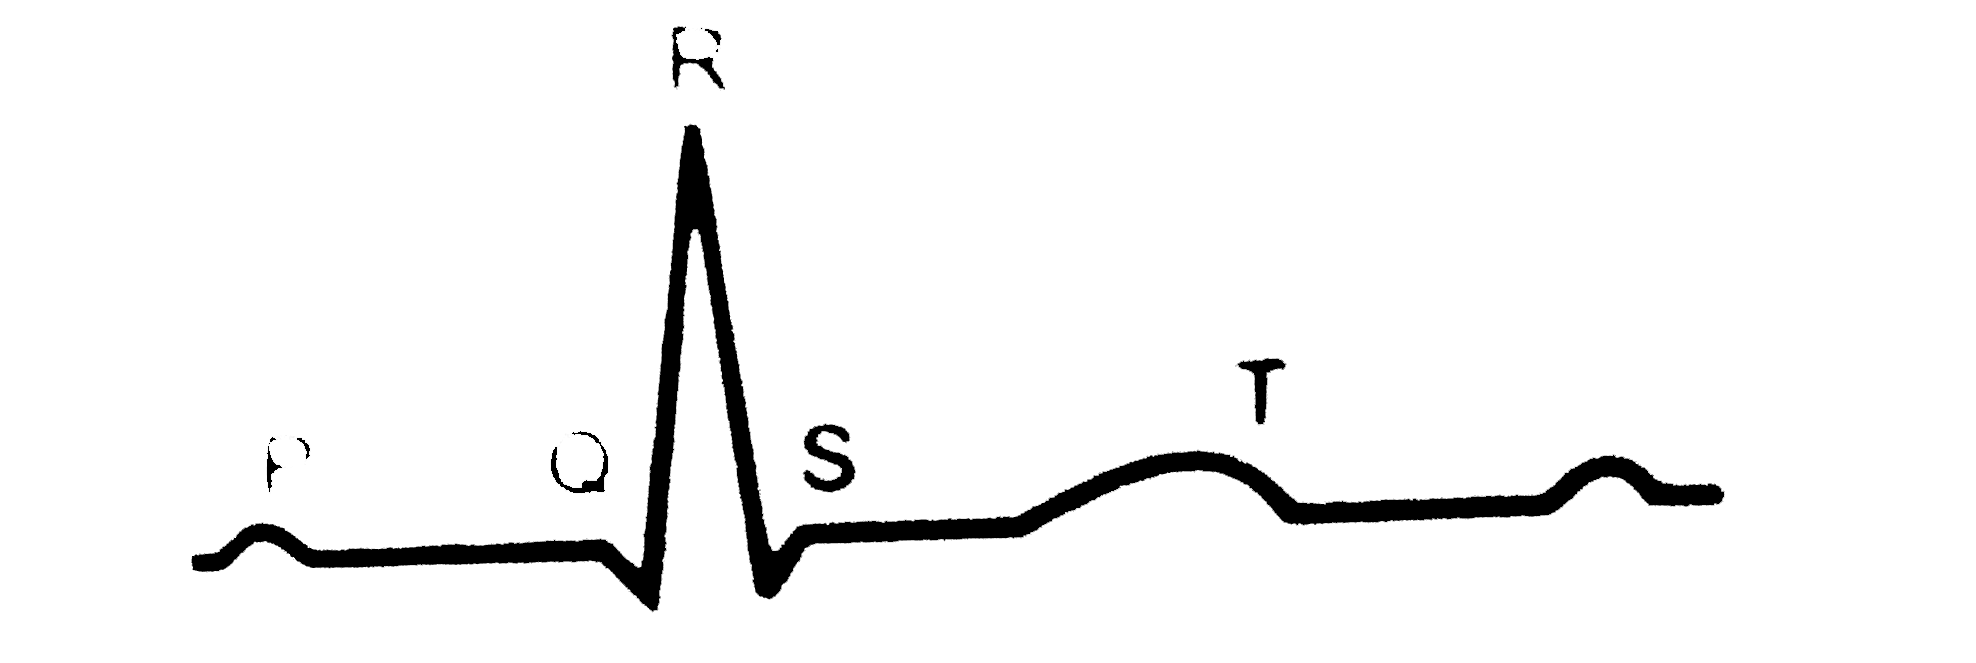 AInitiatio of the ventricular contractionBBeginning of the systoleCEnd of systoleDContraction of both the atria
 - Question 2 - Select One
The diagram given here is the standard ECG of a normal person. The P-wave represents the
 AEnd of systoleBContraction of both the atriaCInitiation of the ventricular contractionDBeginning of the systole
 - Question 3 - Select One
The diagram given here is the standard ECG of a normal person, The P-wave represents the:
 AInitiation of the ventricular contractionBBeginning of the systoleCEnd of systoleDContraction of both the atria
The diagram given here is the standard ECG of a normal person.The P-wave represents the
 View Solution
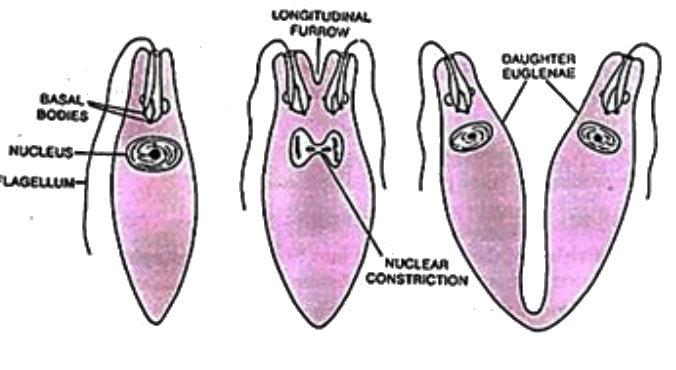
The given below diagram is the representation of
 View Solution
the diagram given here is the standard ECG of a normal person. The P-wave represents the :
 View Solution
Ellingham diagram is a graphical representation of :
View SolutionWhich of the following diagrams is not a correct representation of convergent evolution ?
View Solution

