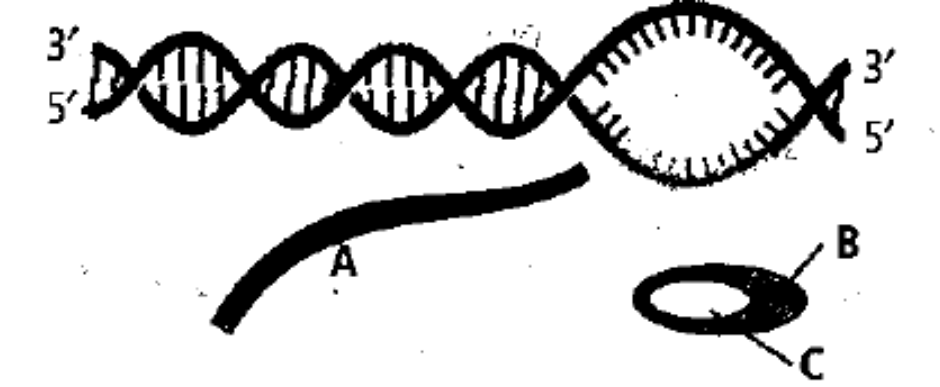
The given figure represents the process of transcription in bacteria.
A
A-DNA,B-RNA, C-Rho factor
B
A-RNA, B-RNA polymerase, C- Rho factor
C
A-RNA, B-RNA polymerase, C- sigma factor
D
A-DNA, B-DNA polymerase, C-Sigma factor
Video Solution
Text Solution
The correct Answer is:B
(b)
|
Topper's Solved these Questions
Similar Questions
Knowledge Check
The given figure best represents
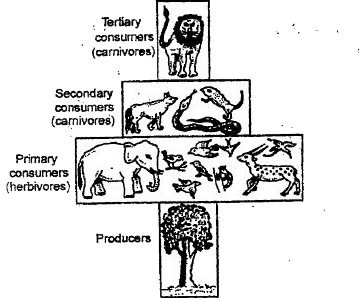 APyramid of number in parasitic food chainBPyramid of biomass in forest ecosystemCPyramid of number in grassland ecosystemDPyramid of number in forest ecosystem
The given figure refers to the process of transcription in Eukaryotes, A,B,C and D are respectively
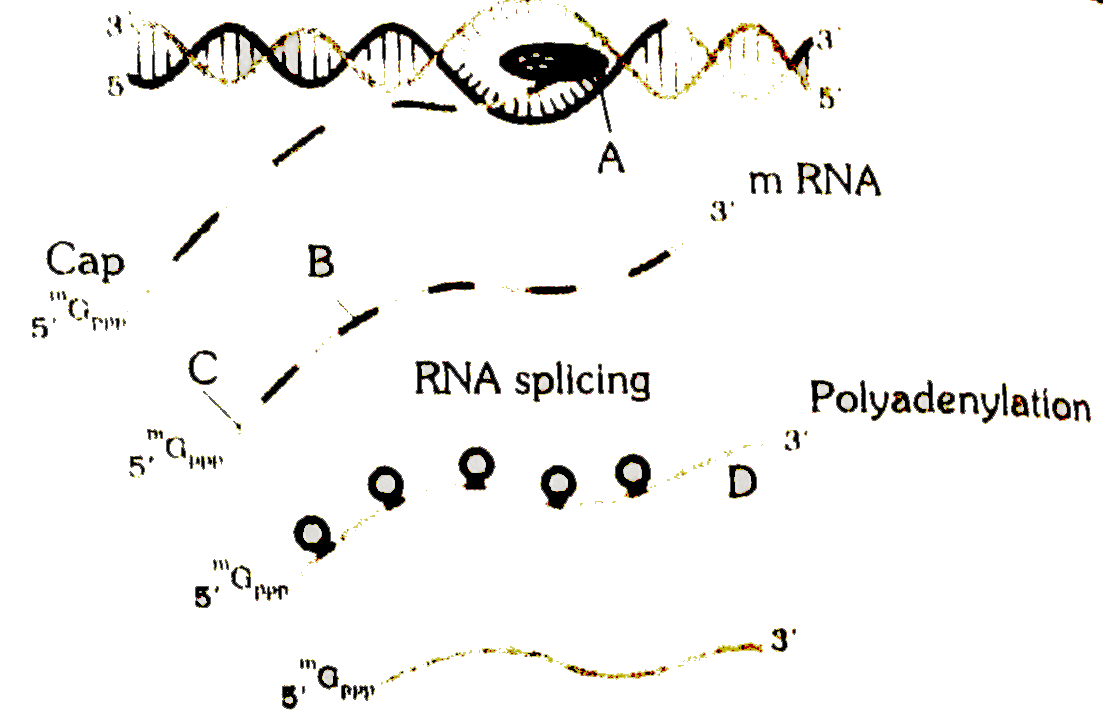 AA - RNA polymerase II, B - Intron, C- Exon, D - Poly G tailBA - RNA polymerase II, B - Intron, C- Exon, D - Poly A tailCA - DNA polymerase II, B - Intron, C- Exon, D - Poly A tailDA - RNA polymerase II, B - Exon, C- Intron, D - Poly A tail
Study the given figures representing the process of binary fission in Amoeba.
Arrange the figures in the correct sequence and select the correct answer.
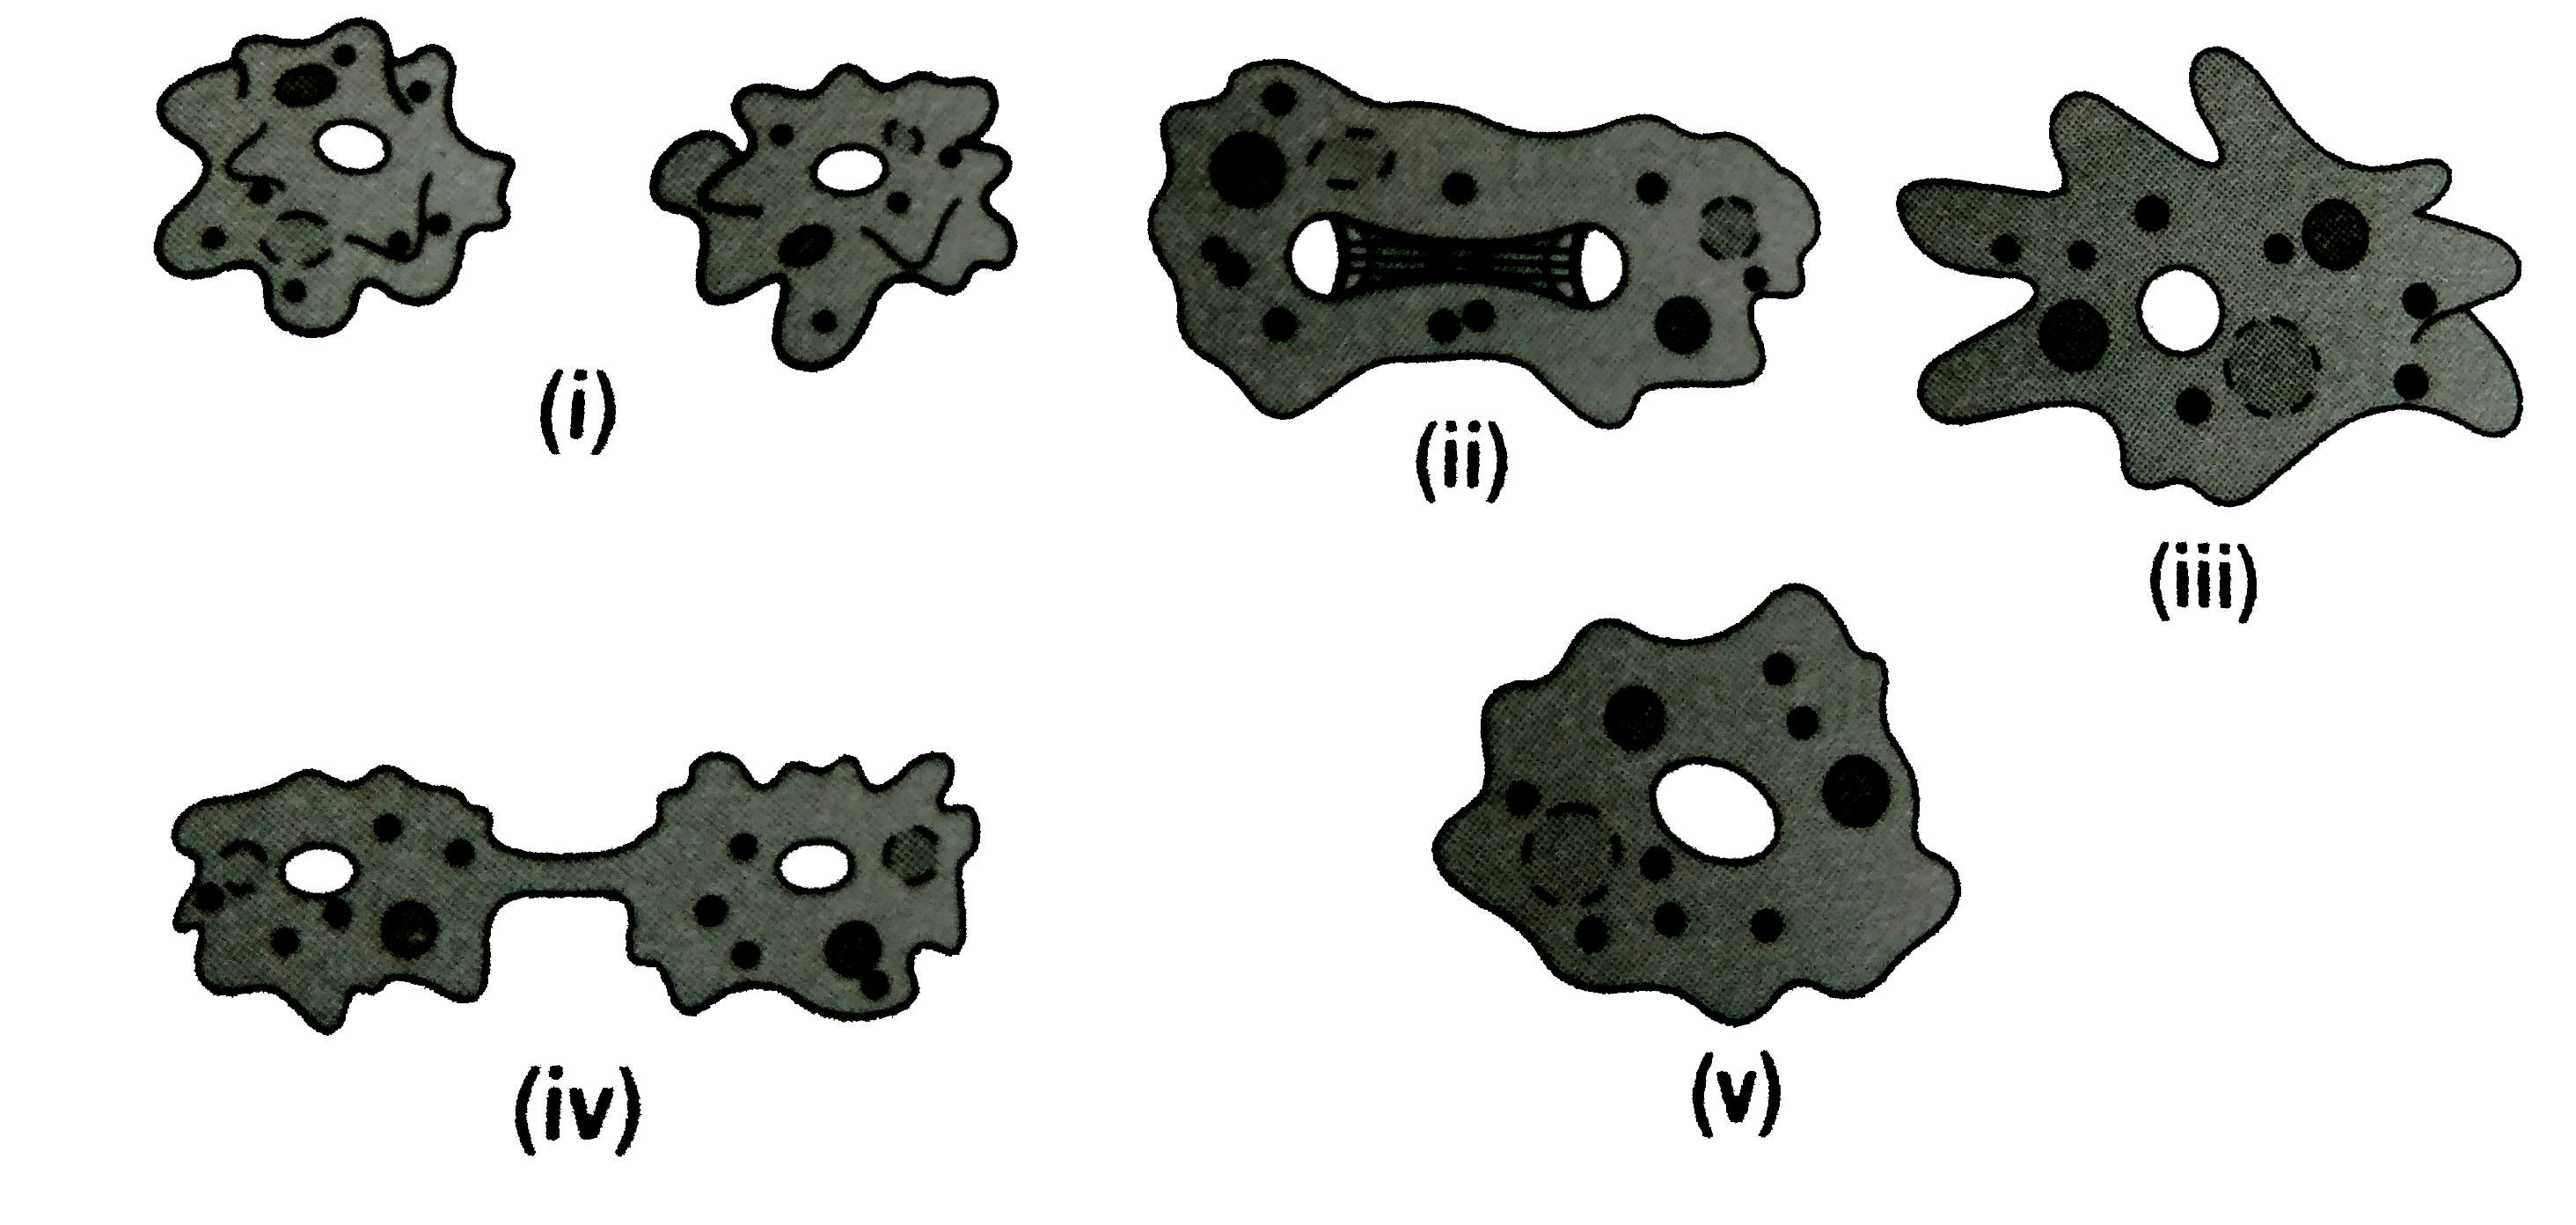 A(iv)→(iii)→(i)→(ii)→(v)B(iii)→(iv)→(i)→(ii)→(v)C(v)→(iii)→(ii)→(iv)→(i)D(iv)→(iii)→(ii)→(v)→(i)
Describe the initiation process of transcription in Bacteria.
View SolutionDescribe the elongation process transcription in bacteria.
View SolutionDescribe the process of transcription in protein synthesis.
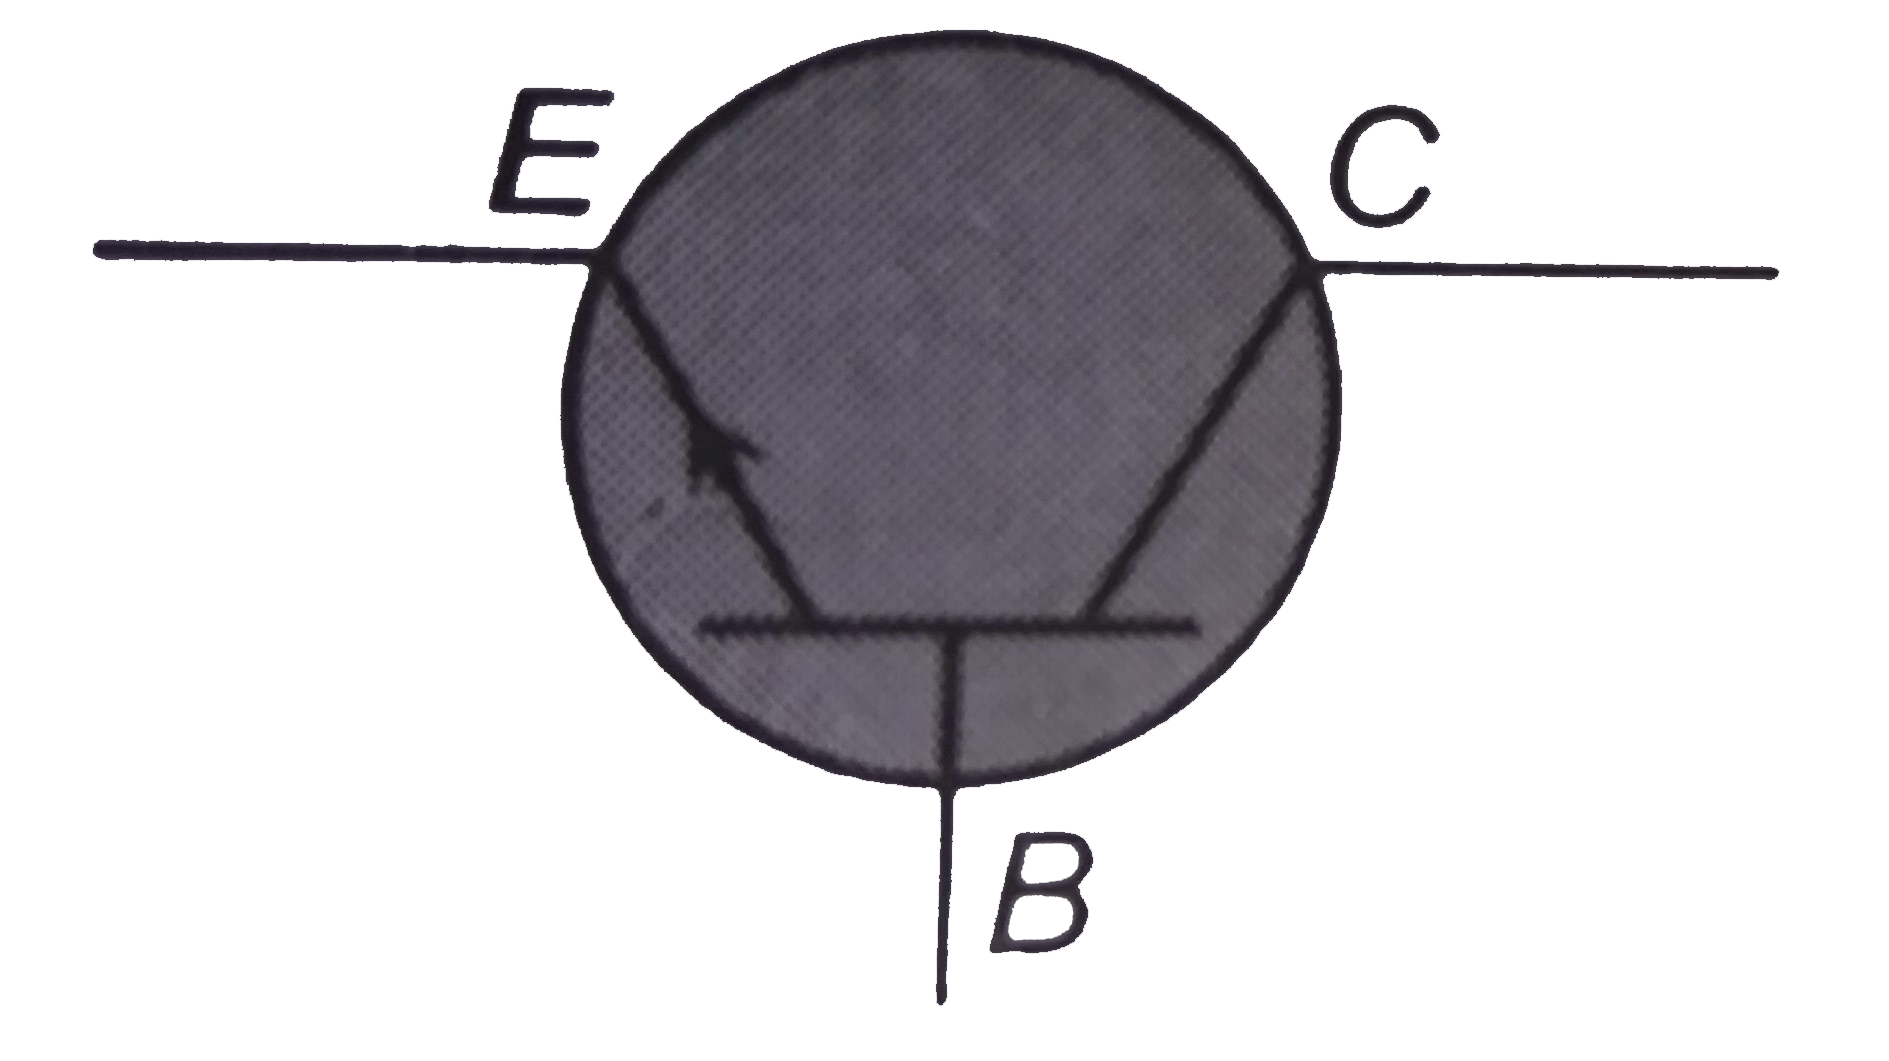
View SolutionThe symbol given in figure represents
View SolutionGiven diagram represents the components of a transcription unit. Select the correct answer regarding it .

View Solution
