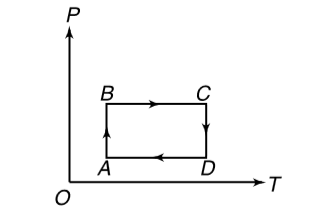
An ideal gas undergoes a cyclic process A→B→C→D for which P – T graph is as shown. Draw P – V and V – T of graph to represent the same process.
The correct Answer is:(##IJAPHYV02C03E01022_A01##)
Step by step video, text & image solution for An ideal gas undergoes a cyclic process A to B to C to D for which P – T graph is as shown. Draw P – V and V – T of graph to represent the same process. by Physics experts to help you in doubts & scoring excellent marks in Class 11 exams.
Topper's Solved these Questions
- BOOK - ARIHANTCHAPTER - KINETIC THEORY OF GASESEXERCISE - Level 218videos
KINETIC THEORY OF GASES
- BOOK - ARIHANTCHAPTER - KINETIC THEORY OF GASESEXERCISE - Level 34videos
KINETIC THEORY OF GASES
- BOOK - ARIHANTCHAPTER - KINEMATICSEXERCISE - Level 333videos
KINEMATICS
- BOOK - ARIHANTCHAPTER - MOMENTUM AND CENTRE OF MASSEXERCISE - Momentum And Center of Mass117videos
MOMENTUM AND CENTRE OF MASS
Similar Questions
Knowledge Check
- Question 1 - Select One or More
An ideal gas undergoes the cyclic process shown in a graph below :
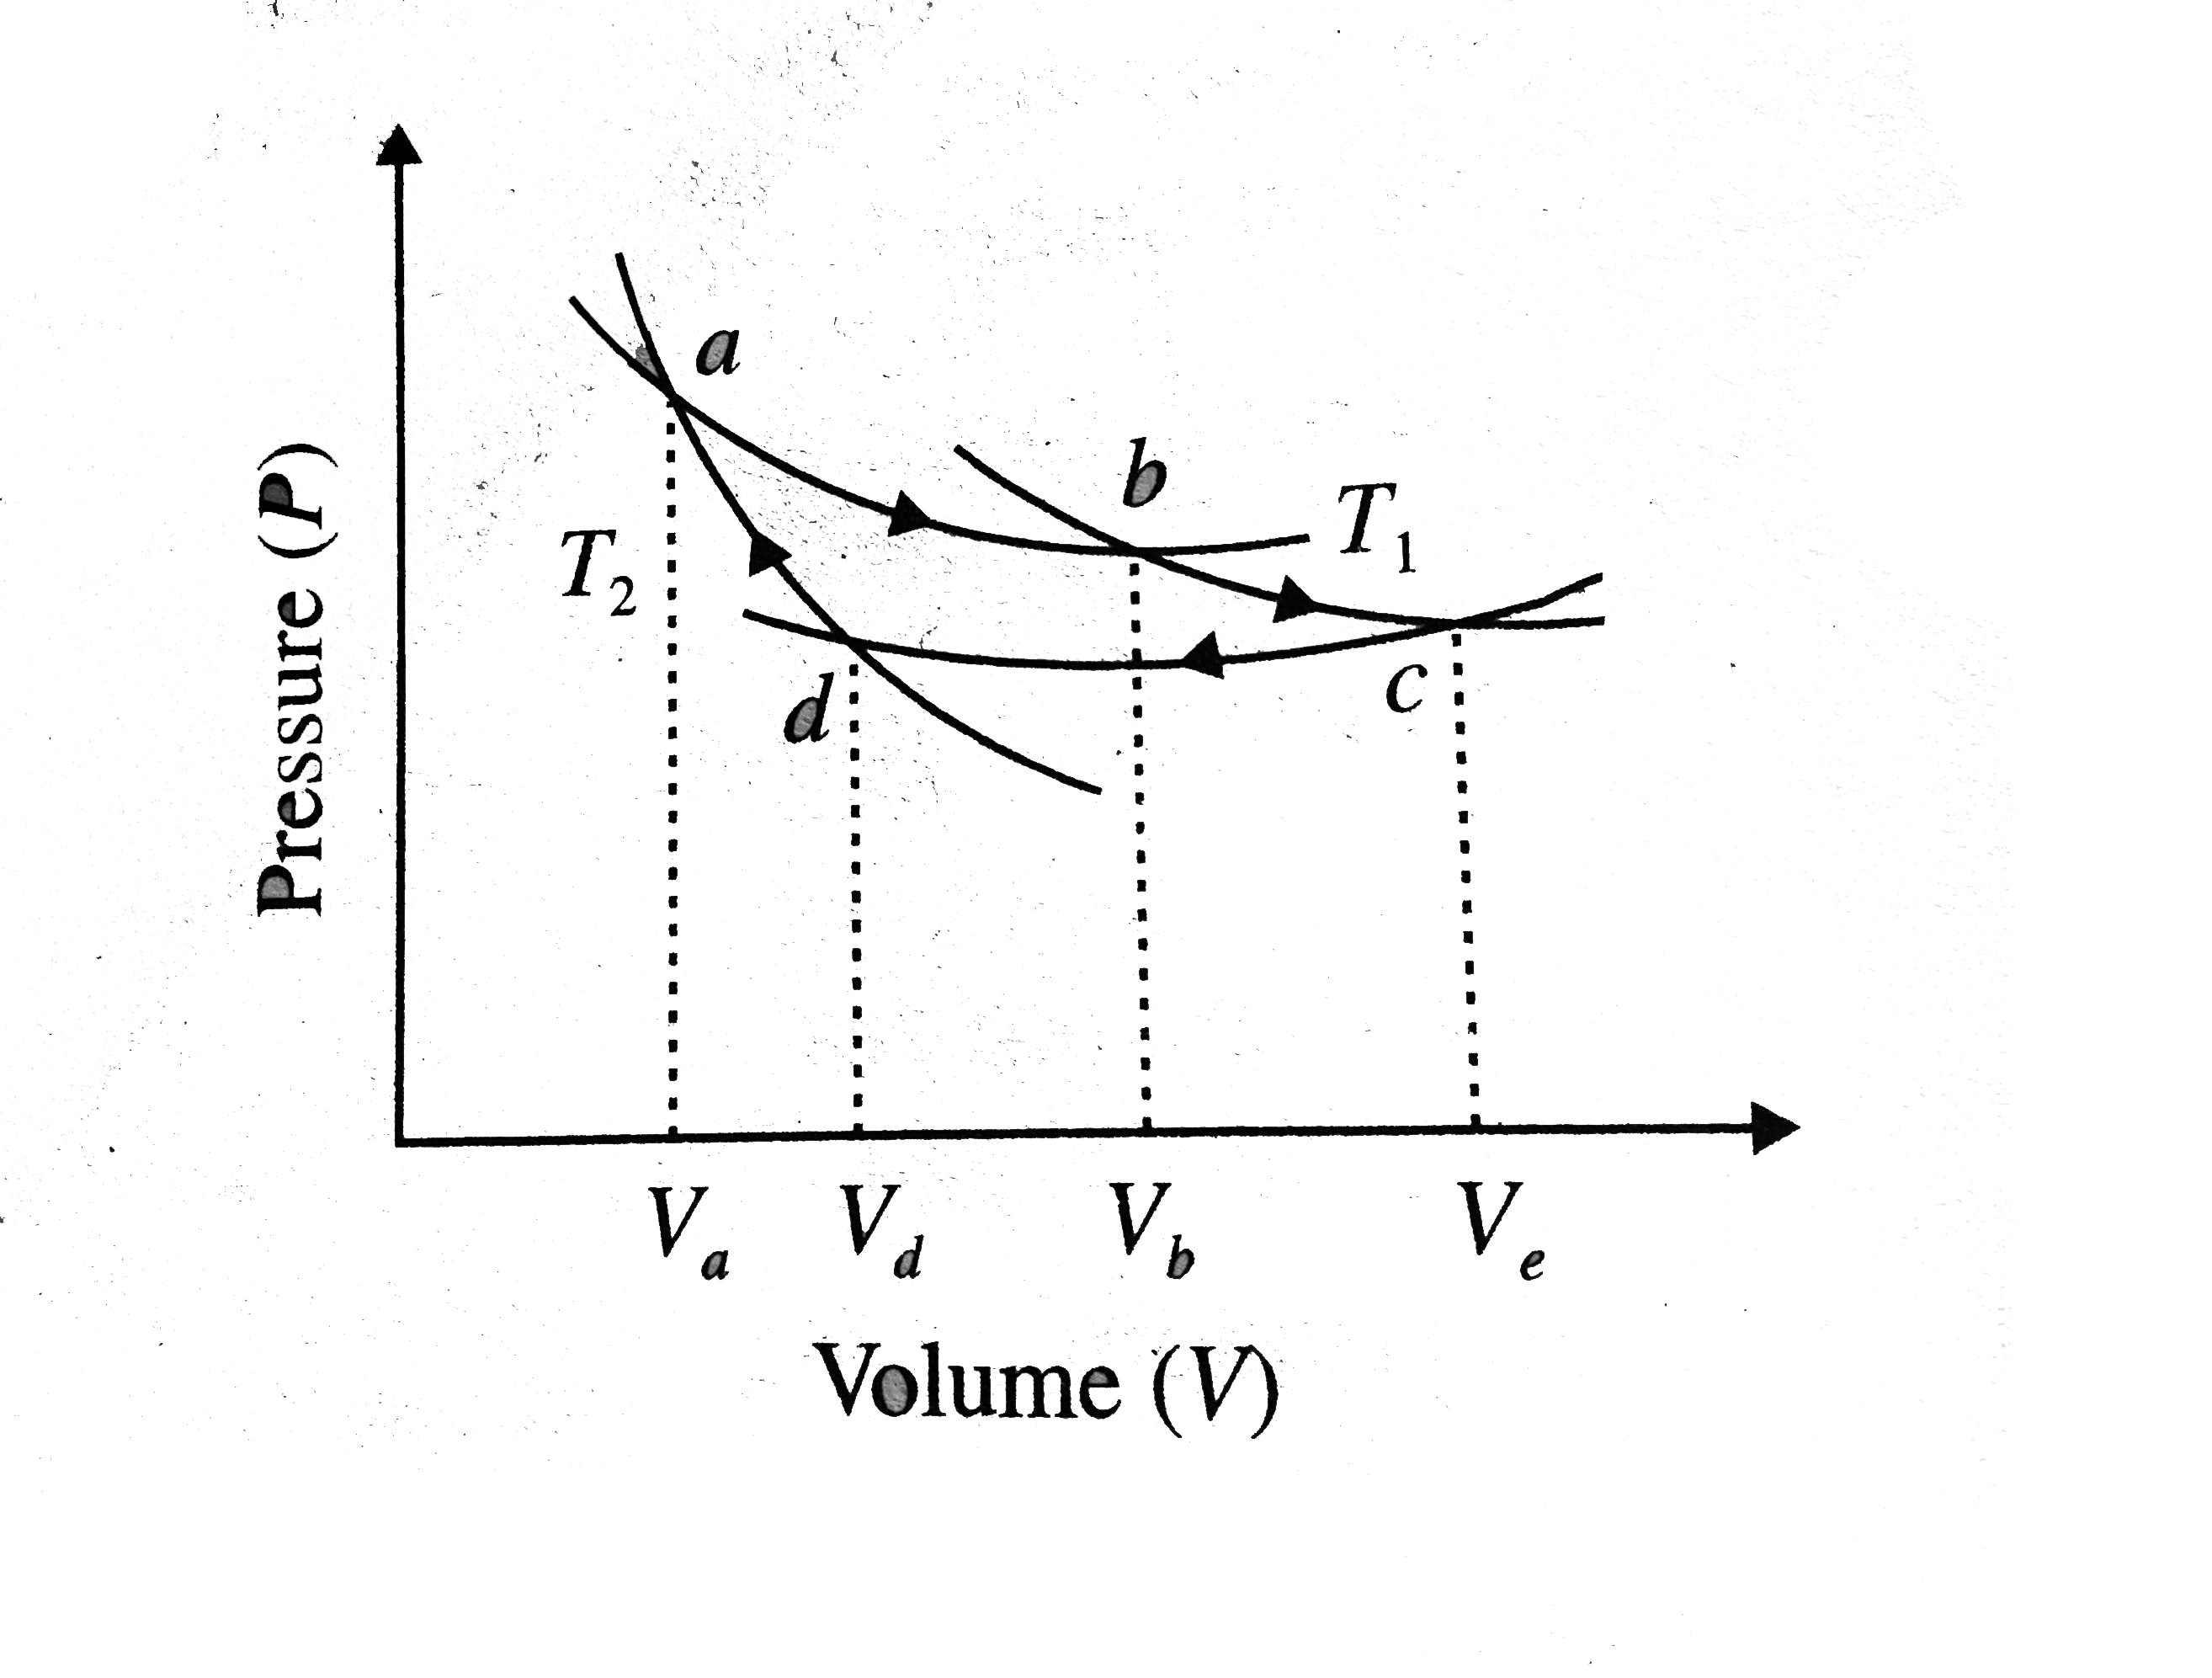 AT1=T2BT1>T2CVaVc=VbVdDVaVb=VcVd
 - Question 2 - Select One
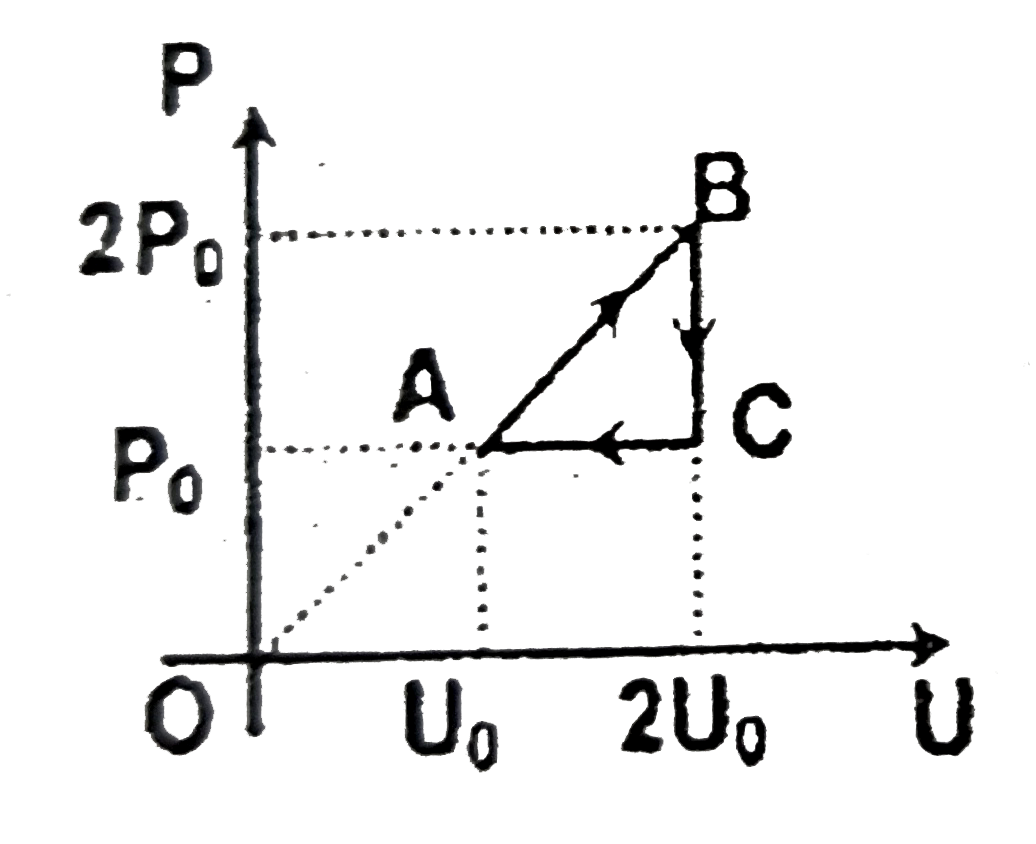
An ideal gas undergoes cyclic process ABCDA as shown in givend p−V diagram. The amount of work done by the gas is
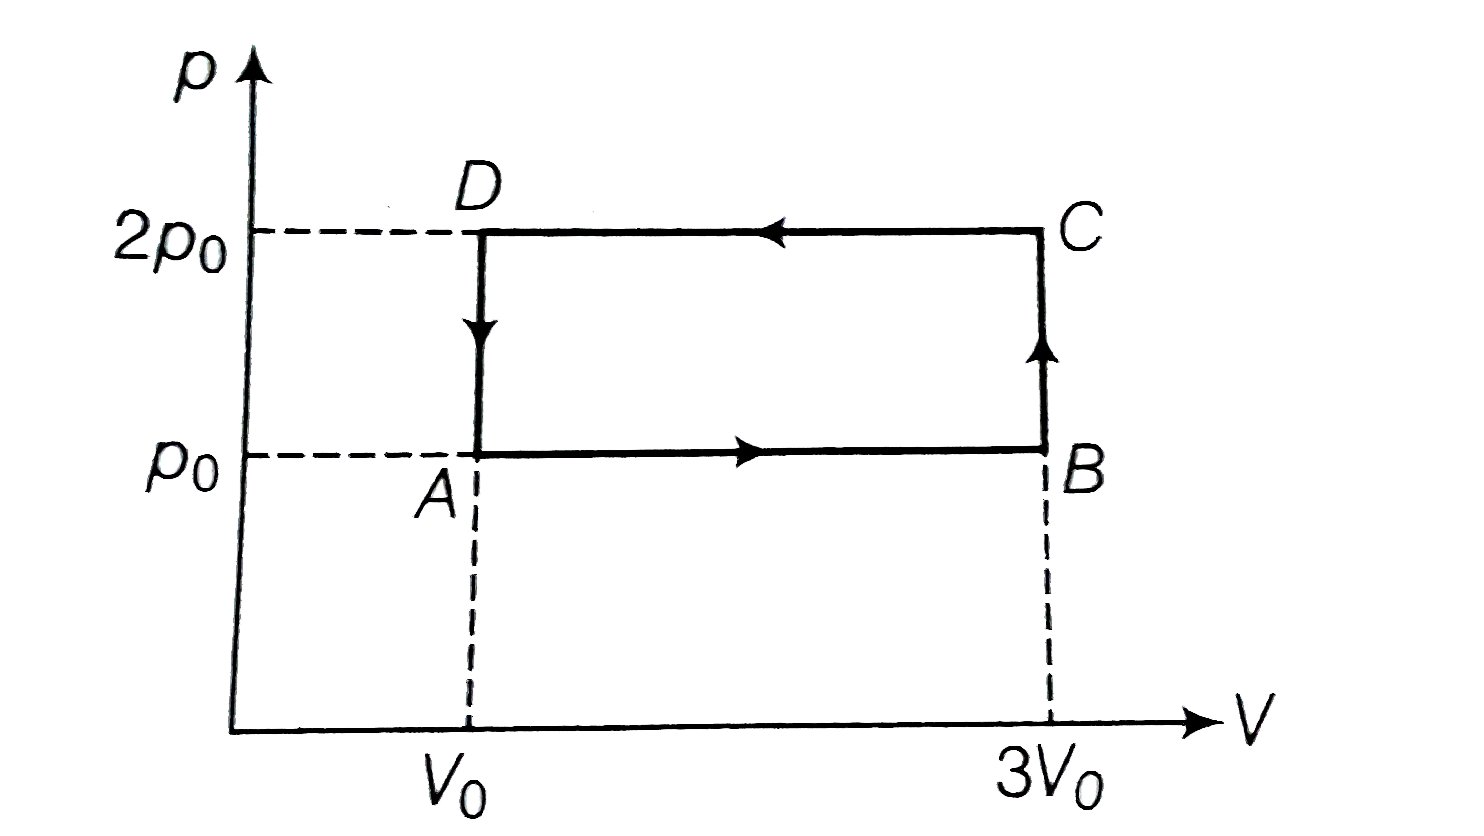 A6p0V0B−2p0V0C+2p0V0D+4p0V0
 - Question 3 - Select One
A cyclic process ABCD is shown is shown in the following P−V diagram. Which of the following curves represent the same process ?
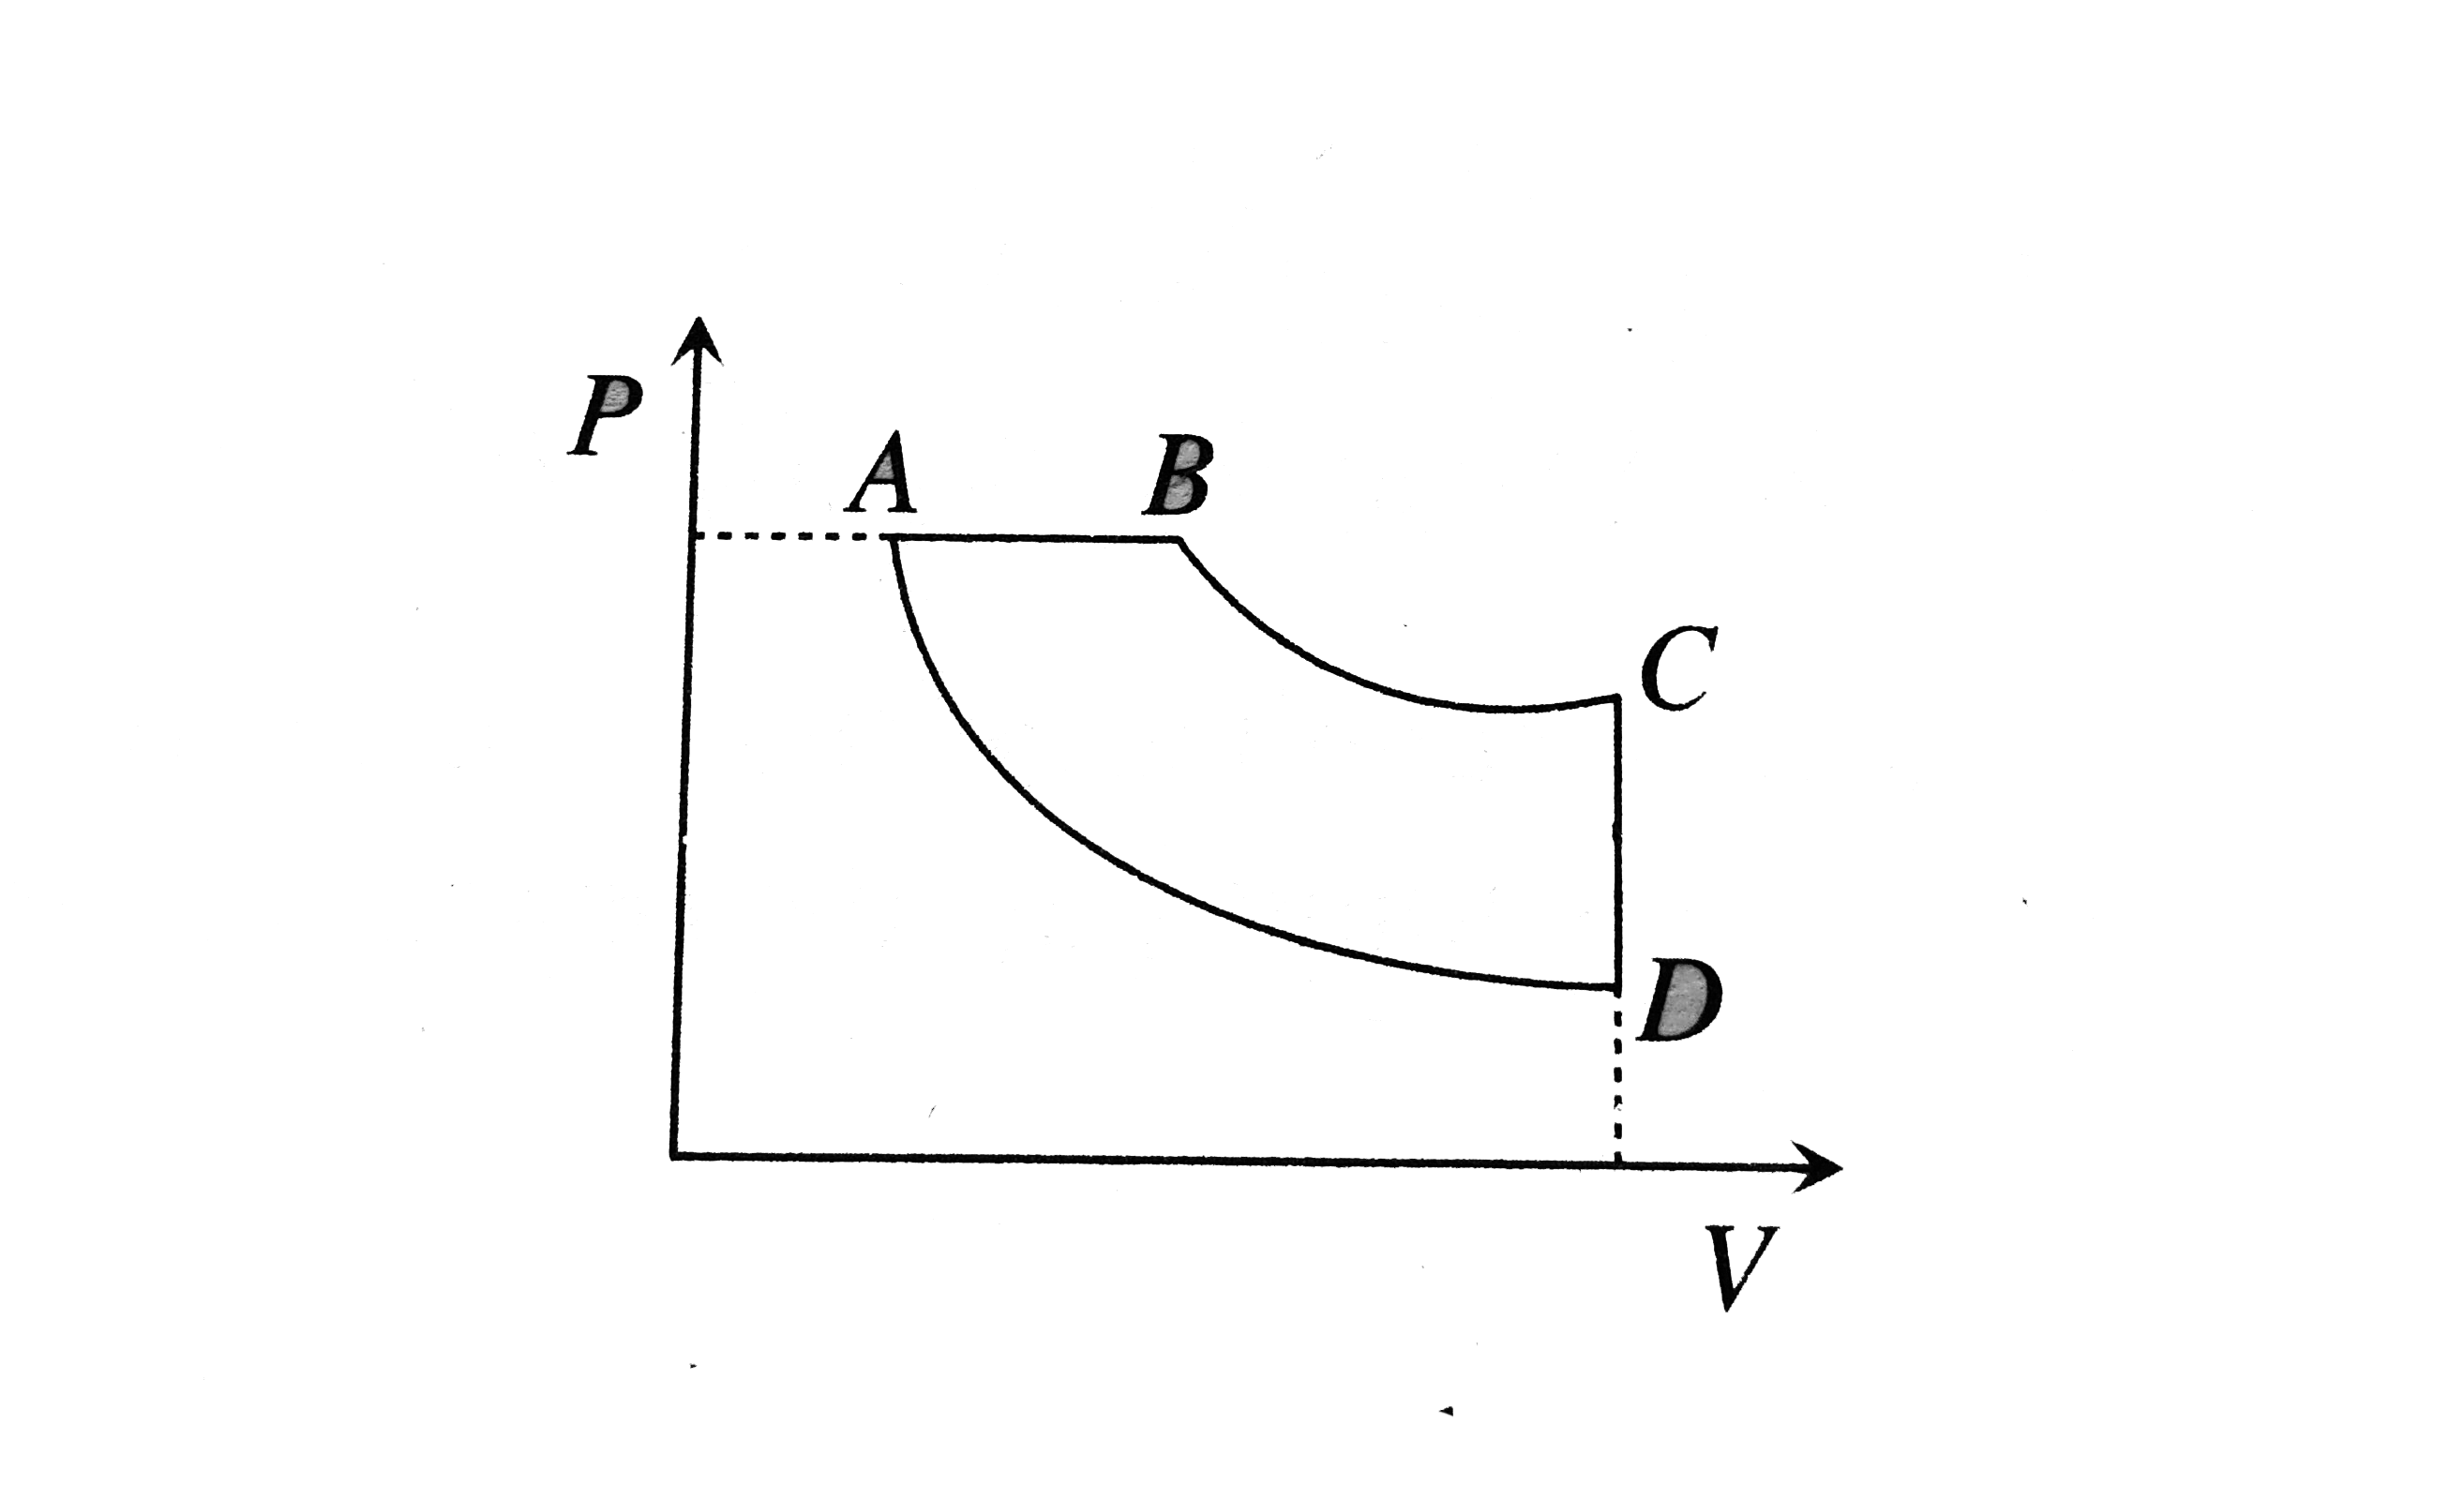 A
A B
B C
C D
D
An ideal gas undergoes a cyclic process as shown in the given P-T diagram, where AC is adiabatic. The process is also represented by:
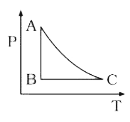 View Solution
A cyclic process ABC A is shown in P - T diagram. What would be its P – V graph:
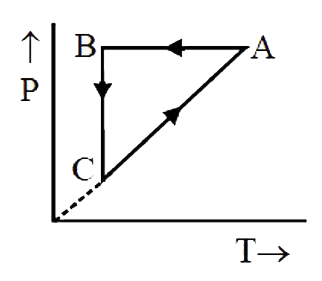 View Solution
Which of the following P-V diagram represent the graph of isometric process?
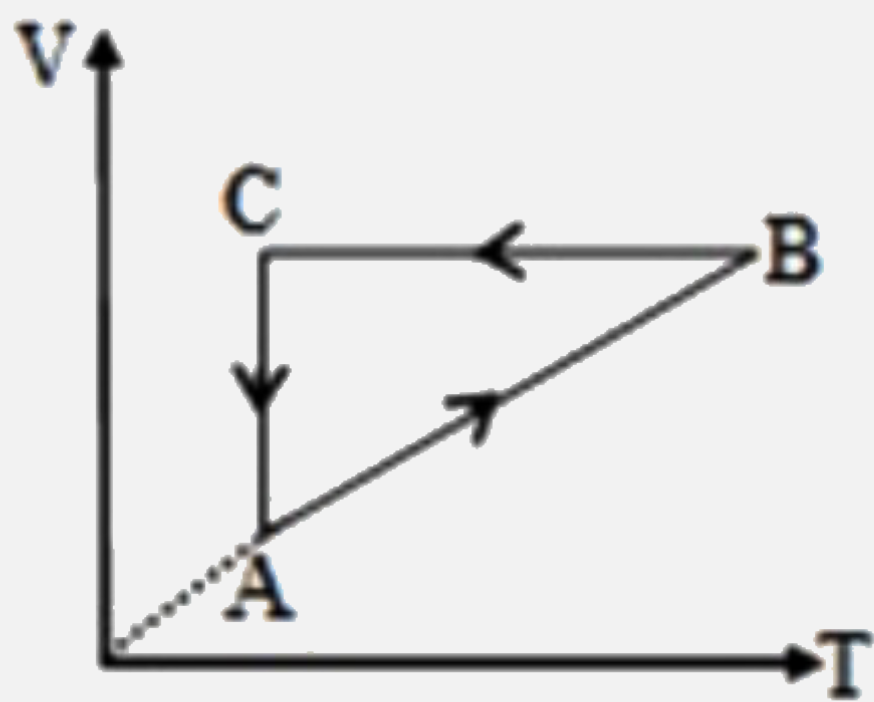
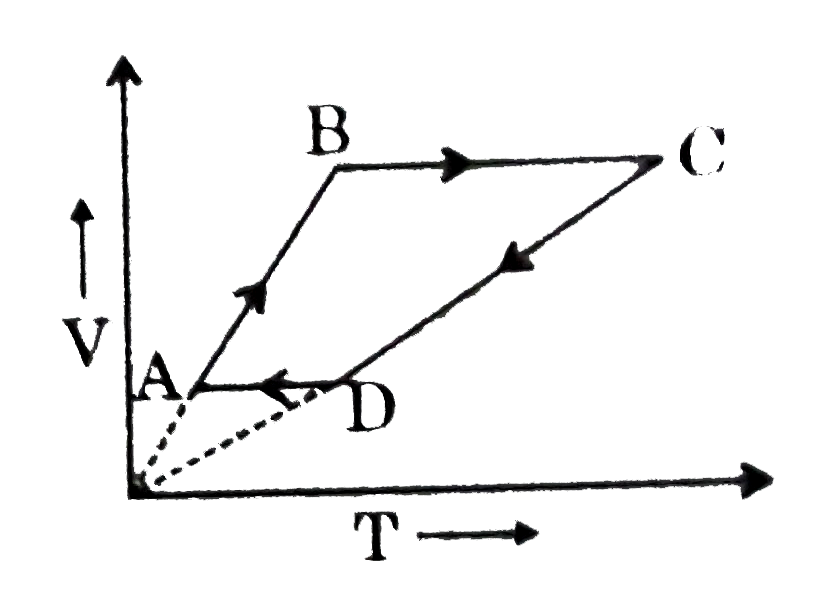
View SolutionA cyclic process ABCD is shown in VT diagram for an ideal gas. Which of the following diagram represents the same process ?
 View Solution
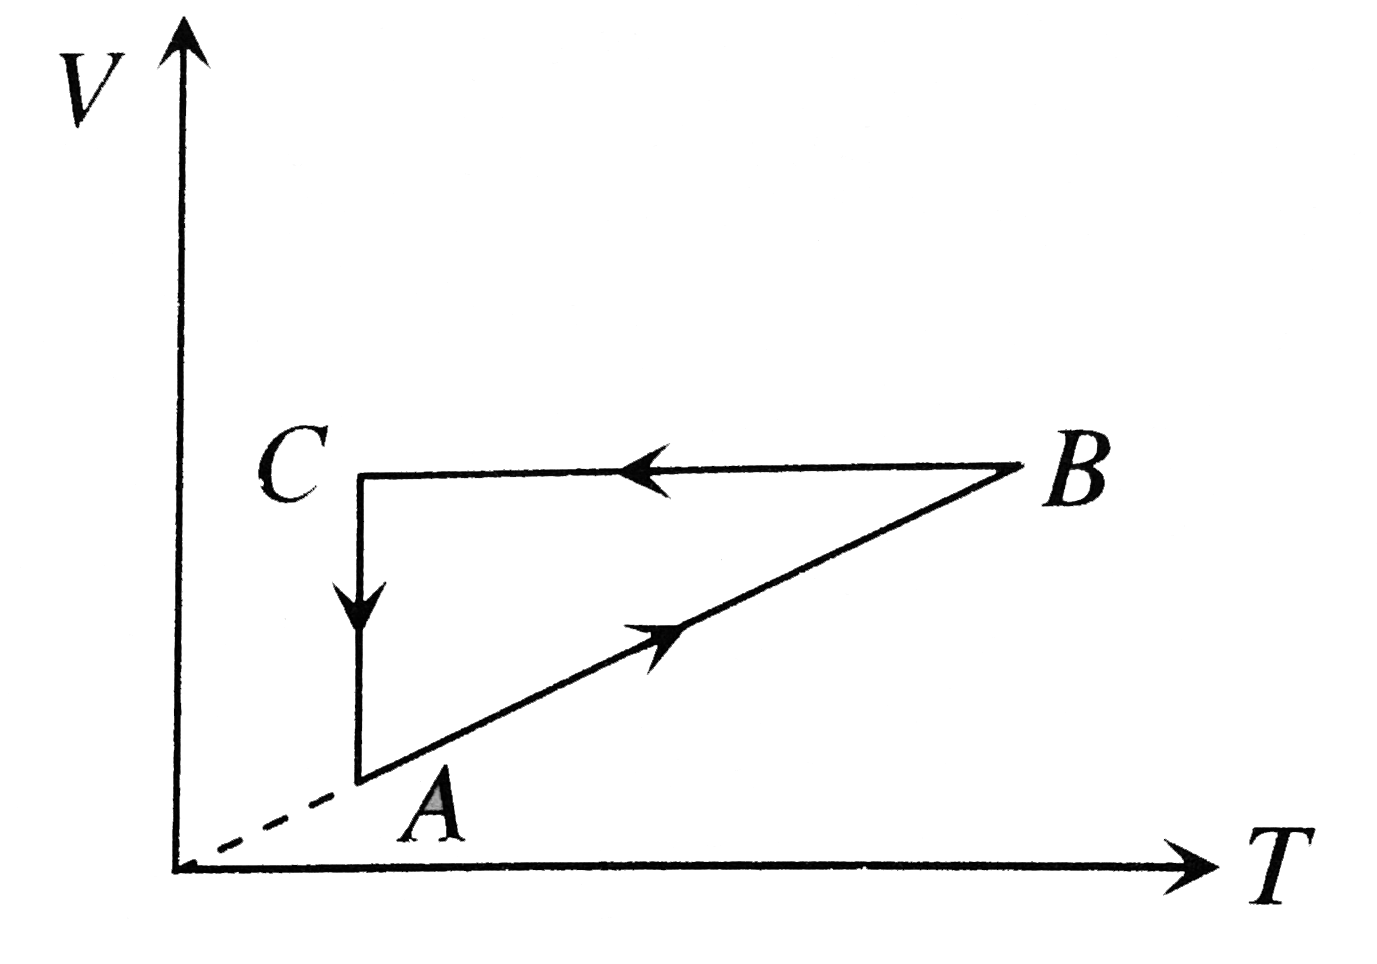
A cyclic process ABCA is shown in the V−T diagram process on the P−V
 View Solution


