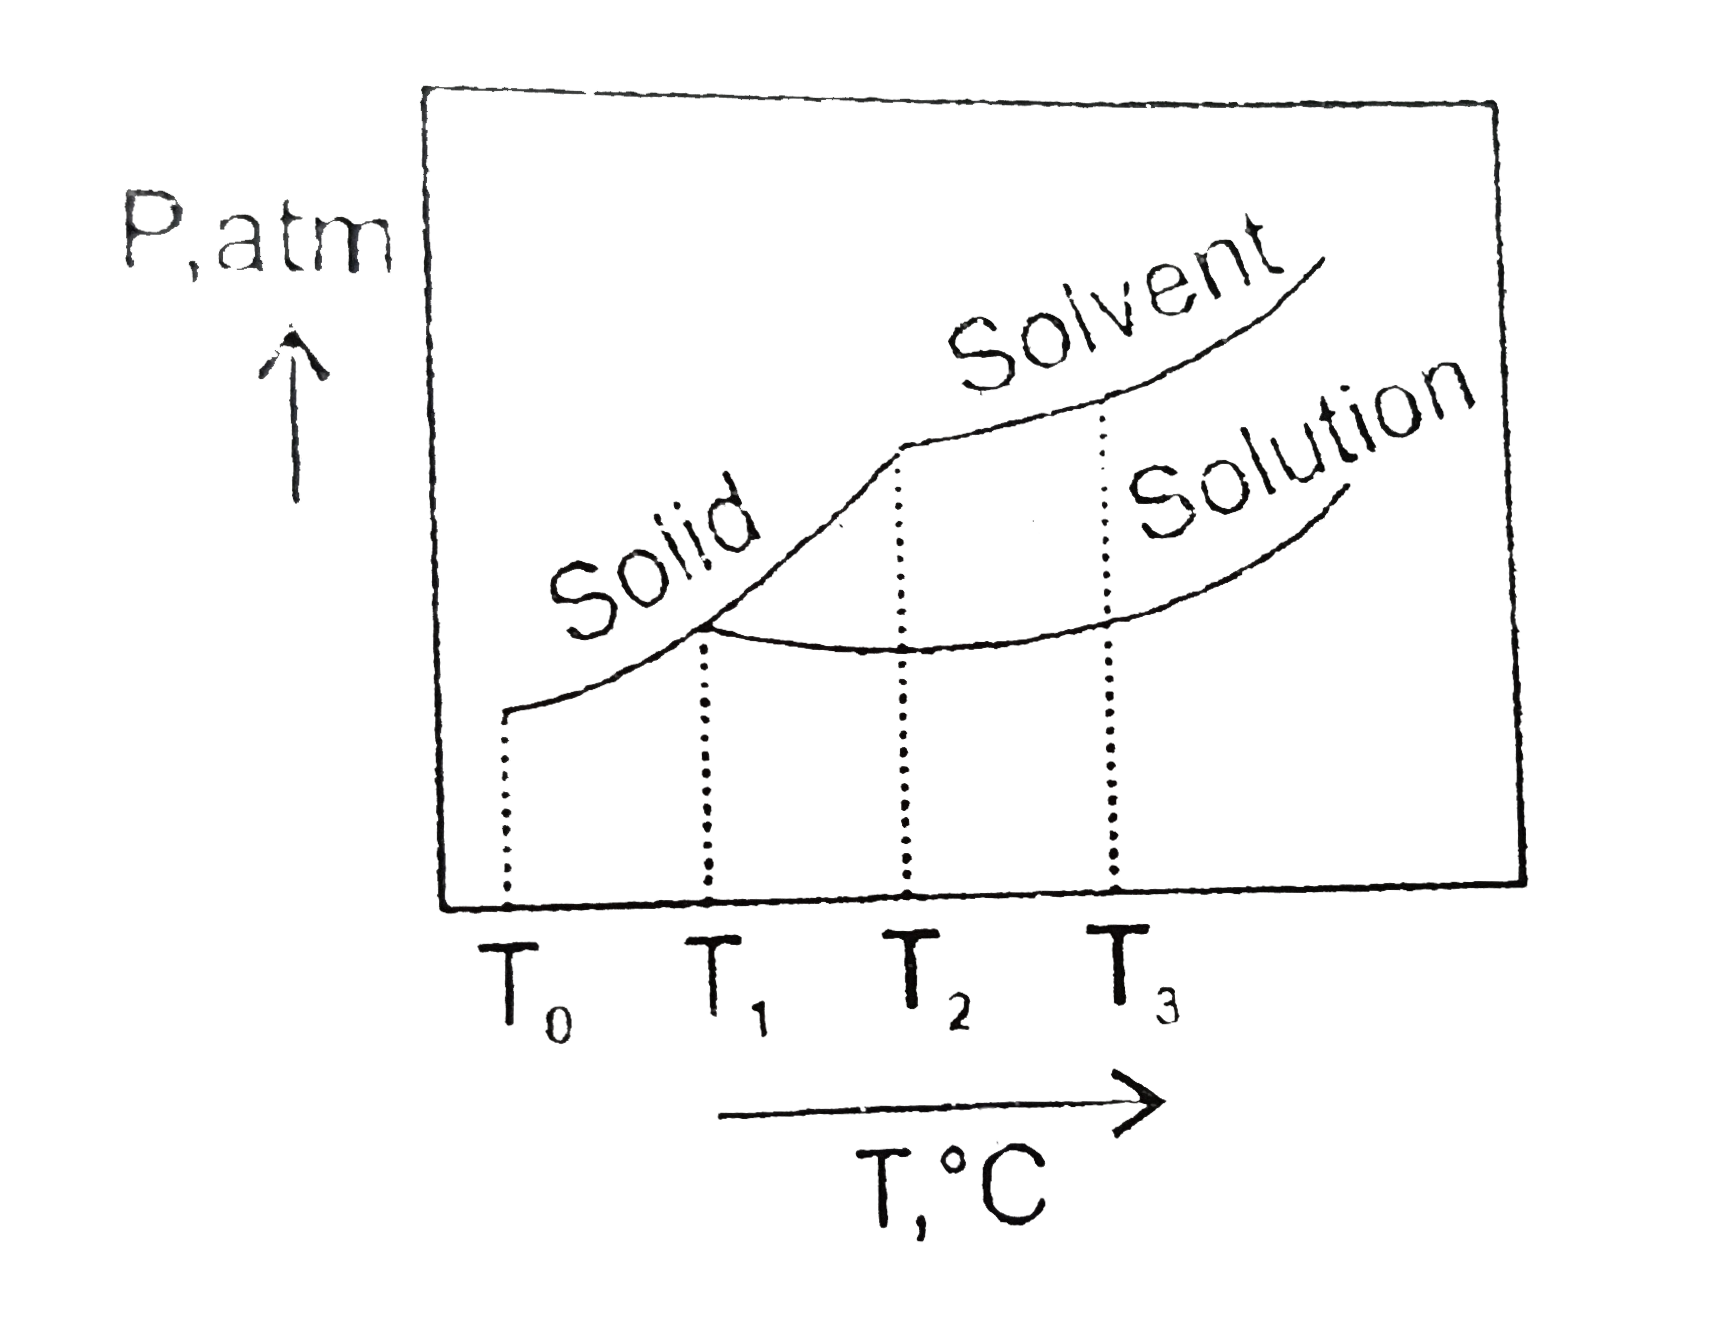
What is the normal freezing point of the solution represented by the phase diagram ?
A
T1
B
T2
C
T3
D
T0
Video Solution
Text Solution
The correct Answer is:A
From given graph, we can say T1 is that temp at which solid state and liquid (solution) are in equilibrium.
|
Updated on:21/07/2023
Topper's Solved these Questions
- BOOK - RESONANCECHAPTER - SOLUTIONSEXERCISE - Advabced Level Problems (PART-2)35videos
SOLUTIONS
- BOOK - RESONANCECHAPTER - SOLUTIONSEXERCISE - EXERCISE-3(PART-3)30videos
SOLUTIONS
- BOOK - RESONANCECHAPTER - SOLUTION AND COLLIGATIVE PROPERTIESEXERCISE - PHYSICAL CHEMITRY (SOLUTION & COLLIGATIVE PROPERTIES)52videos
SOLUTION AND COLLIGATIVE PROPERTIES
- BOOK - RESONANCECHAPTER - STEREOISOMERISMEXERCISE - EXERCISE (PART III : PRACTICE TEST-2 (IIT-JEE (ADVANCED PATTERN))22videos
STEREOISOMERISM
Similar Questions
Knowledge Check
- Question 1 - Select One
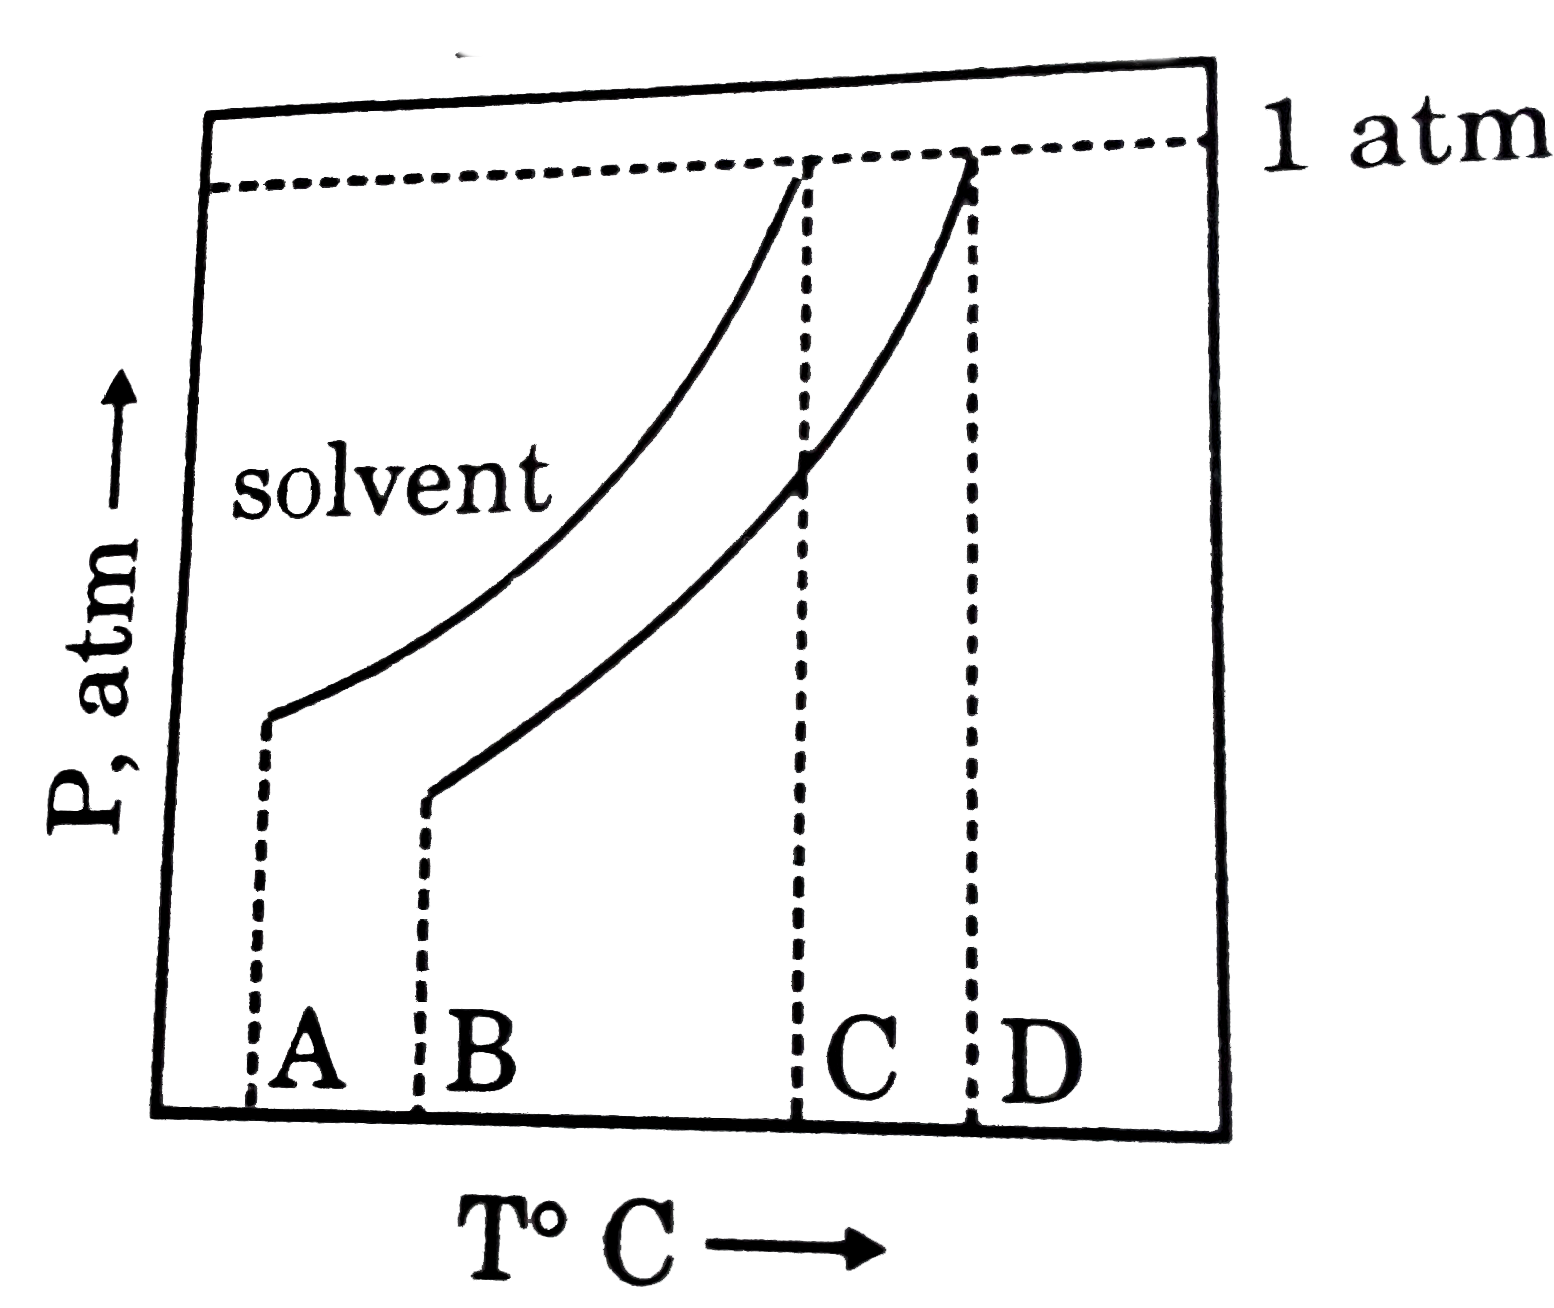
What is the normal boiling point of the solution represented by the phase diagram ?
 AABBCCDD
 - Question 2 - Select One
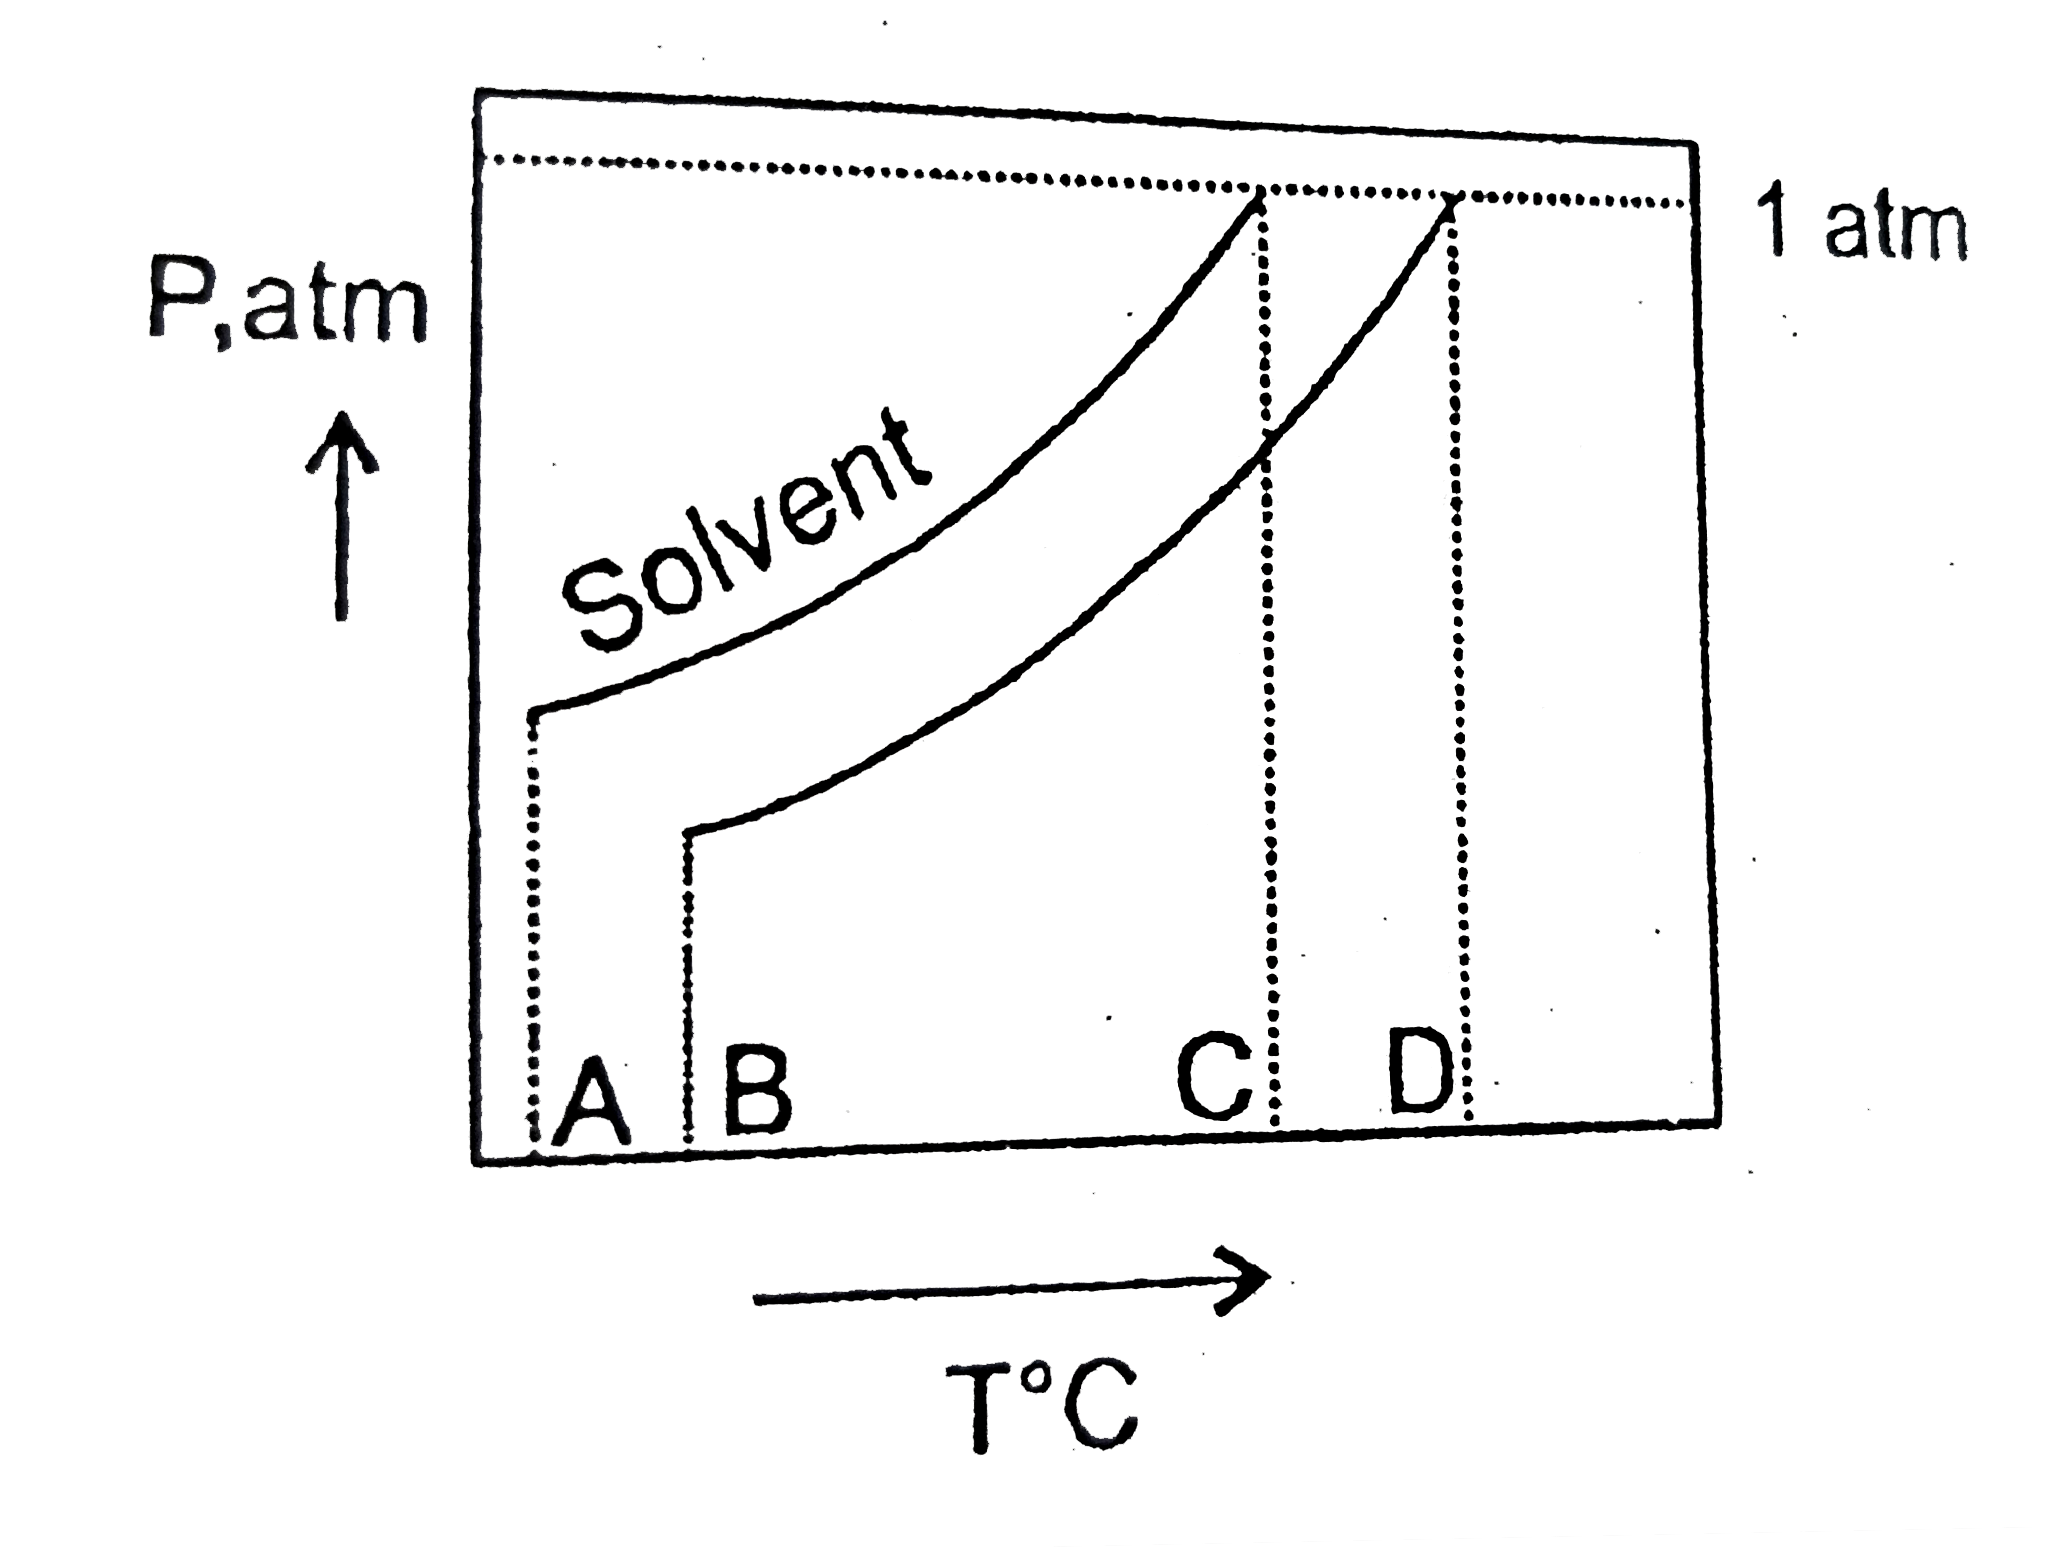
What is the normal boiling point of the solution represented by the phase diagram ?
 AABBCCDD
 - Question 3 - Select One
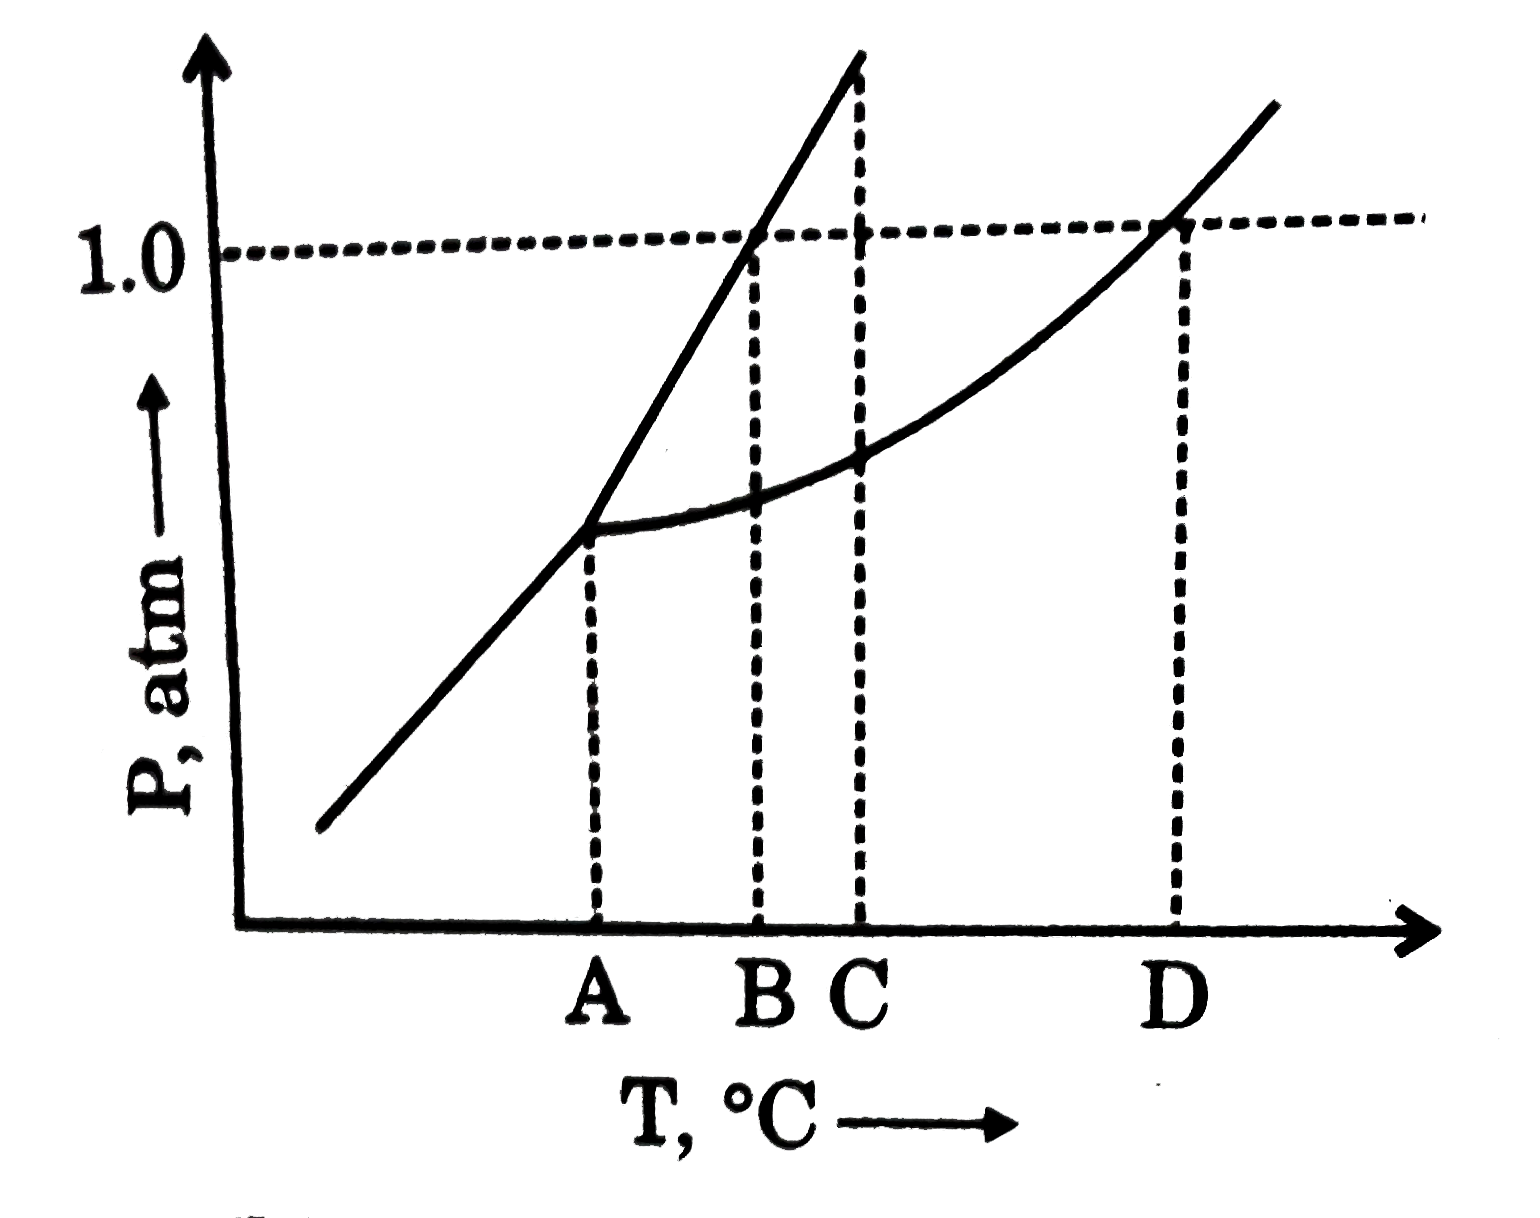
What is the normal melting point of the substance represented by the phase diagram ?
 AABBCCDD
The freezing point of the solution M is -
View Solution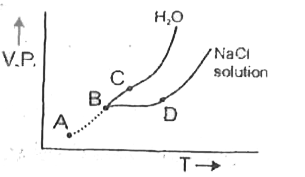
Freezing point of solution is marked asView SolutionAt freezing point of a solution there is always
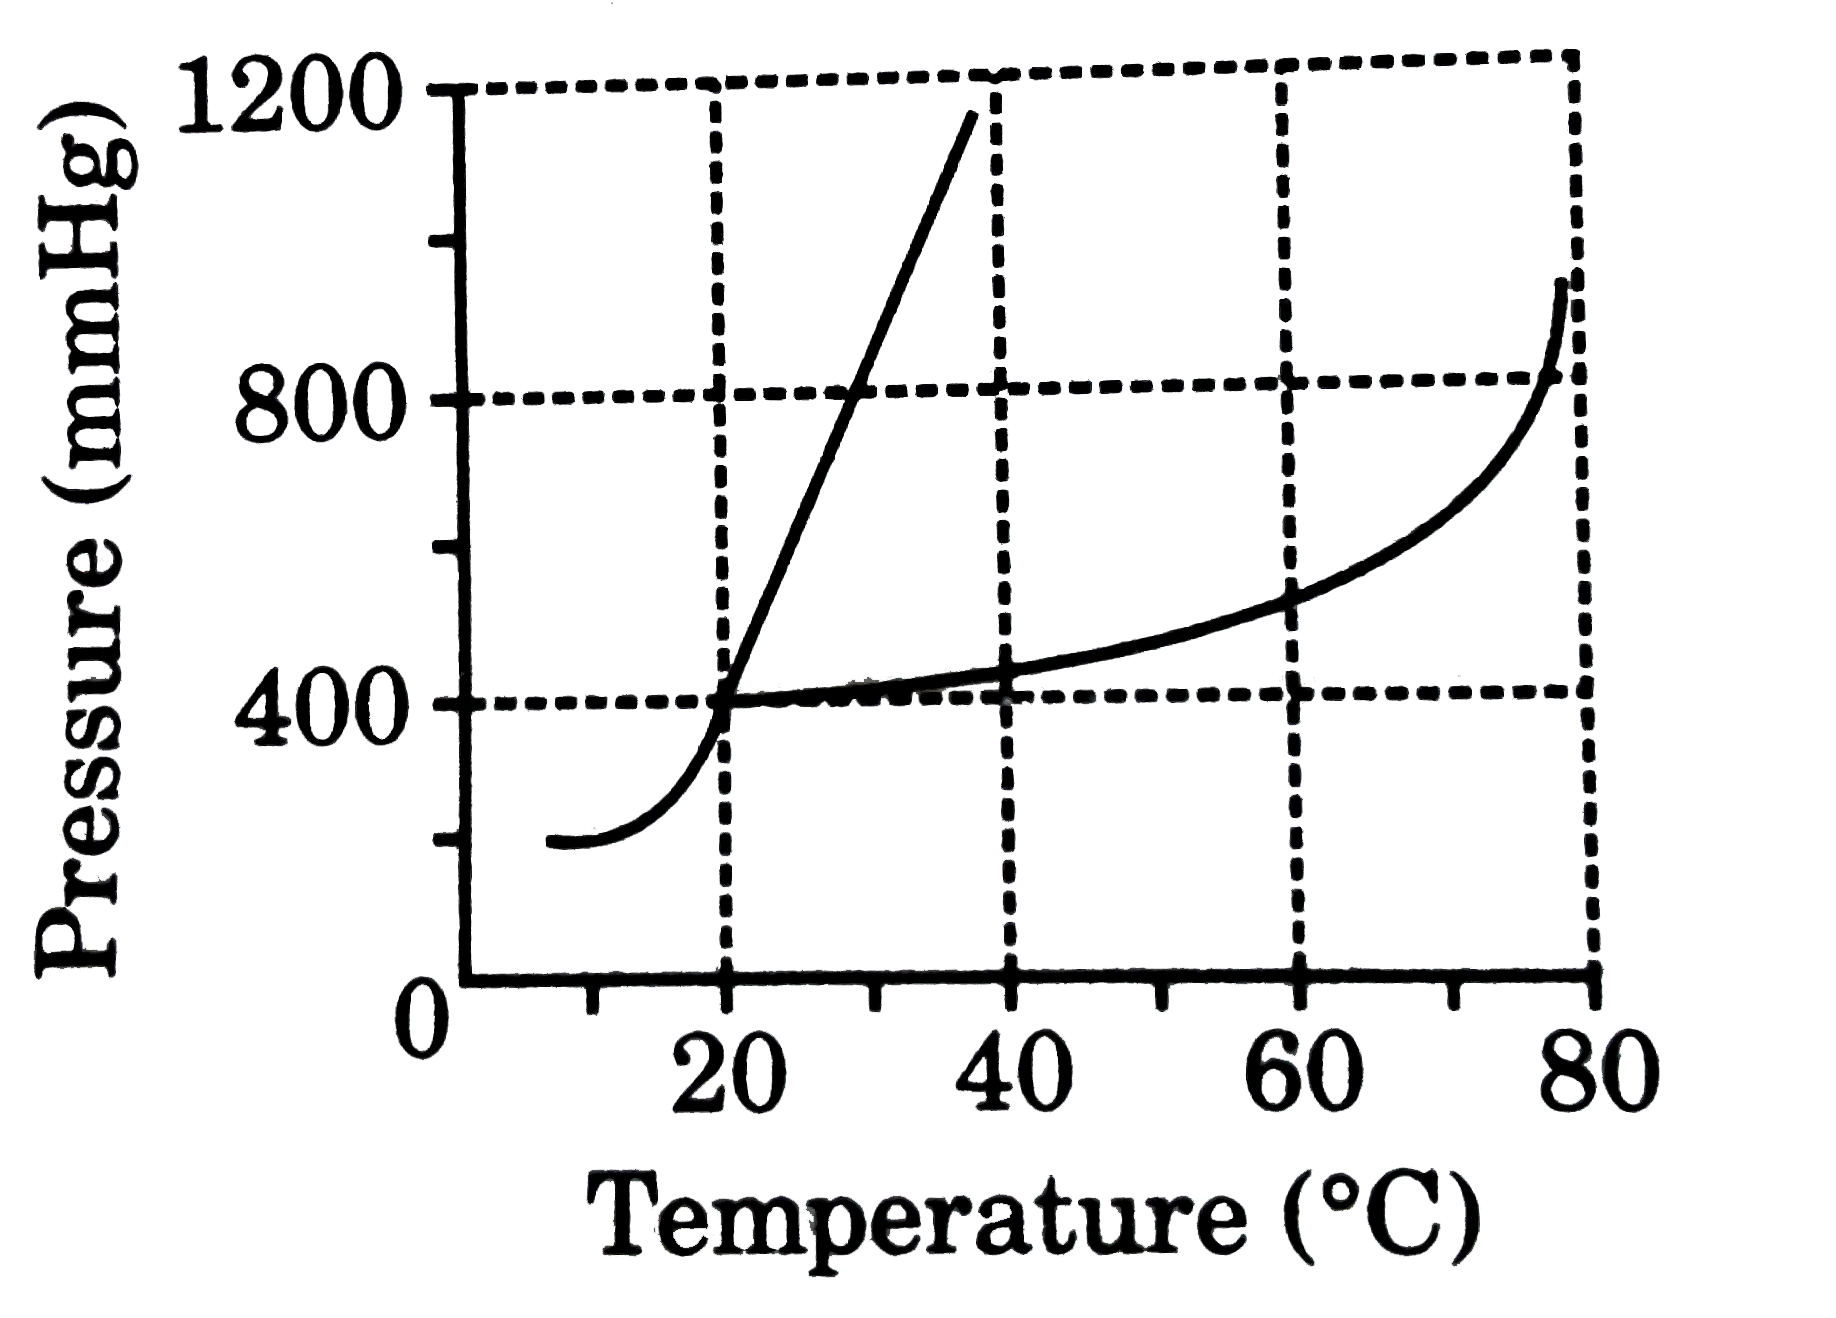
View SolutionWhat can be concluded about the substance represented by this phase diagram ?
 View Solution
The freezing point order of the solution of glucose is :
View Solution

