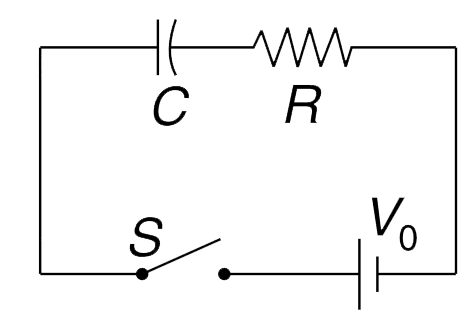
In the circuit shown the switch is closed at time t=0. Plot the following graphs:
(i) current (I) in the circuit Vs time (t)
(ii) voltage across the capacitor (VC) Vs ‘t’
(iii) power absorbed by the capacitor Vs ‘t’.
Text Solution
The correct Answer is:(##IJAPHYV02C08E01042_A01##)
|
Topper's Solved these Questions
Similar Questions
Knowledge Check
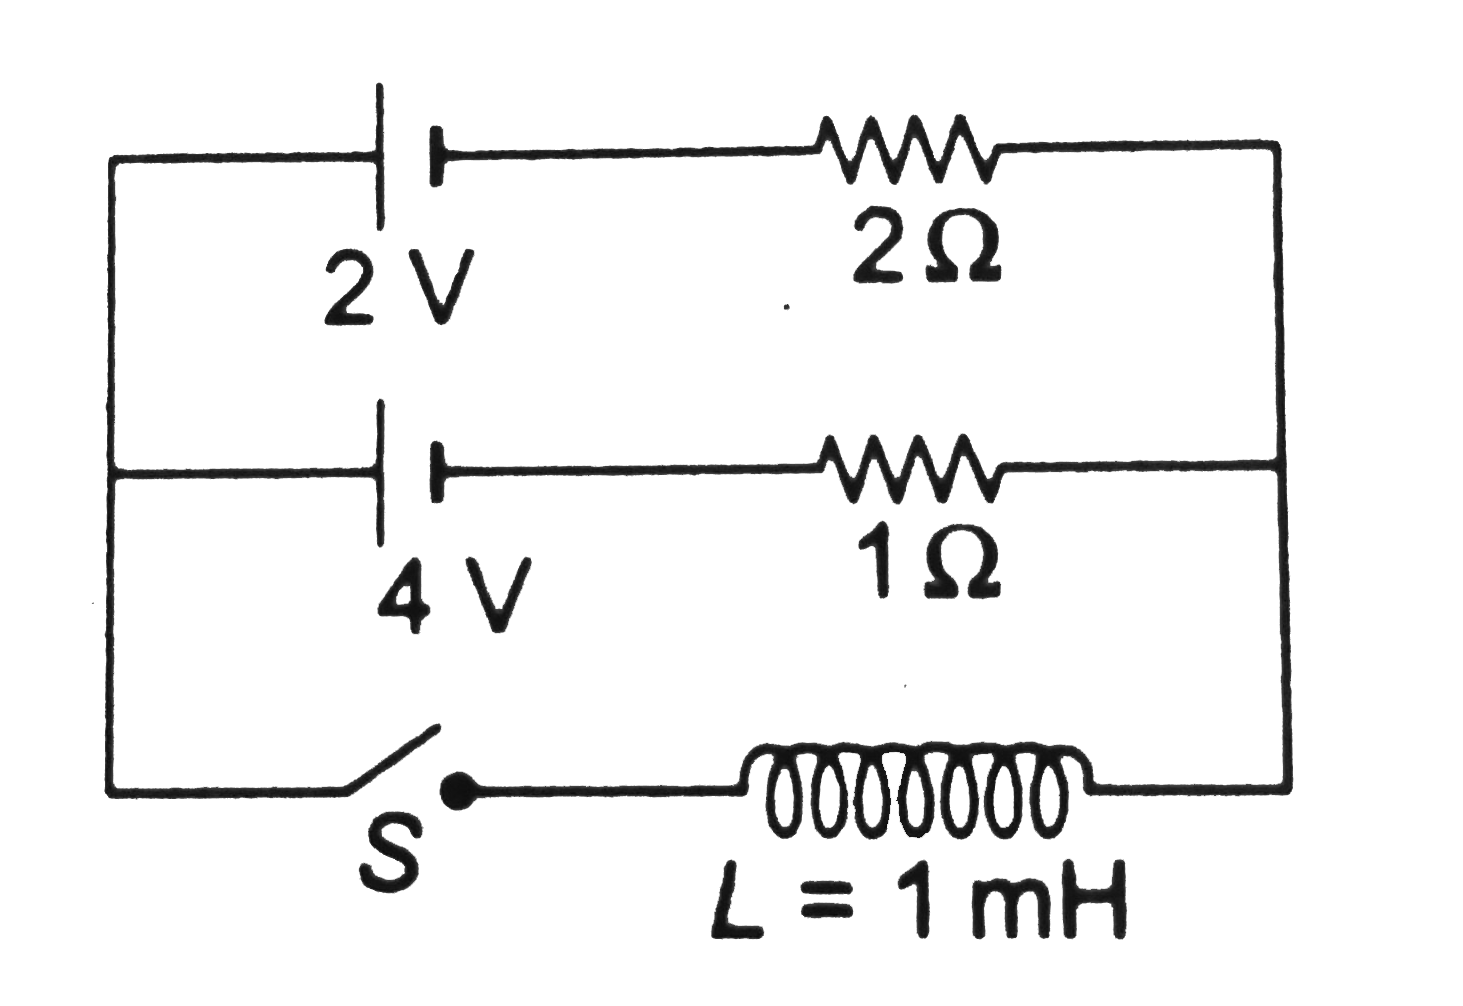
In the circuit shown in figure switch S is closed at time t=0
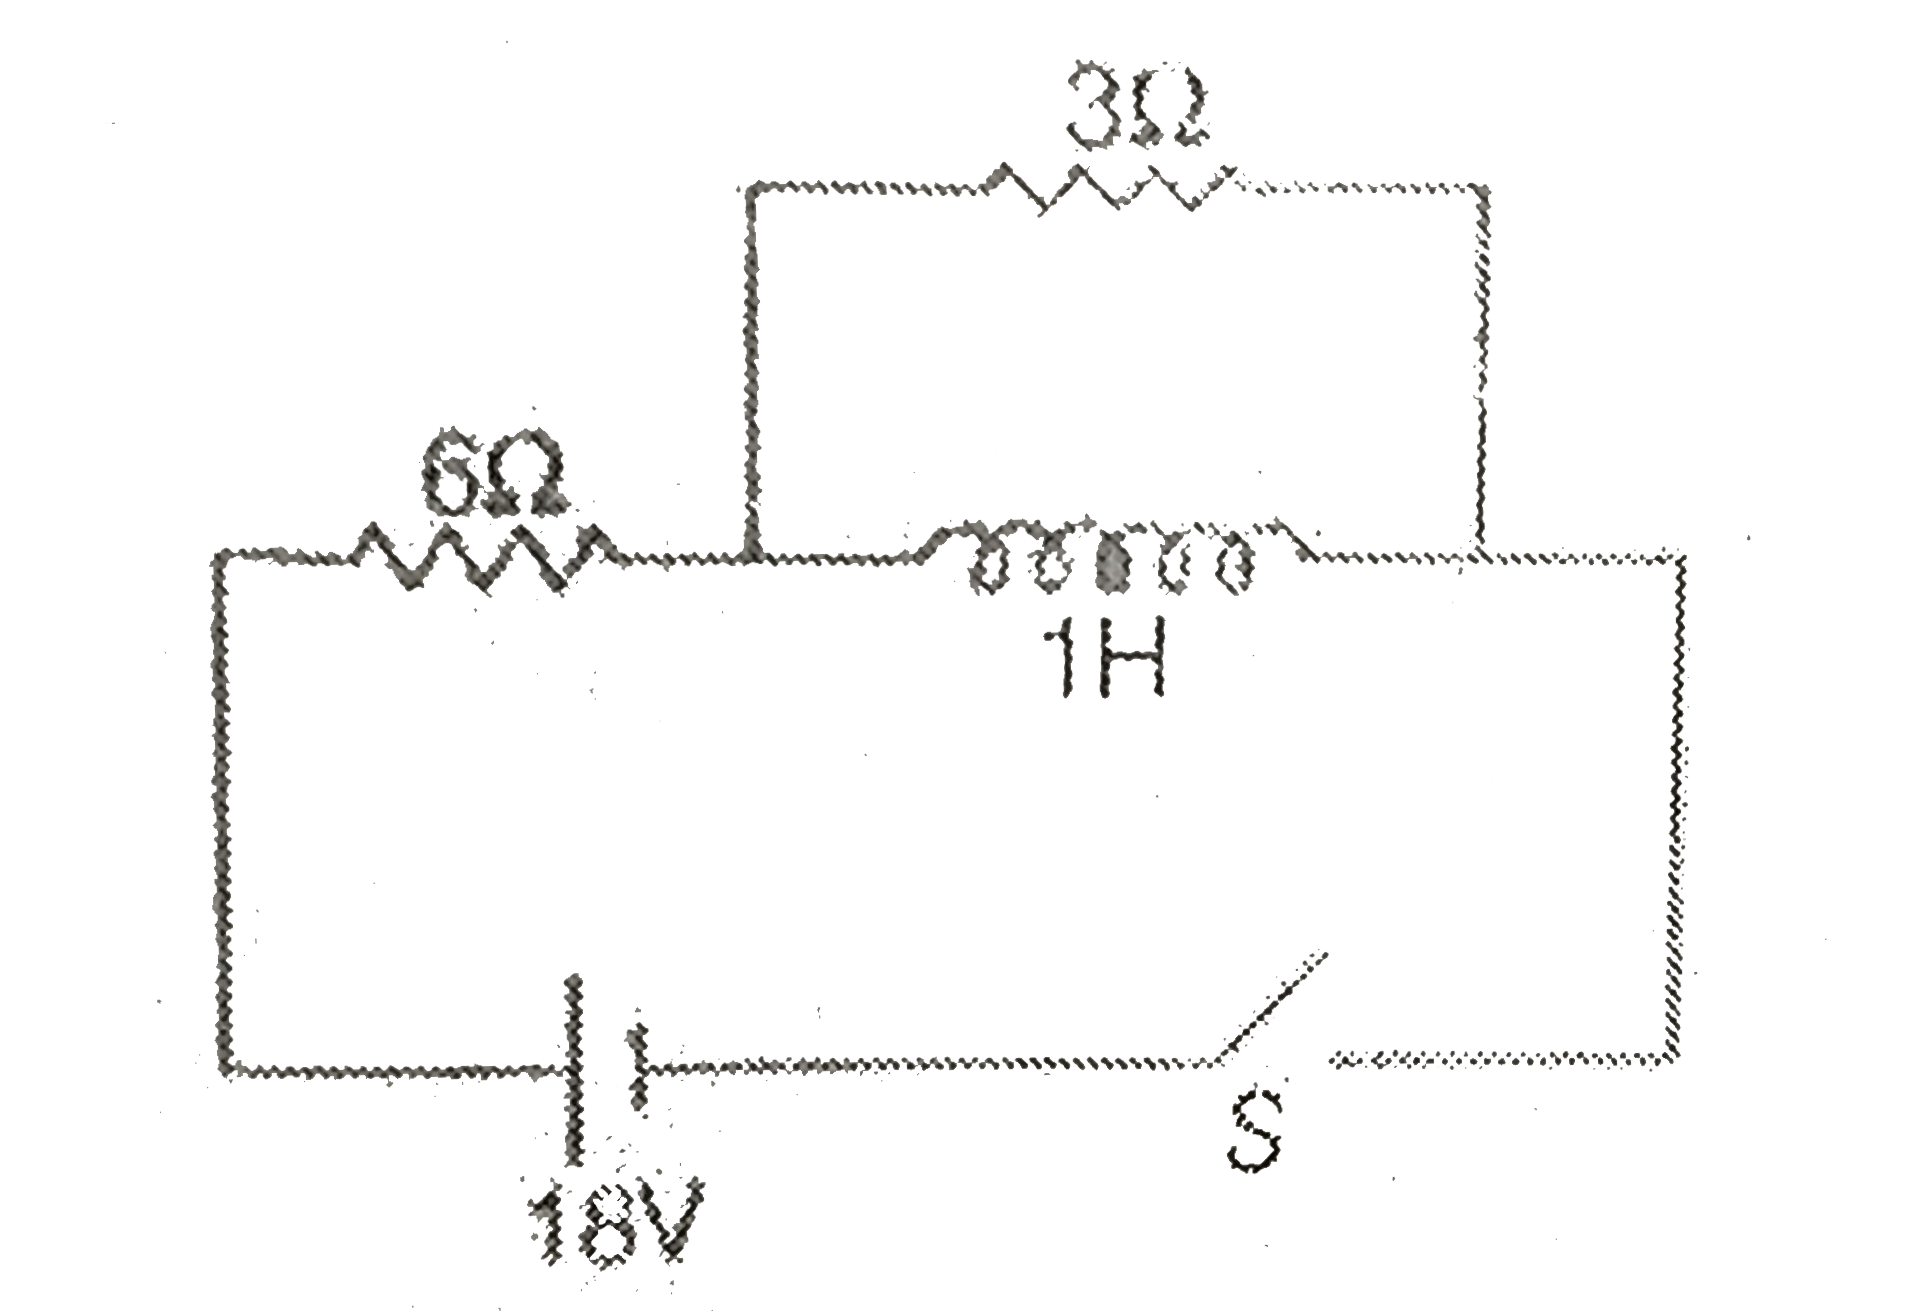
Current I from the battery at time t is given byA3(1−e−2t)B3+e−2t)C3(1-e^(-t/9))D3−e−2tIn the circuit shown in fig, if the switch S is closed at t=0 , the capacitor charges with a time constant
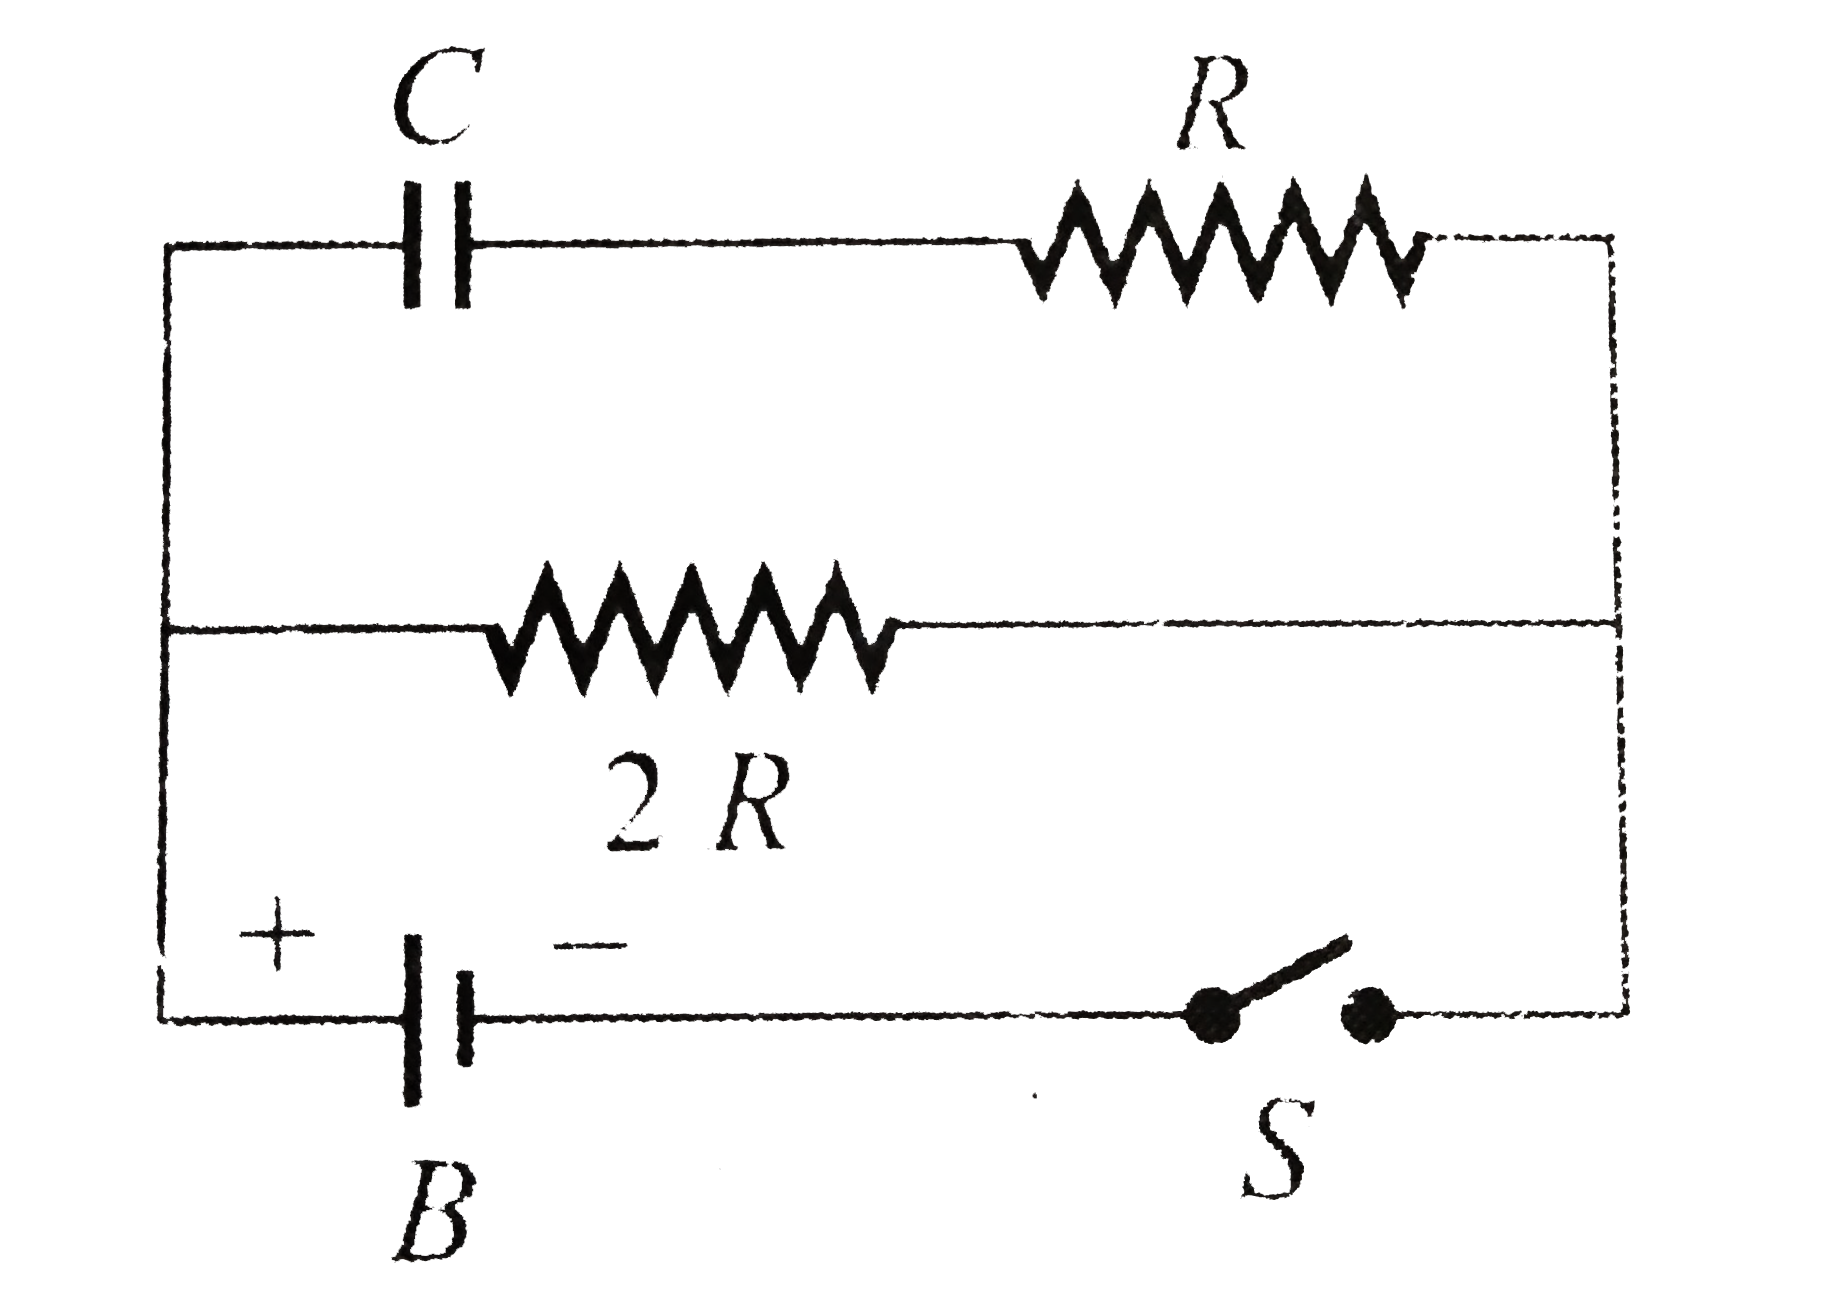 ARCB3RCC23RCDRCIn(23)
In the circuit shown below the switch is closed at t=0. For 0<t<R(C1+C2), the current I1 in the capacitor C1 in terms of total current I is
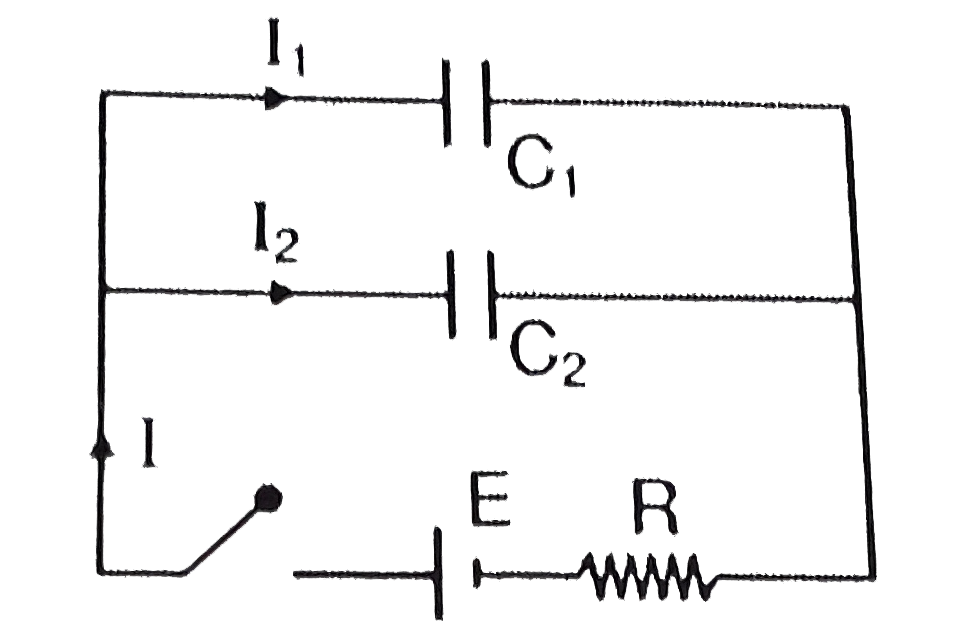 A(C1C2)IB(C2C1)IC(C1C1+C2)ID(C1(C1+C2))I
In the circuit shown in figure switch S is closed at time t=0

Current I from the battery at time t is given by
View SolutionIn the circuit shown in fig, if the switch S is closed at t=0 , the capacitor charges with a time constant

View SolutionIn the circuit shown below the switch is closed at t=0. For 0<t<R(C1+C2), the current I1 in the capacitor C1 in terms of total current I is

View SolutionIn the circuit shown in figure switch S is closed at time t=0
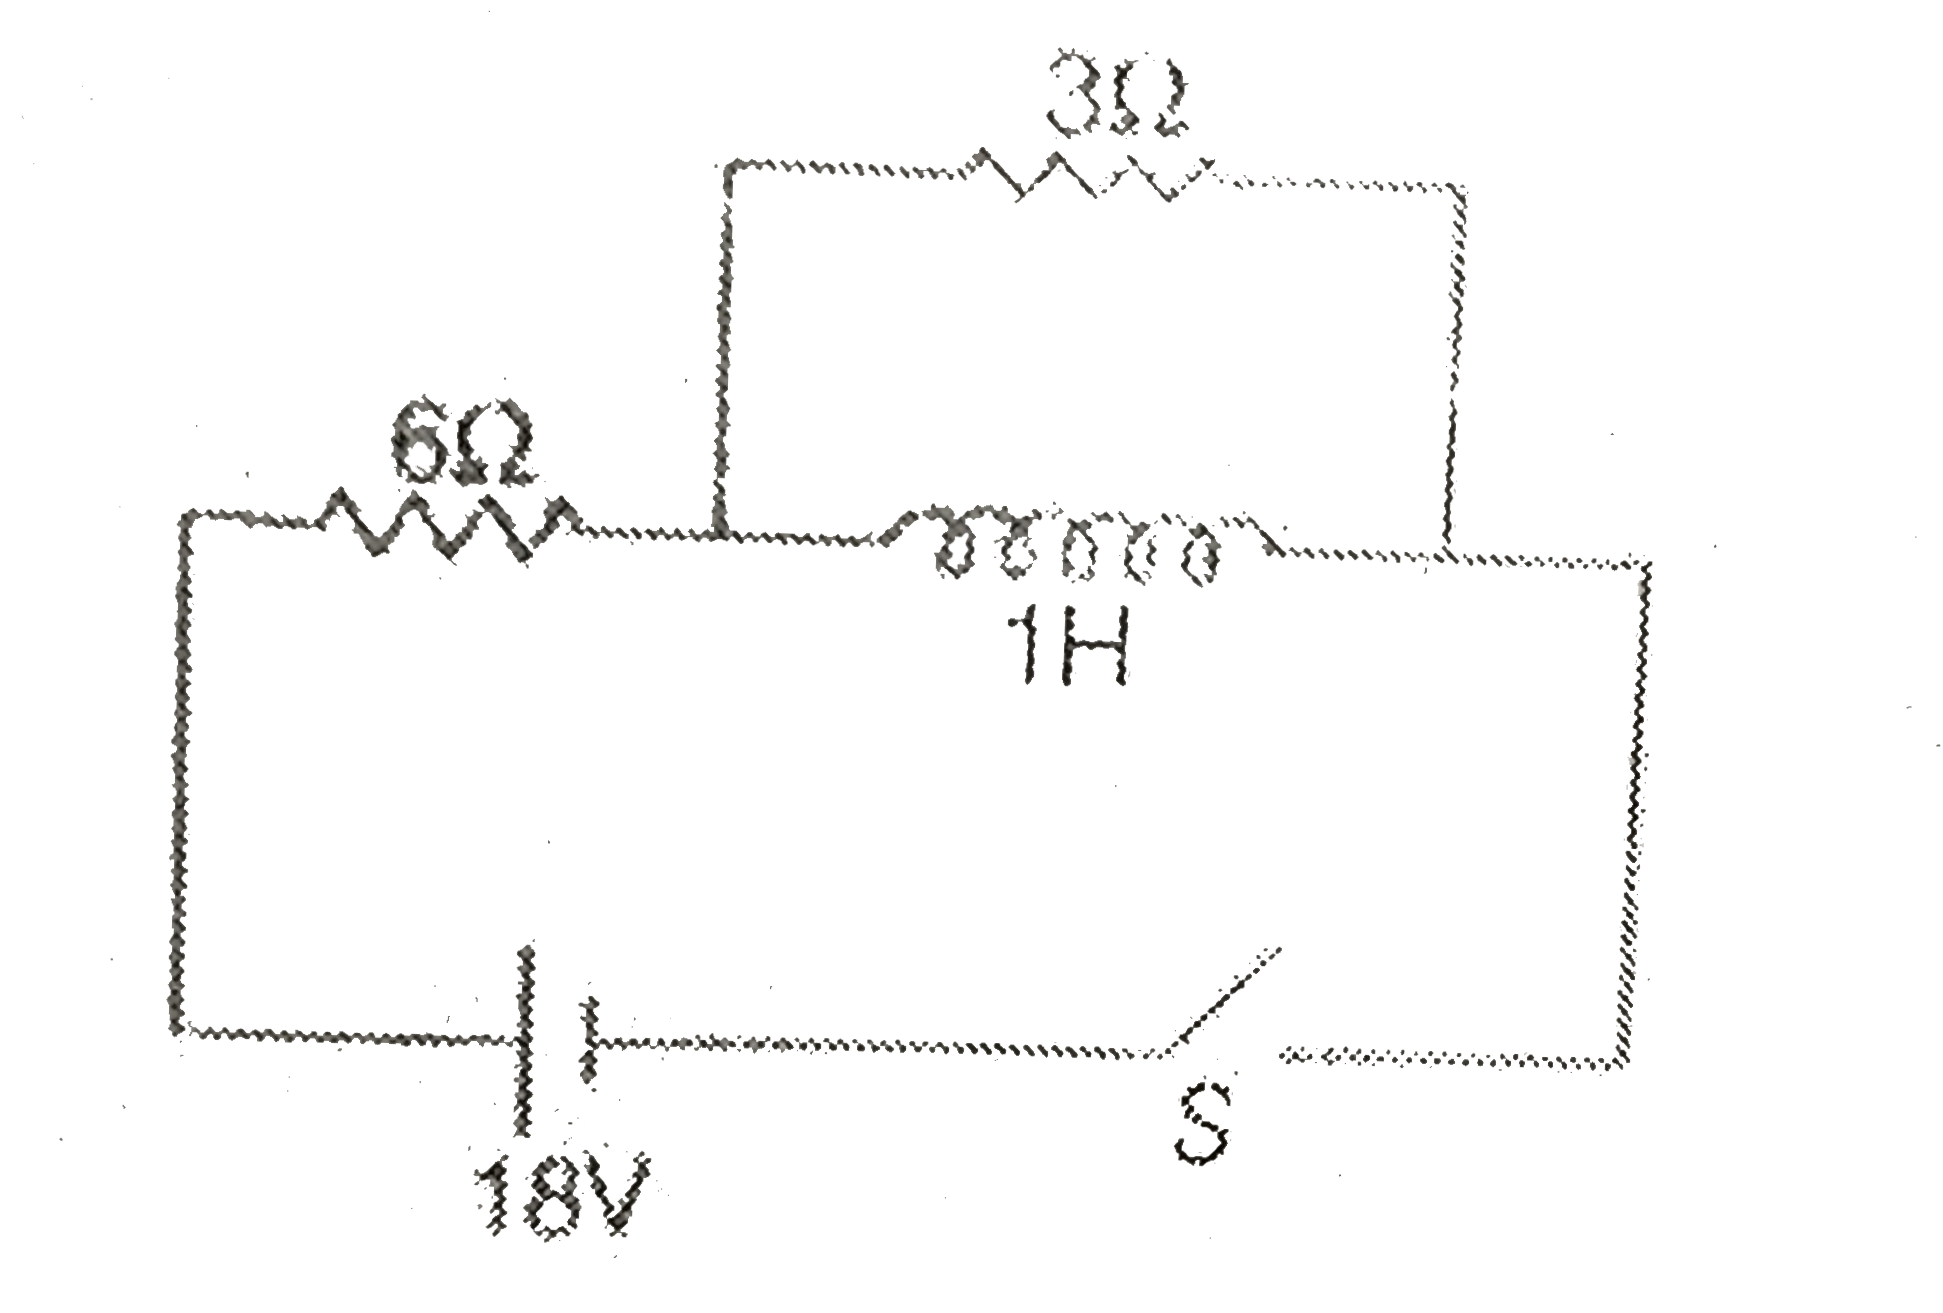
Potential difference across 3Ω resistance at time t is given by
View SolutionIn the circuit shown in figure switch S is closed at time t=0

Potential difference across 3Ω resistance at time t is given by
View Solution

