Which of the following graphs is correct with respect to phtotelectric effect ?
Where v → Frequency of EMR
KEmax→ Maximum kinetic energy of photon-electron
I→ Intensity of EMR ltbr> VS.P.→ Stopping potential
nPE→ Number of photon electron
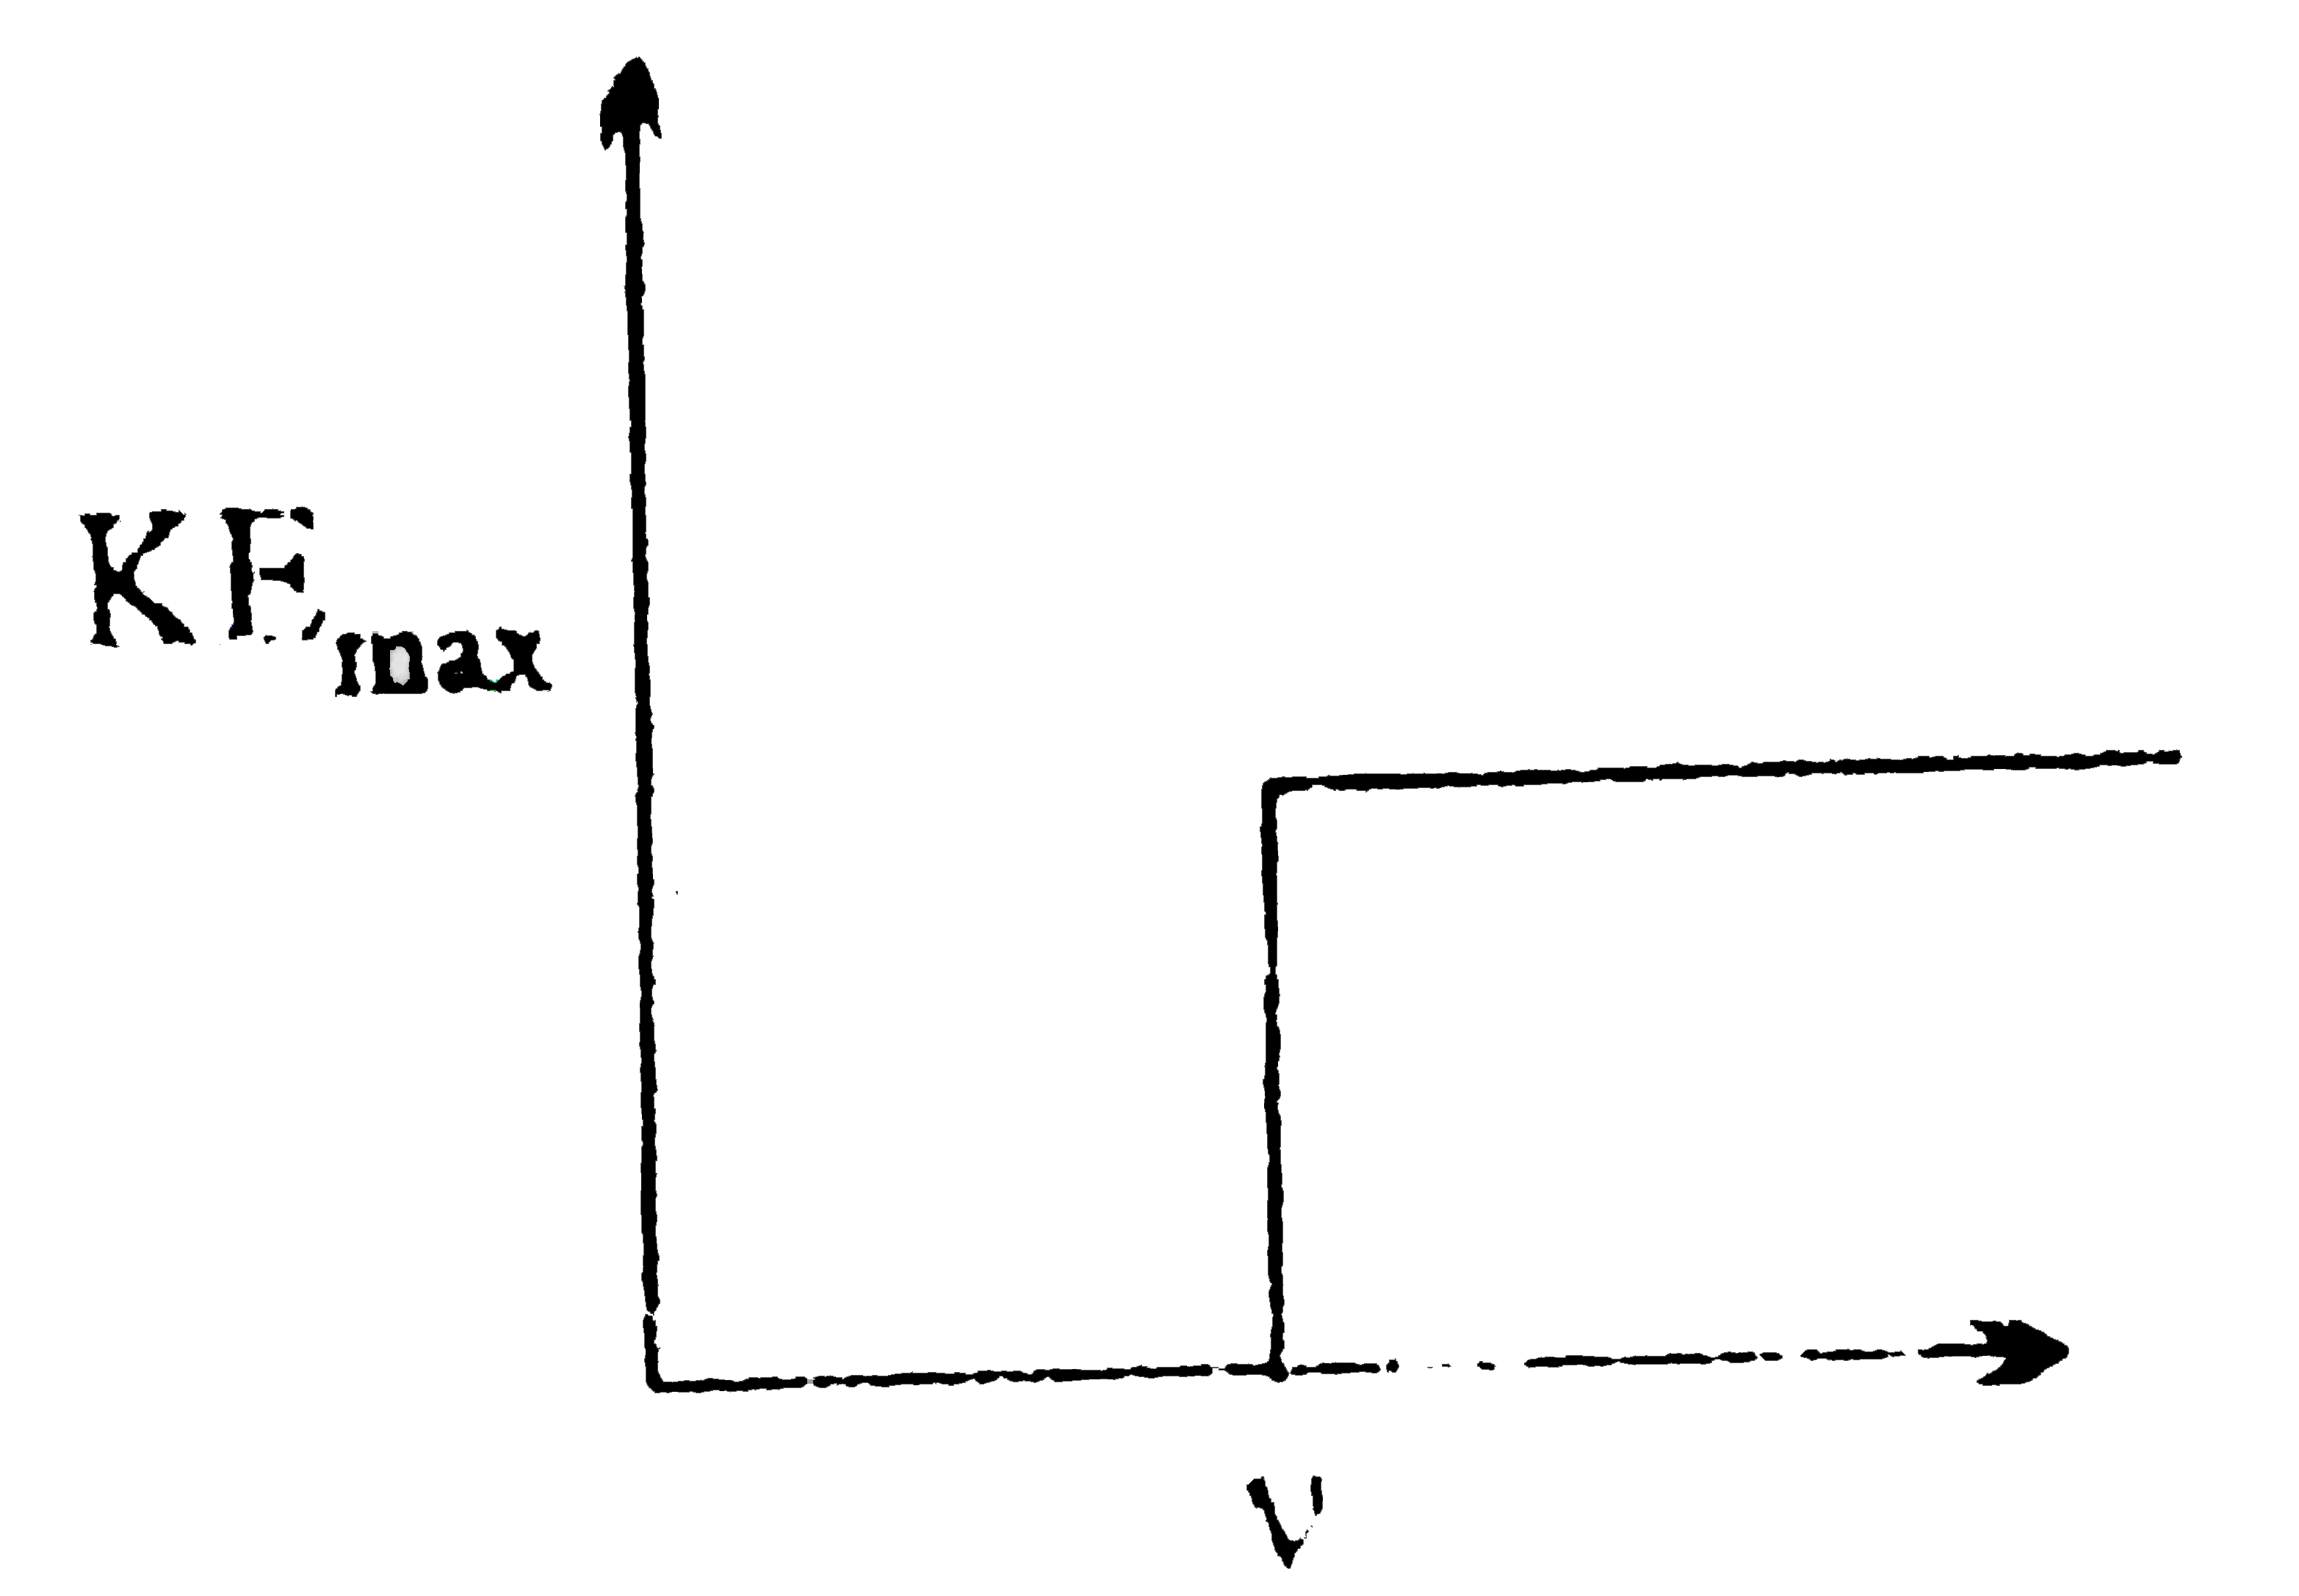
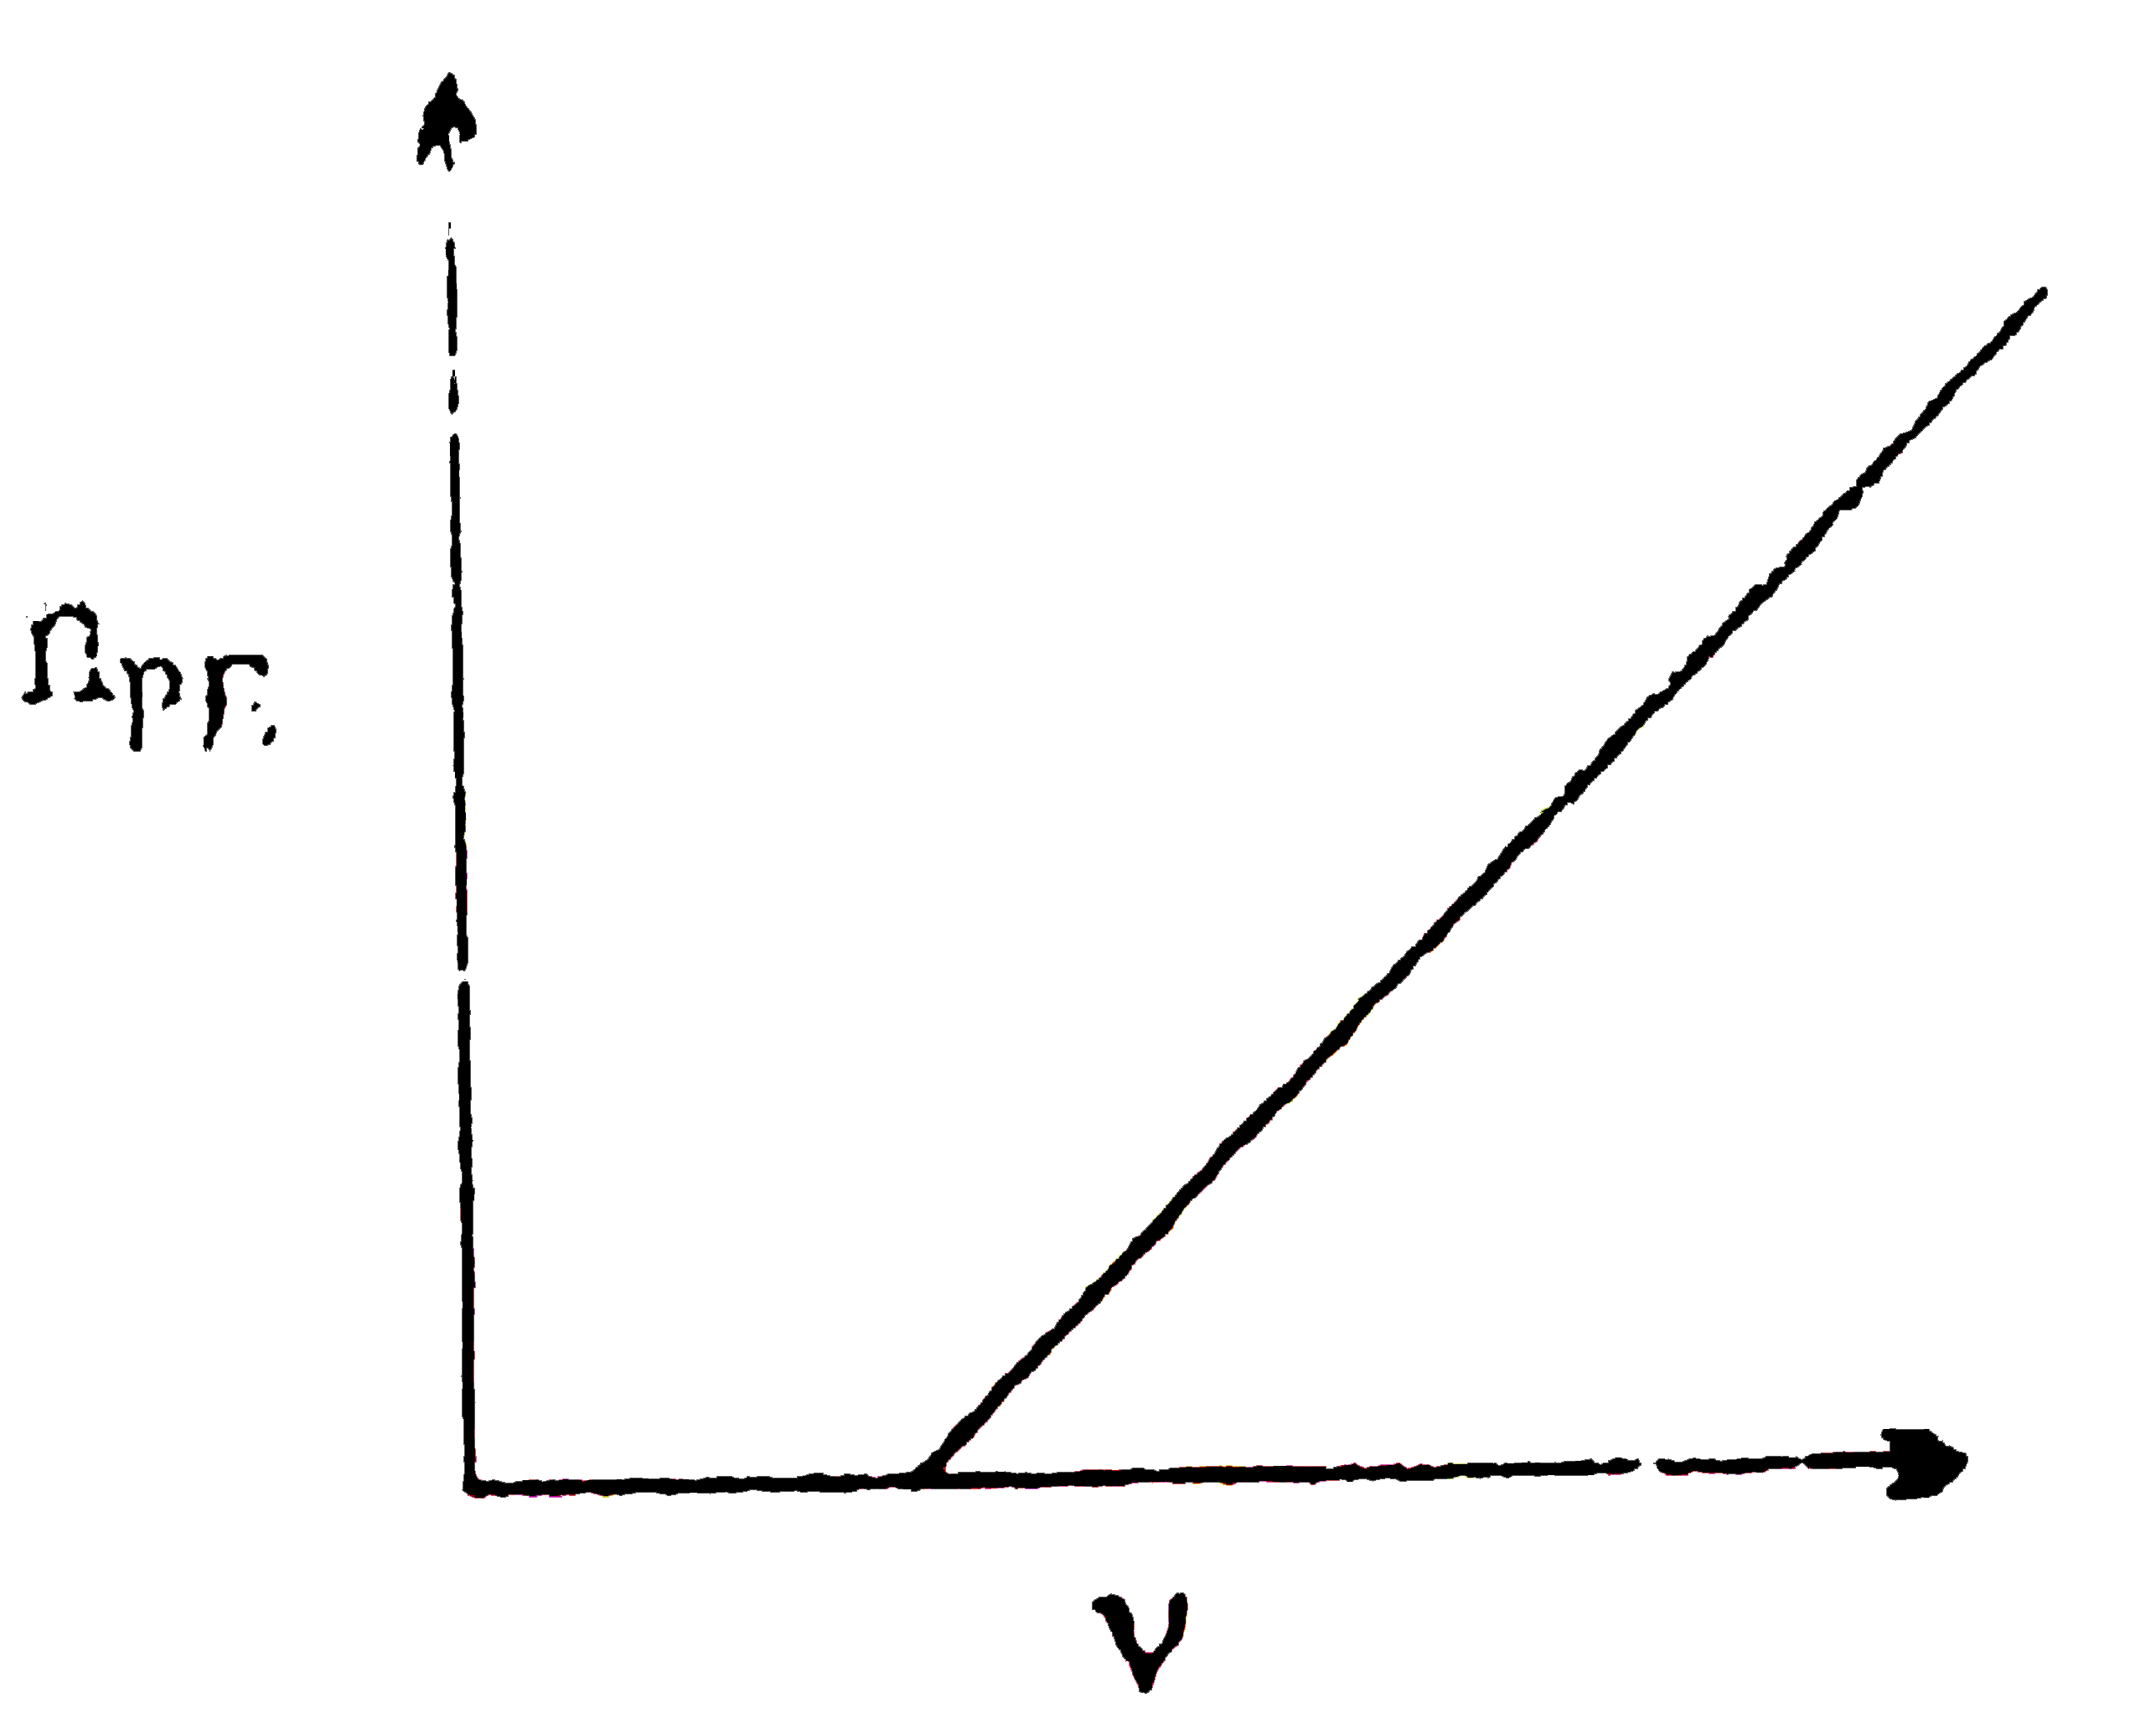
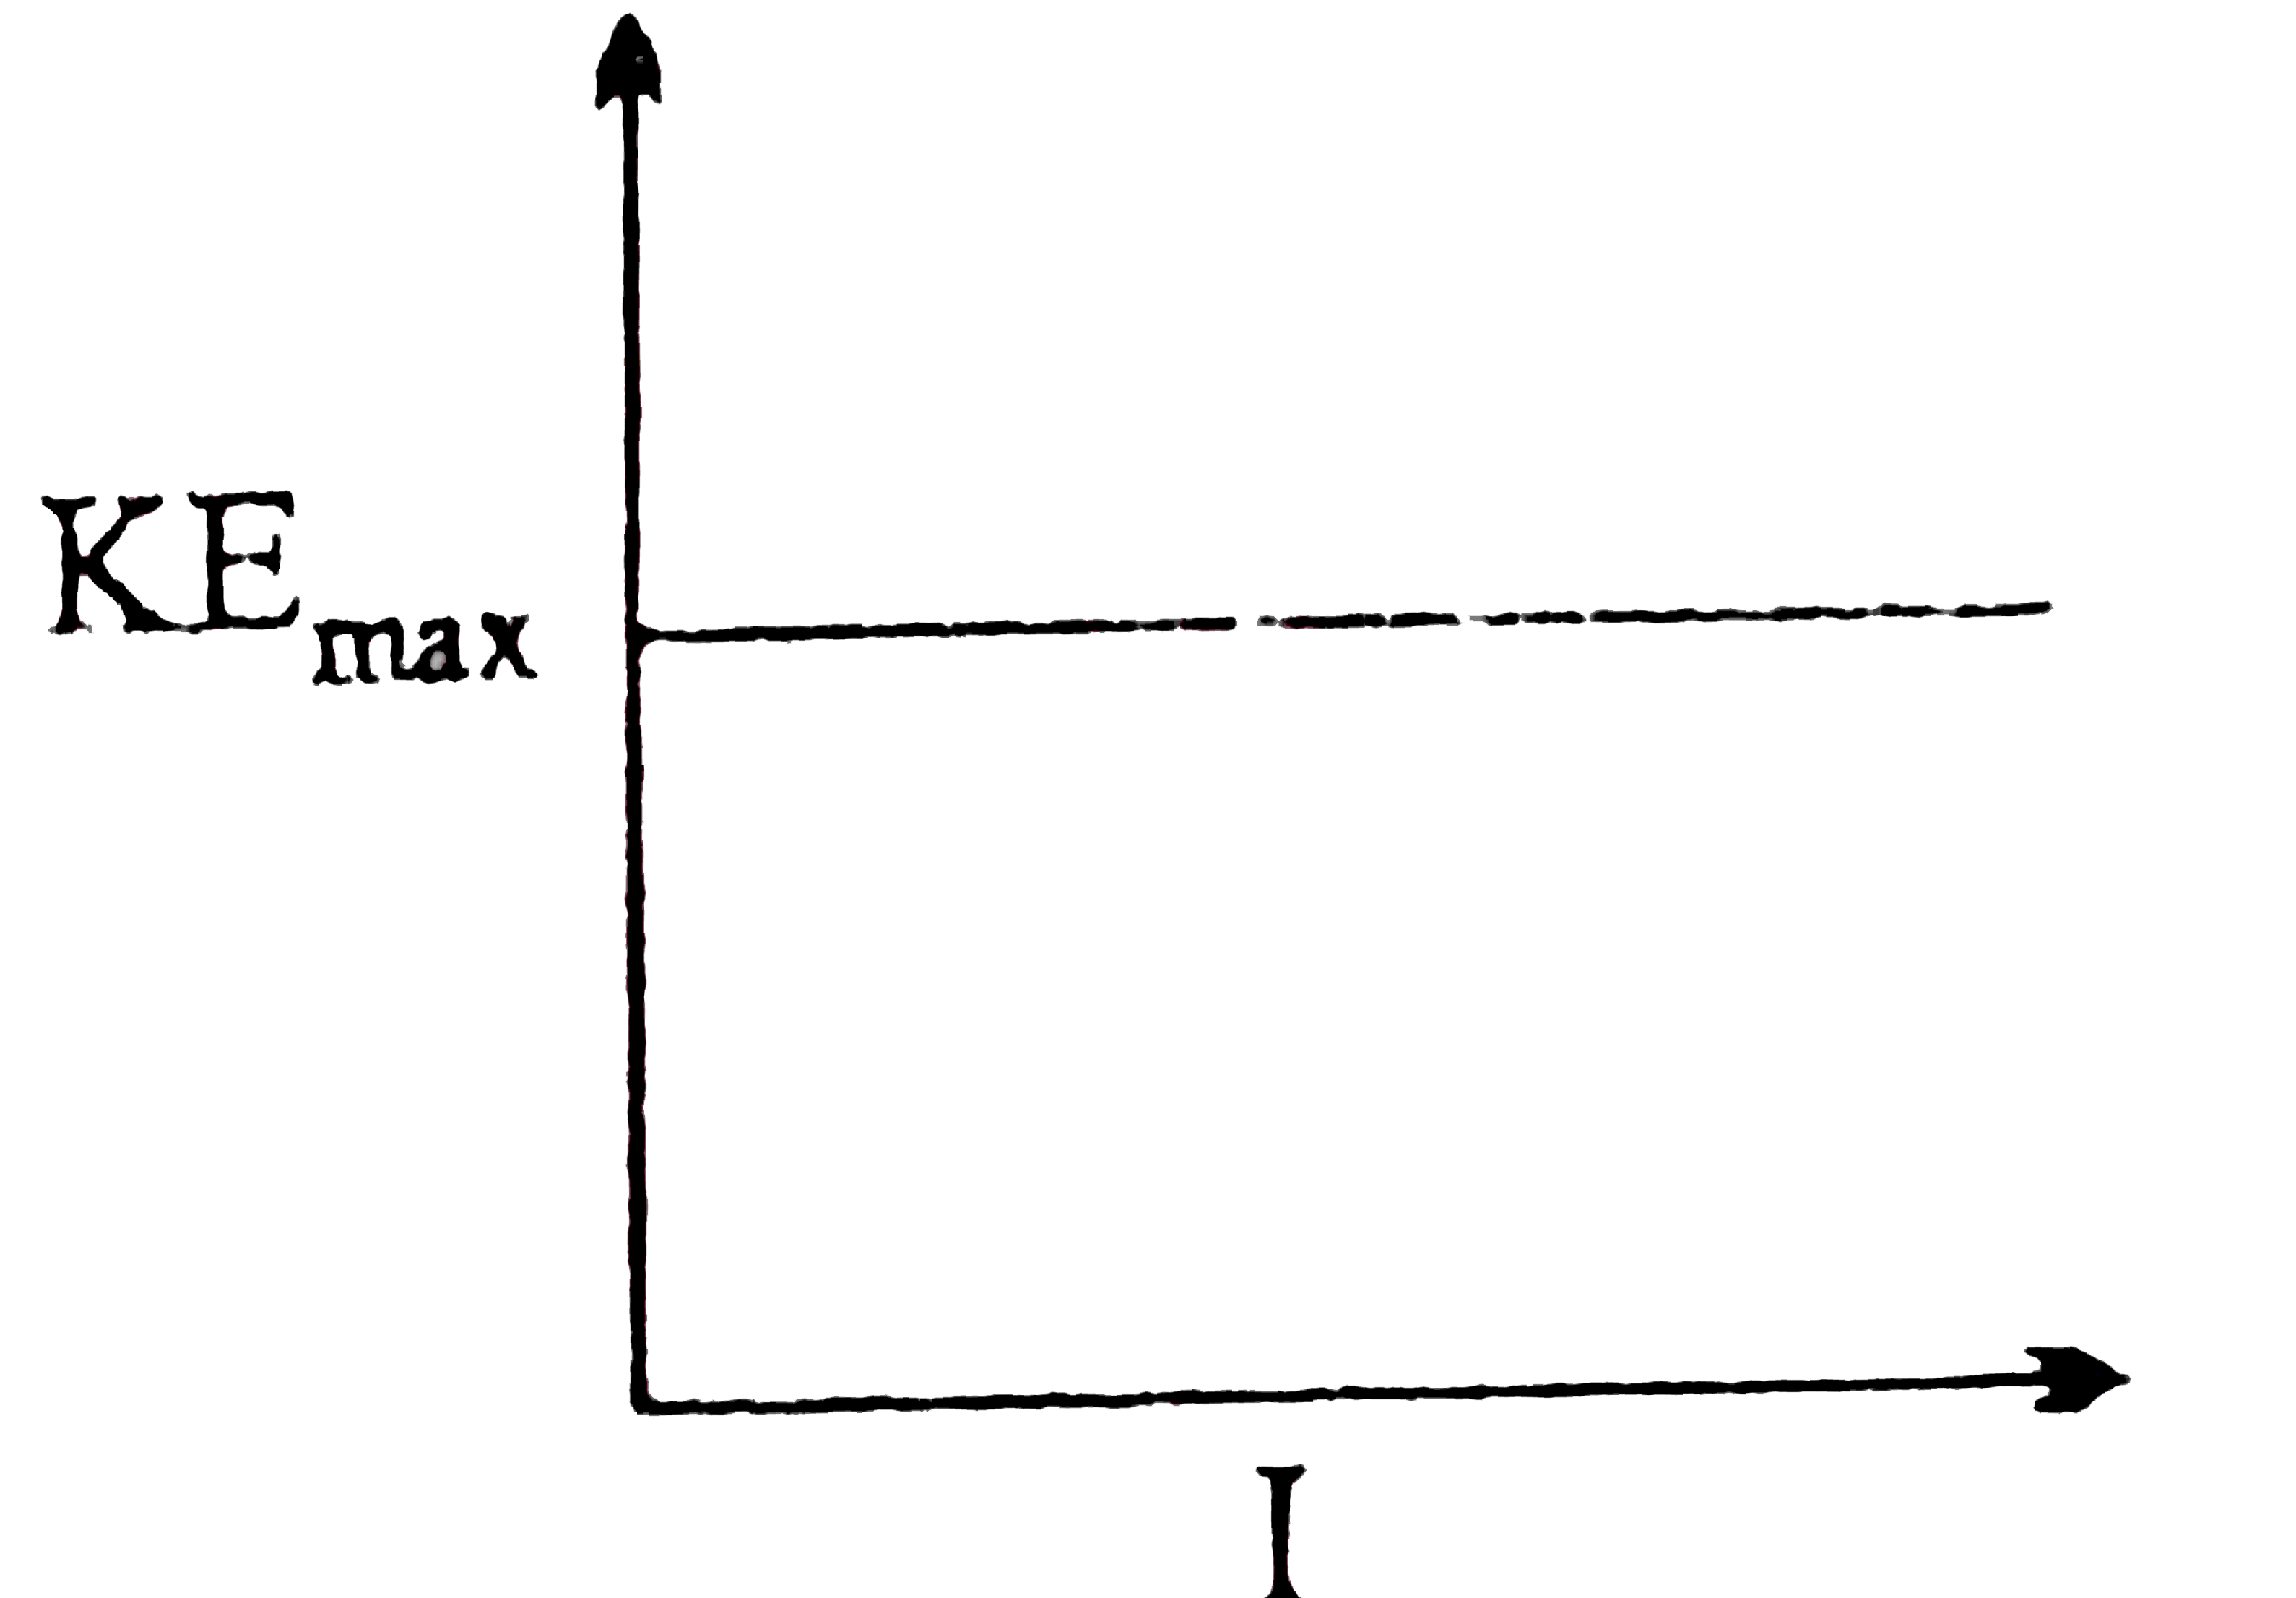
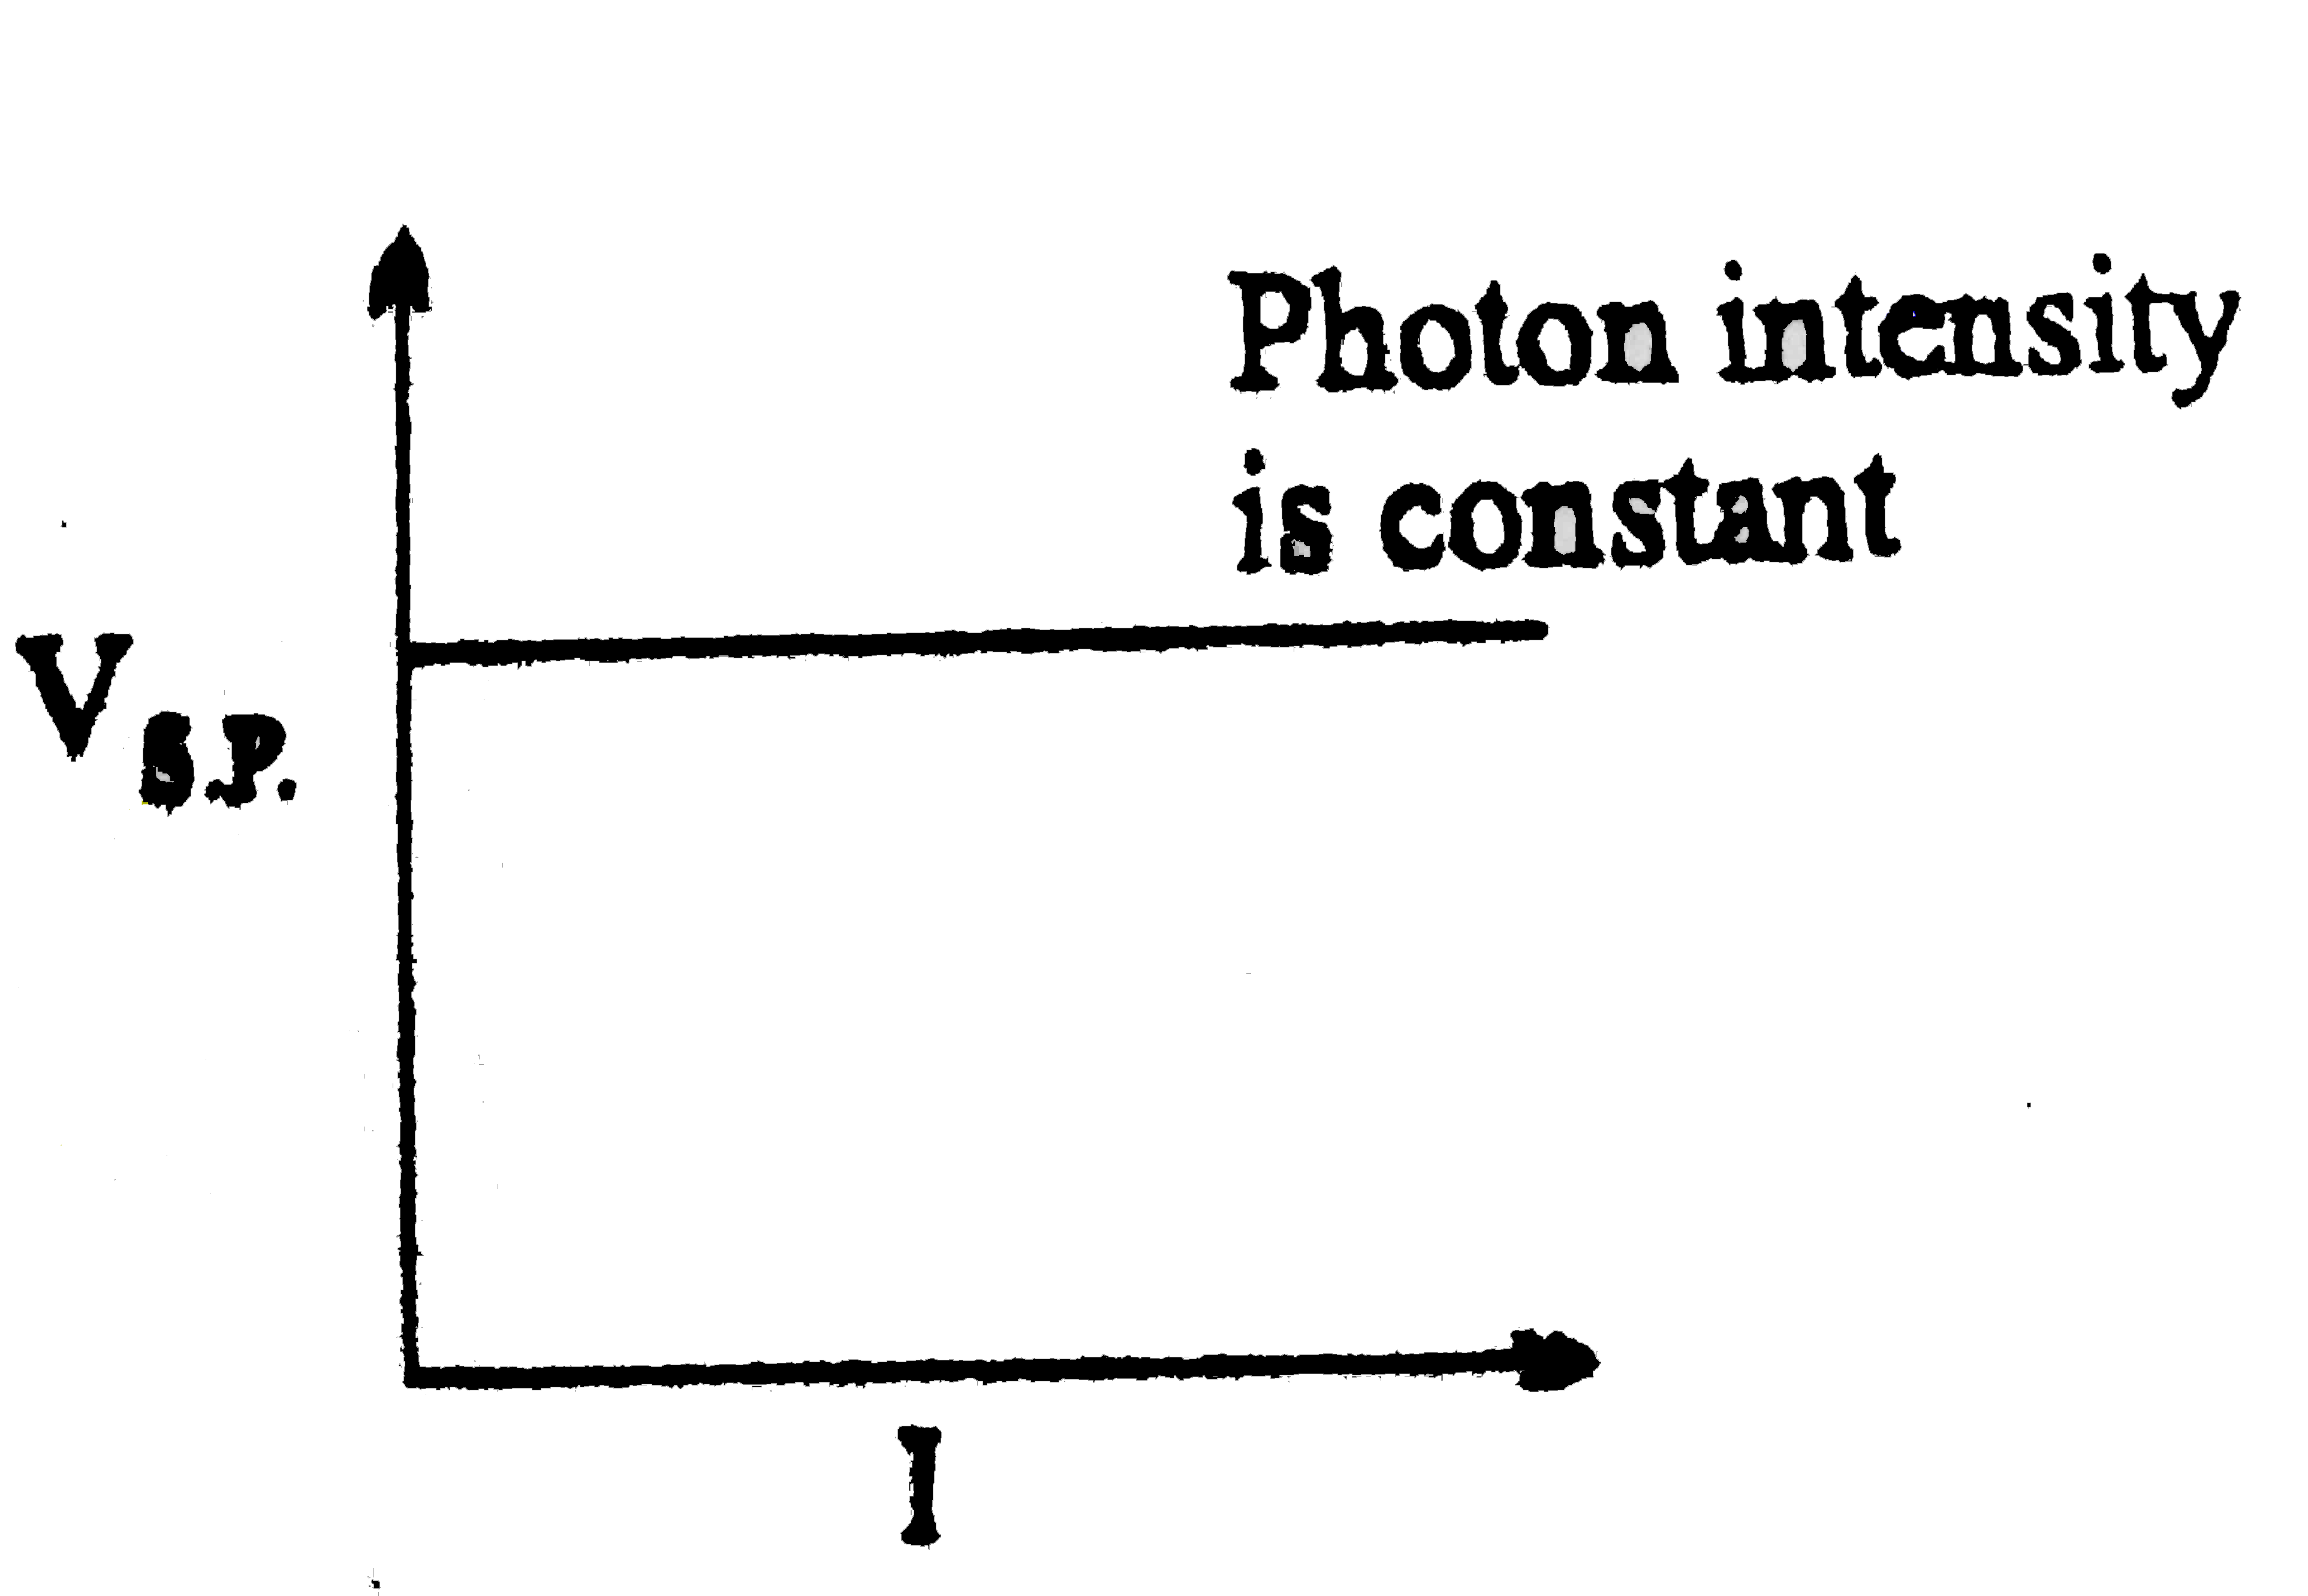
The correct Answer is:3
Step by step video, text & image solution for Which of the following graphs is correct with respect to phtotelectric effect ? Where v to Frequency of EMR KE_(max) to Maximum kinetic energy of photon-electron I to Intensity of EMR ltbr. V_(S.P.) to Stopping potential n_(PE) to Number of photon electron by Chemistry experts to help you in doubts & scoring excellent marks in Class 12 exams.
Updated on:21/07/2023Topper's Solved these Questions
- TEST PAPERSBOOK - BANSALCHAPTER - TEST PAPERSEXERCISE - CHEMISTRY PART (A)
14 Videos
- TEST PAPERSBOOK - BANSALCHAPTER - TEST PAPERSEXERCISE - CHEMISTRY PART (B)
1 Videos
- TEST PAPERSBOOK - BANSALCHAPTER - TEST PAPERSEXERCISE - Chemistry PART D
4 Videos
- SOLUTIONSBOOK - BANSALCHAPTER - SOLUTIONSEXERCISE - Exercise4
32 Videos
- THERMOCHEMISTRYBOOK - BANSALCHAPTER - THERMOCHEMISTRYEXERCISE - Exercise 4
15 Videos
Similar Questions
Knowledge Check
The maximum kinetic energy of photoelectrons emitted from a surface when photons of energy 6eV fall on it is 4eV . The stopping potential , in volt is
A4B6C8D10Which of the following option(s) is/are independent of both n and Z for H−like species?
Un= Potential energy of electron in nth orbit
KEn= Kinetic energy of electron in nth orbit
ln= Angular momentam of electoron in nth orbit
vn= Velcity of electron in nth orbit
fn= Frequency of electron in nth orbit
Tn= Time period of revolution of electron in nth orbitArnUnBrn×KEn×lnCUn×TnlnDln×fnv2nFor photoelectric effect with incident photon wavelength λ, the stopping potential is V0 Select the correct graph.
A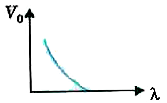 B
B C
C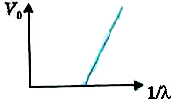 D
D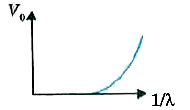
Which one of the following graphs represents the variation of maximum kinetic energy (EK) of the emitted electrons with frequency u in photoelectric effect correctly ?
View SolutionIn a photoelectric experiment, the potential required to stop the ejection of electrons from cathode is 4V. What is the value of maximum kinetic energy of emitted Photoelectrons?
View SolutionOf the following statement about the photoelectric effect, which are true and which are false?
(a) The greater the frequency of the incident light is, the greater is the stopping potential.
(b) The greater the intensity of the incident light is, the greater is the cutoff frequency.
(c) The greater the work function of the target material is, the greater is the stopping potential.
(d) The greater the work function of the target material is, the greater is the cutoff frequency.
(e) The greater the frequency of the incident light is, the greater is the maximum kinetic energy of the ejected electrons.
(f) The greater the energy of the photons is, the smaller is the stopping potential.
View SolutionIf photons of frequency v are incident on the surfaces of metals. A and B of threshold frequencies v2 and v3 respectively, the ratio of the maximum kinetic energy of electrons emitted from A to that from B is
View SolutionWhich of the following is correct regarding photo-electric effect?
(i) The photo-electric effect takes place if λ≤λ0 or υ≥υ0. maximum K.E. of photo-electron Kmax=hv=hcλ
Einstein photo-electric effect equation hv=hv0+Kmax
(ii) The maximum K.E. of electron or stopping potential Vs(Kmax=eVs) for a given metal depends only on frequency or wavelength of incident light and not on its intensity
(iii) The saturation current (i =ne, n: number of photo-electrons ejected per unit time) depends on intensity and not frequency
(iv) Normally it is assumed that one photon eject one electron. Practically several incident photons eject one electron. If quantum efficiency is given
{Quantum efficiency=Number of electrons ejectedNumber of photons incident}
Number of electrons ejected must be calculated must be calculated and then calculate saturation current
View Solution
