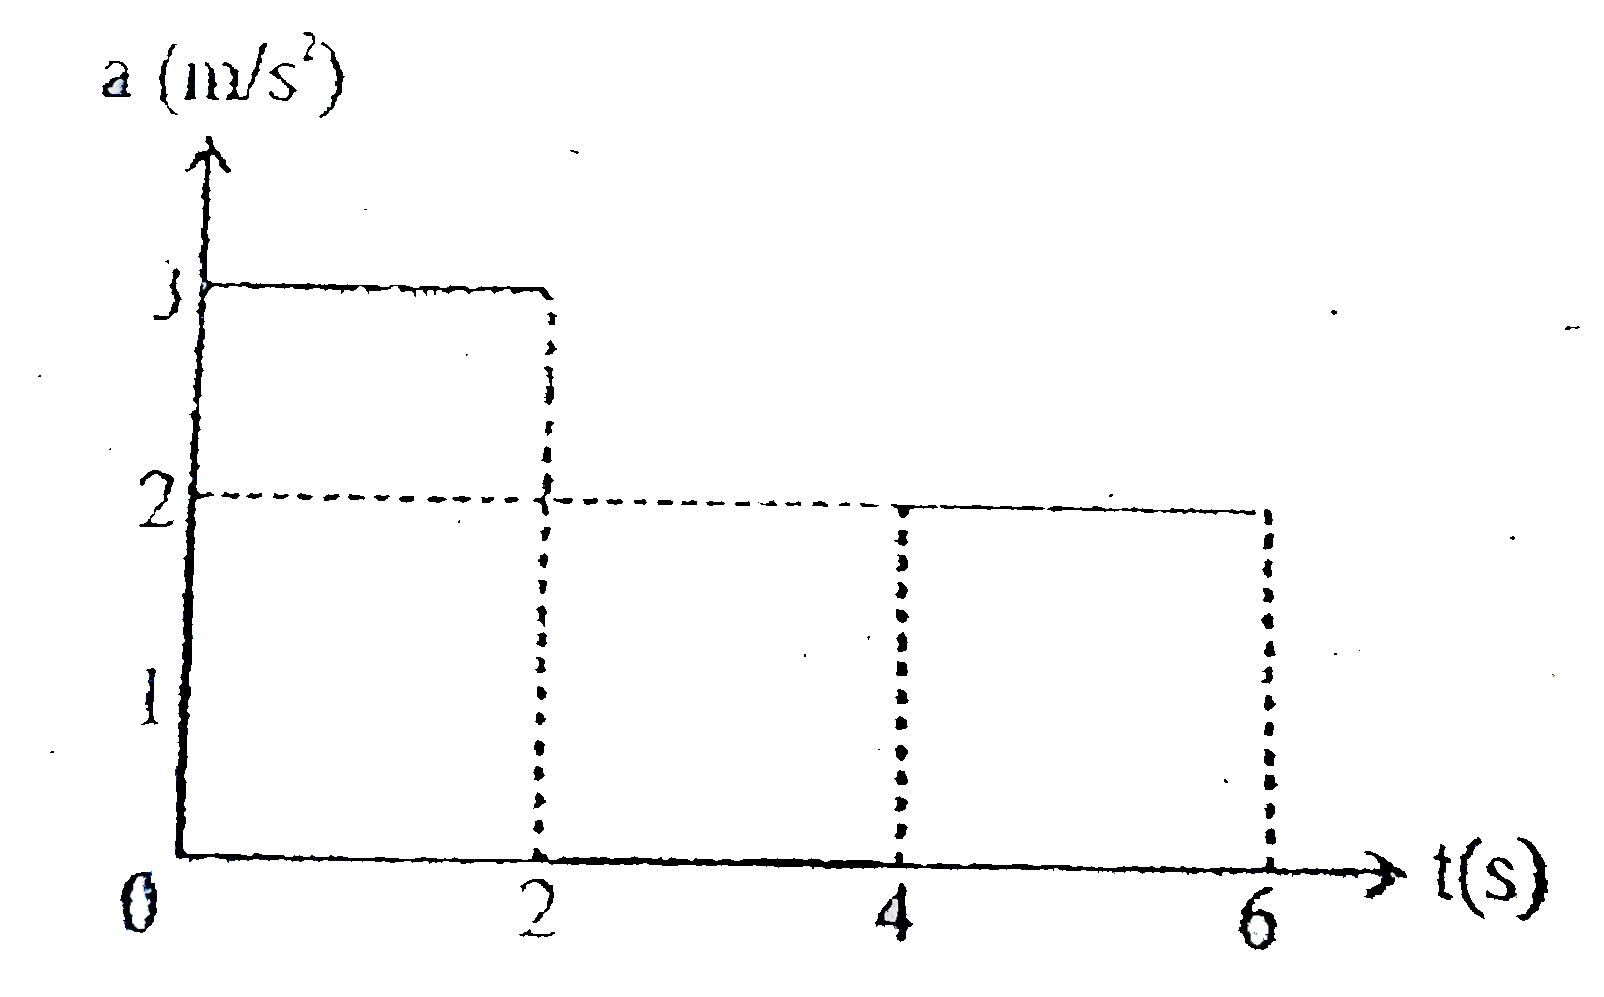
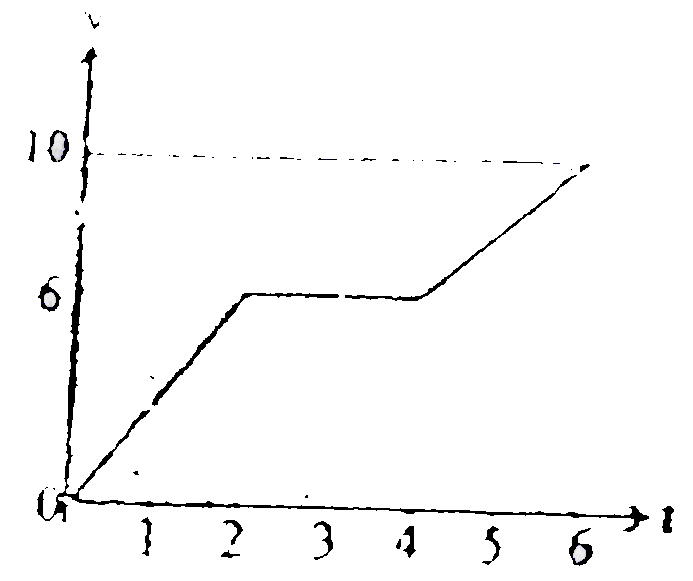
The dependence of the acceleration of a body with time is shown in Figure. At t=0, the velocity of the body is −3m/s and position is x=0m.
The velocity time graph is
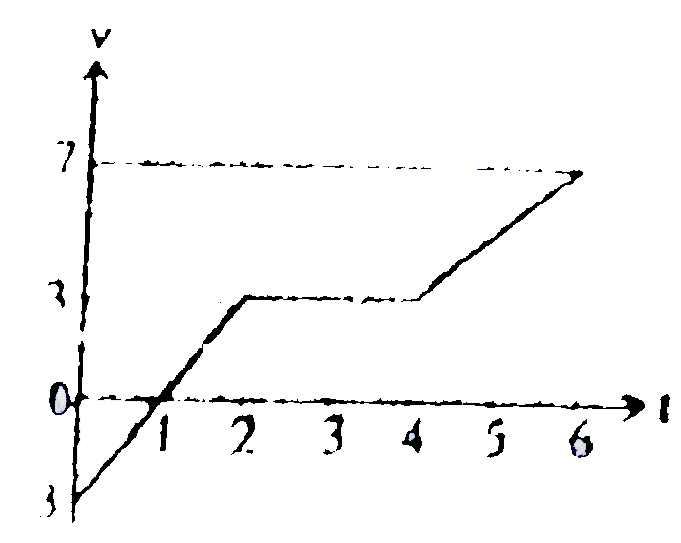
The velocity time graph is
The position time graph is
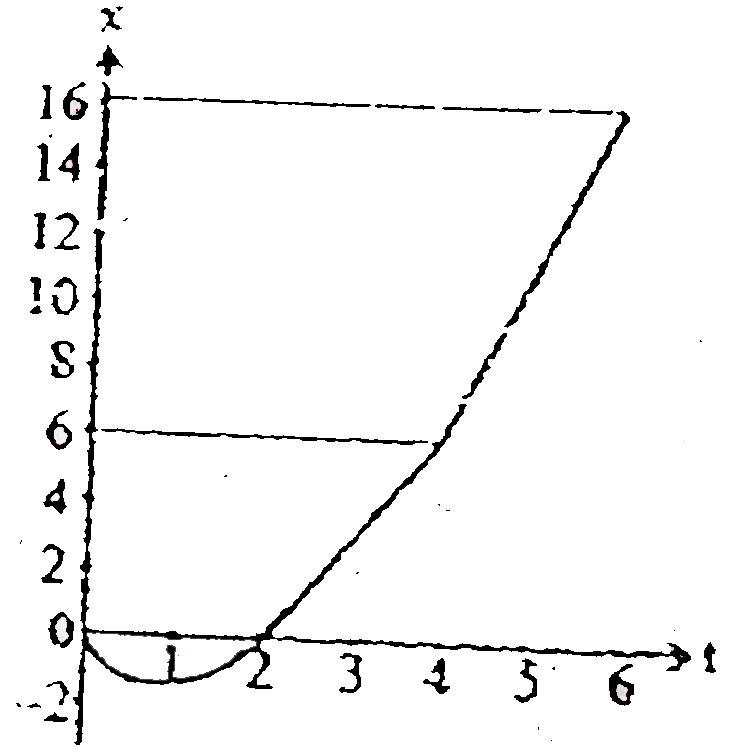
The position time graph is
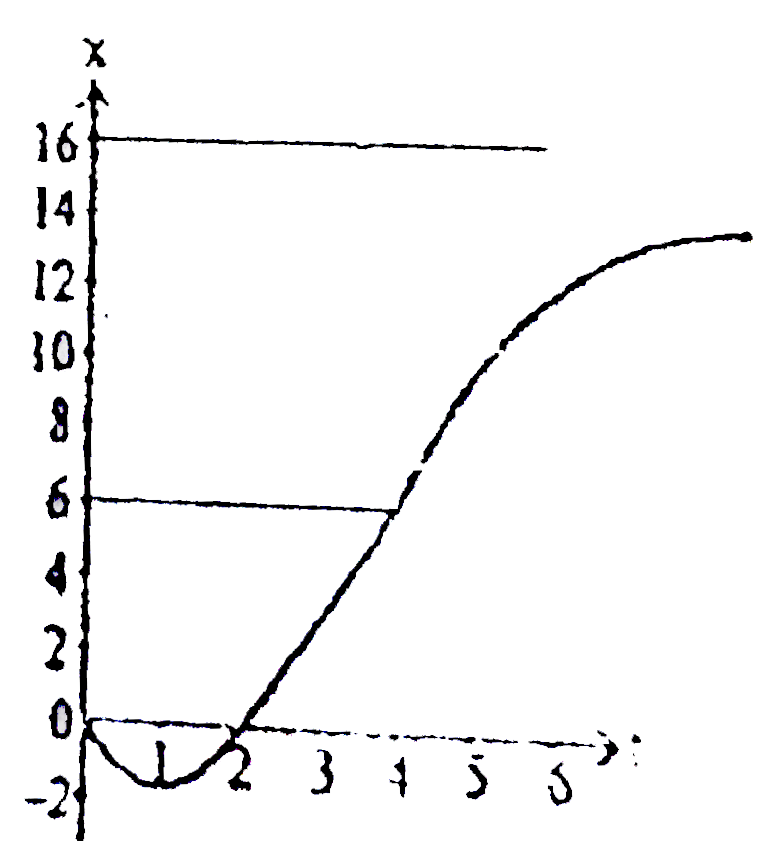
The correct Answer is:A
N/A
Topper's Solved these Questions
- BOOK - ALLENCHAPTER - TEST PAPEREXERCISE - Exercise (Physics)330videos
TEST PAPER
- BOOK - ALLENCHAPTER - TEST PAPEREXERCISE - PHYSICS4videos
TEST PAPER
- BOOK - ALLENCHAPTER - SIMPLE HARMONIC MOTIONEXERCISE - Example1videos
SIMPLE HARMONIC MOTION
- BOOK - ALLENCHAPTER - TEST PAPER 1EXERCISE - PHYSICS11videos
TEST PAPER 1
Similar Questions
The displacement time graph of a body in motion is given as shown in the figure. Velocity of body is? (in m/s)
View SolutionVelocity-time graph of a particle moving in a straight line is shown in figure. At time t=0, displacement of the particle from mean position is 10 m. Find
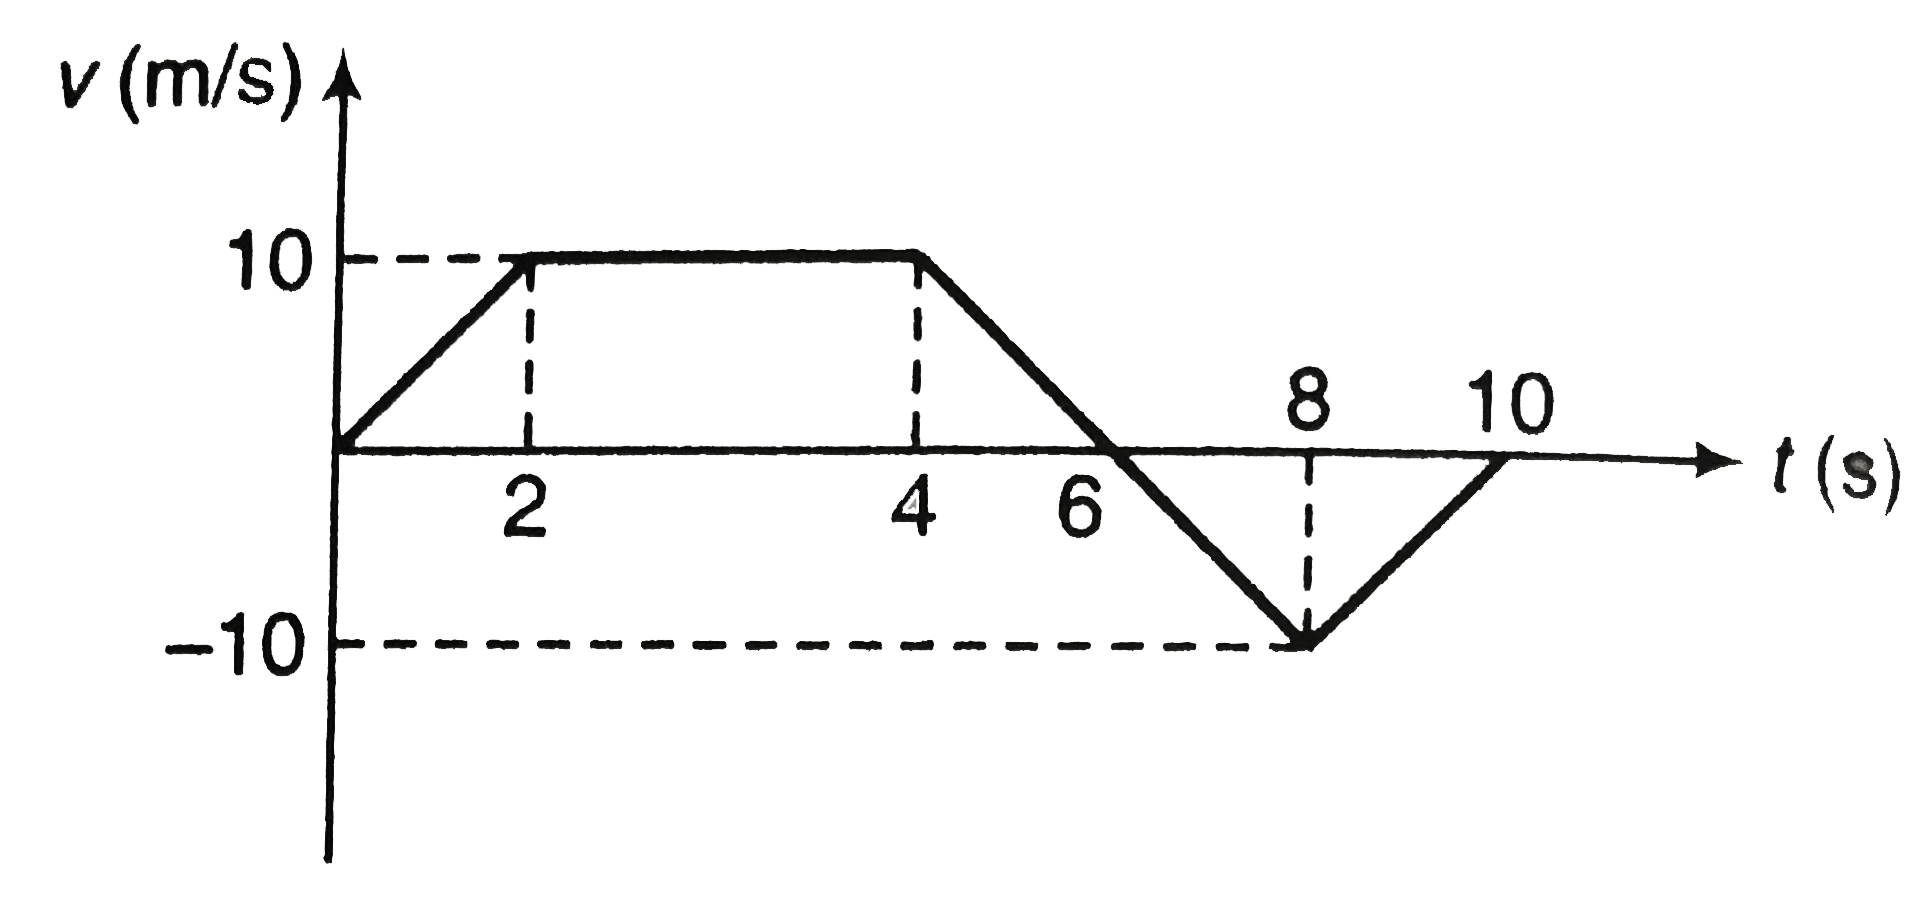
(a) acceleration of particle at t=1s,3sand9s.
(b) position of particle from mean position at t=10s.
(c) write down s-t equation for time interval (i)0≤t≤2s, (ii) 4s≤t≤8sView Solution
Knowledge Check
- Question 1 - Select One
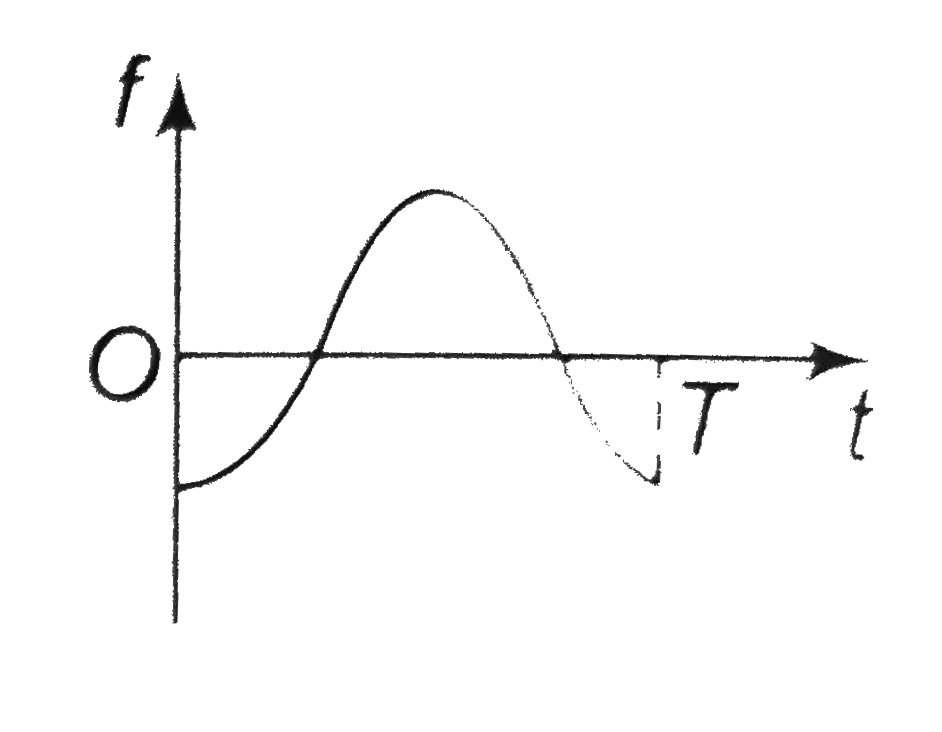
A body is performing simple harmonic motion with amplitude A and time period T variation of its acceleration (f) with time(t) is shown in figure If a line x velocity of the body is x which of the following graph is correct?
 A
A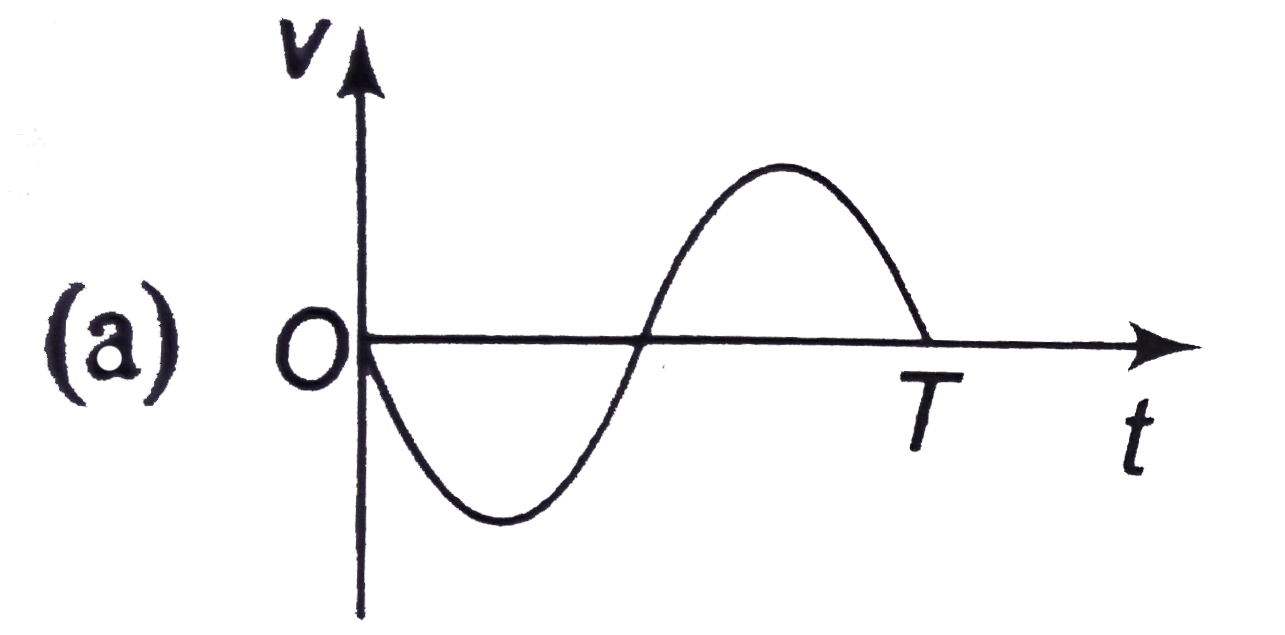 B
B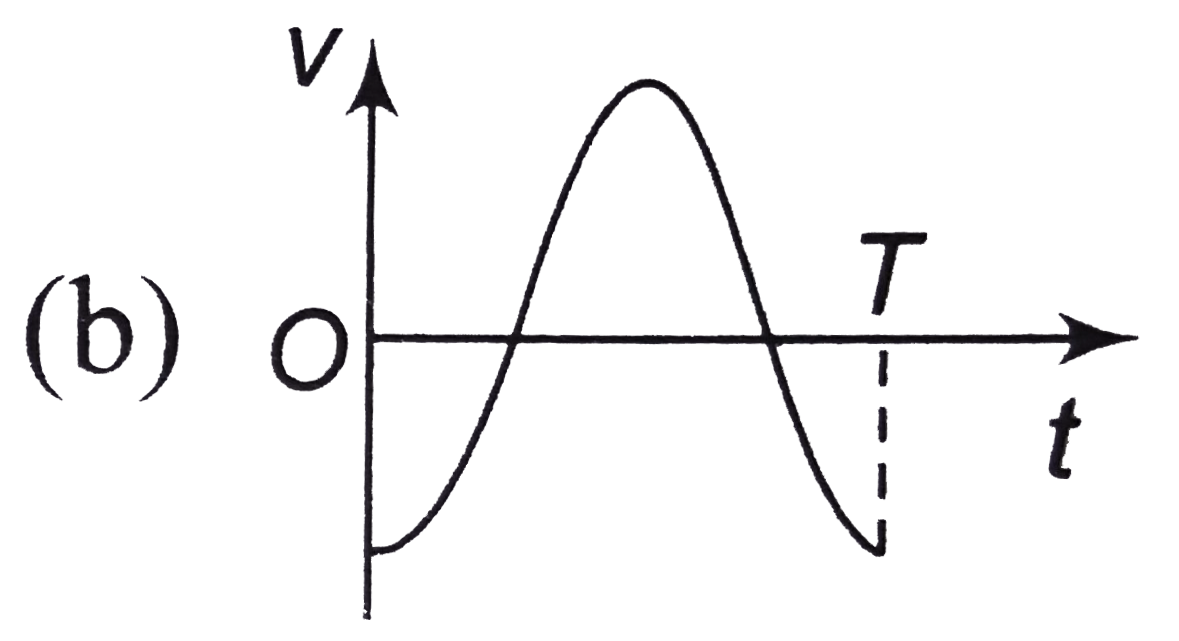 C
C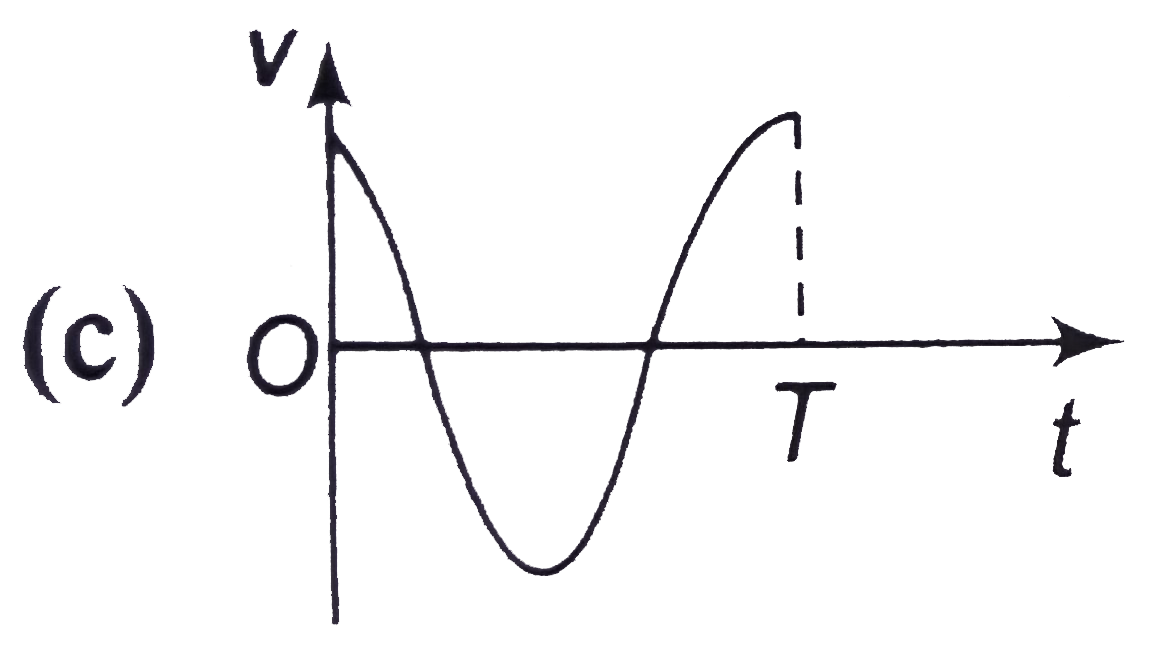 D
D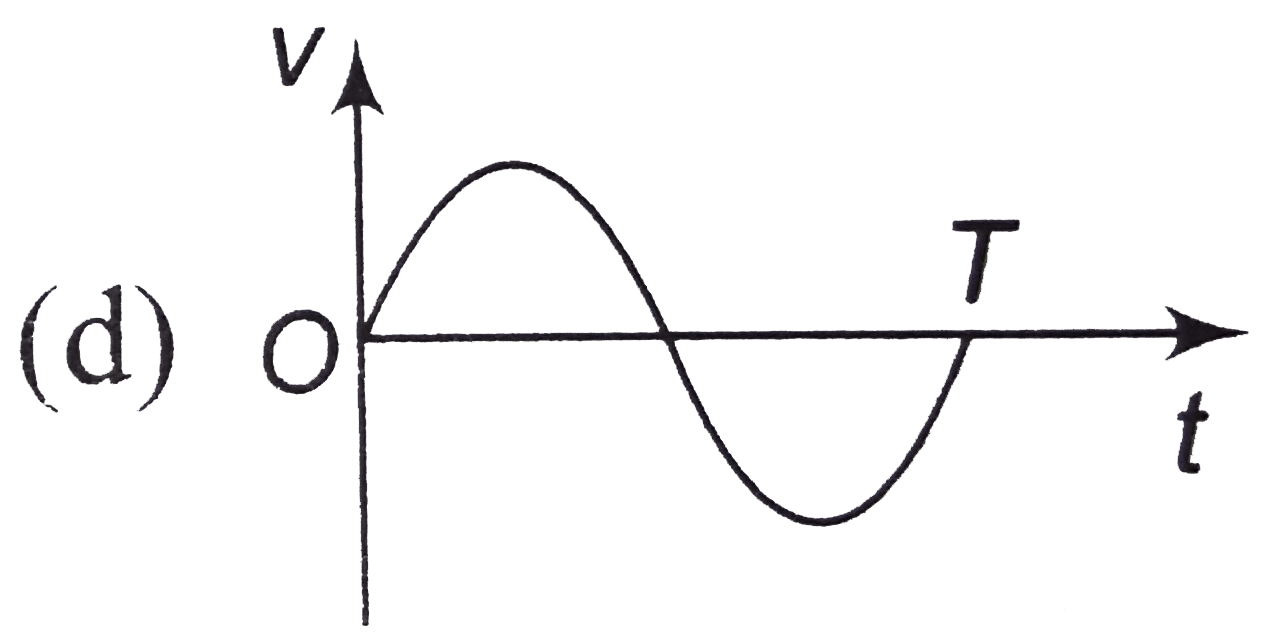
- Question 2 - Select One
In figure shown, the graph shows the variation of acceleration of body with time t. The velcocity of the body at t=0 is zero. The velocity of the body at t=30s is.
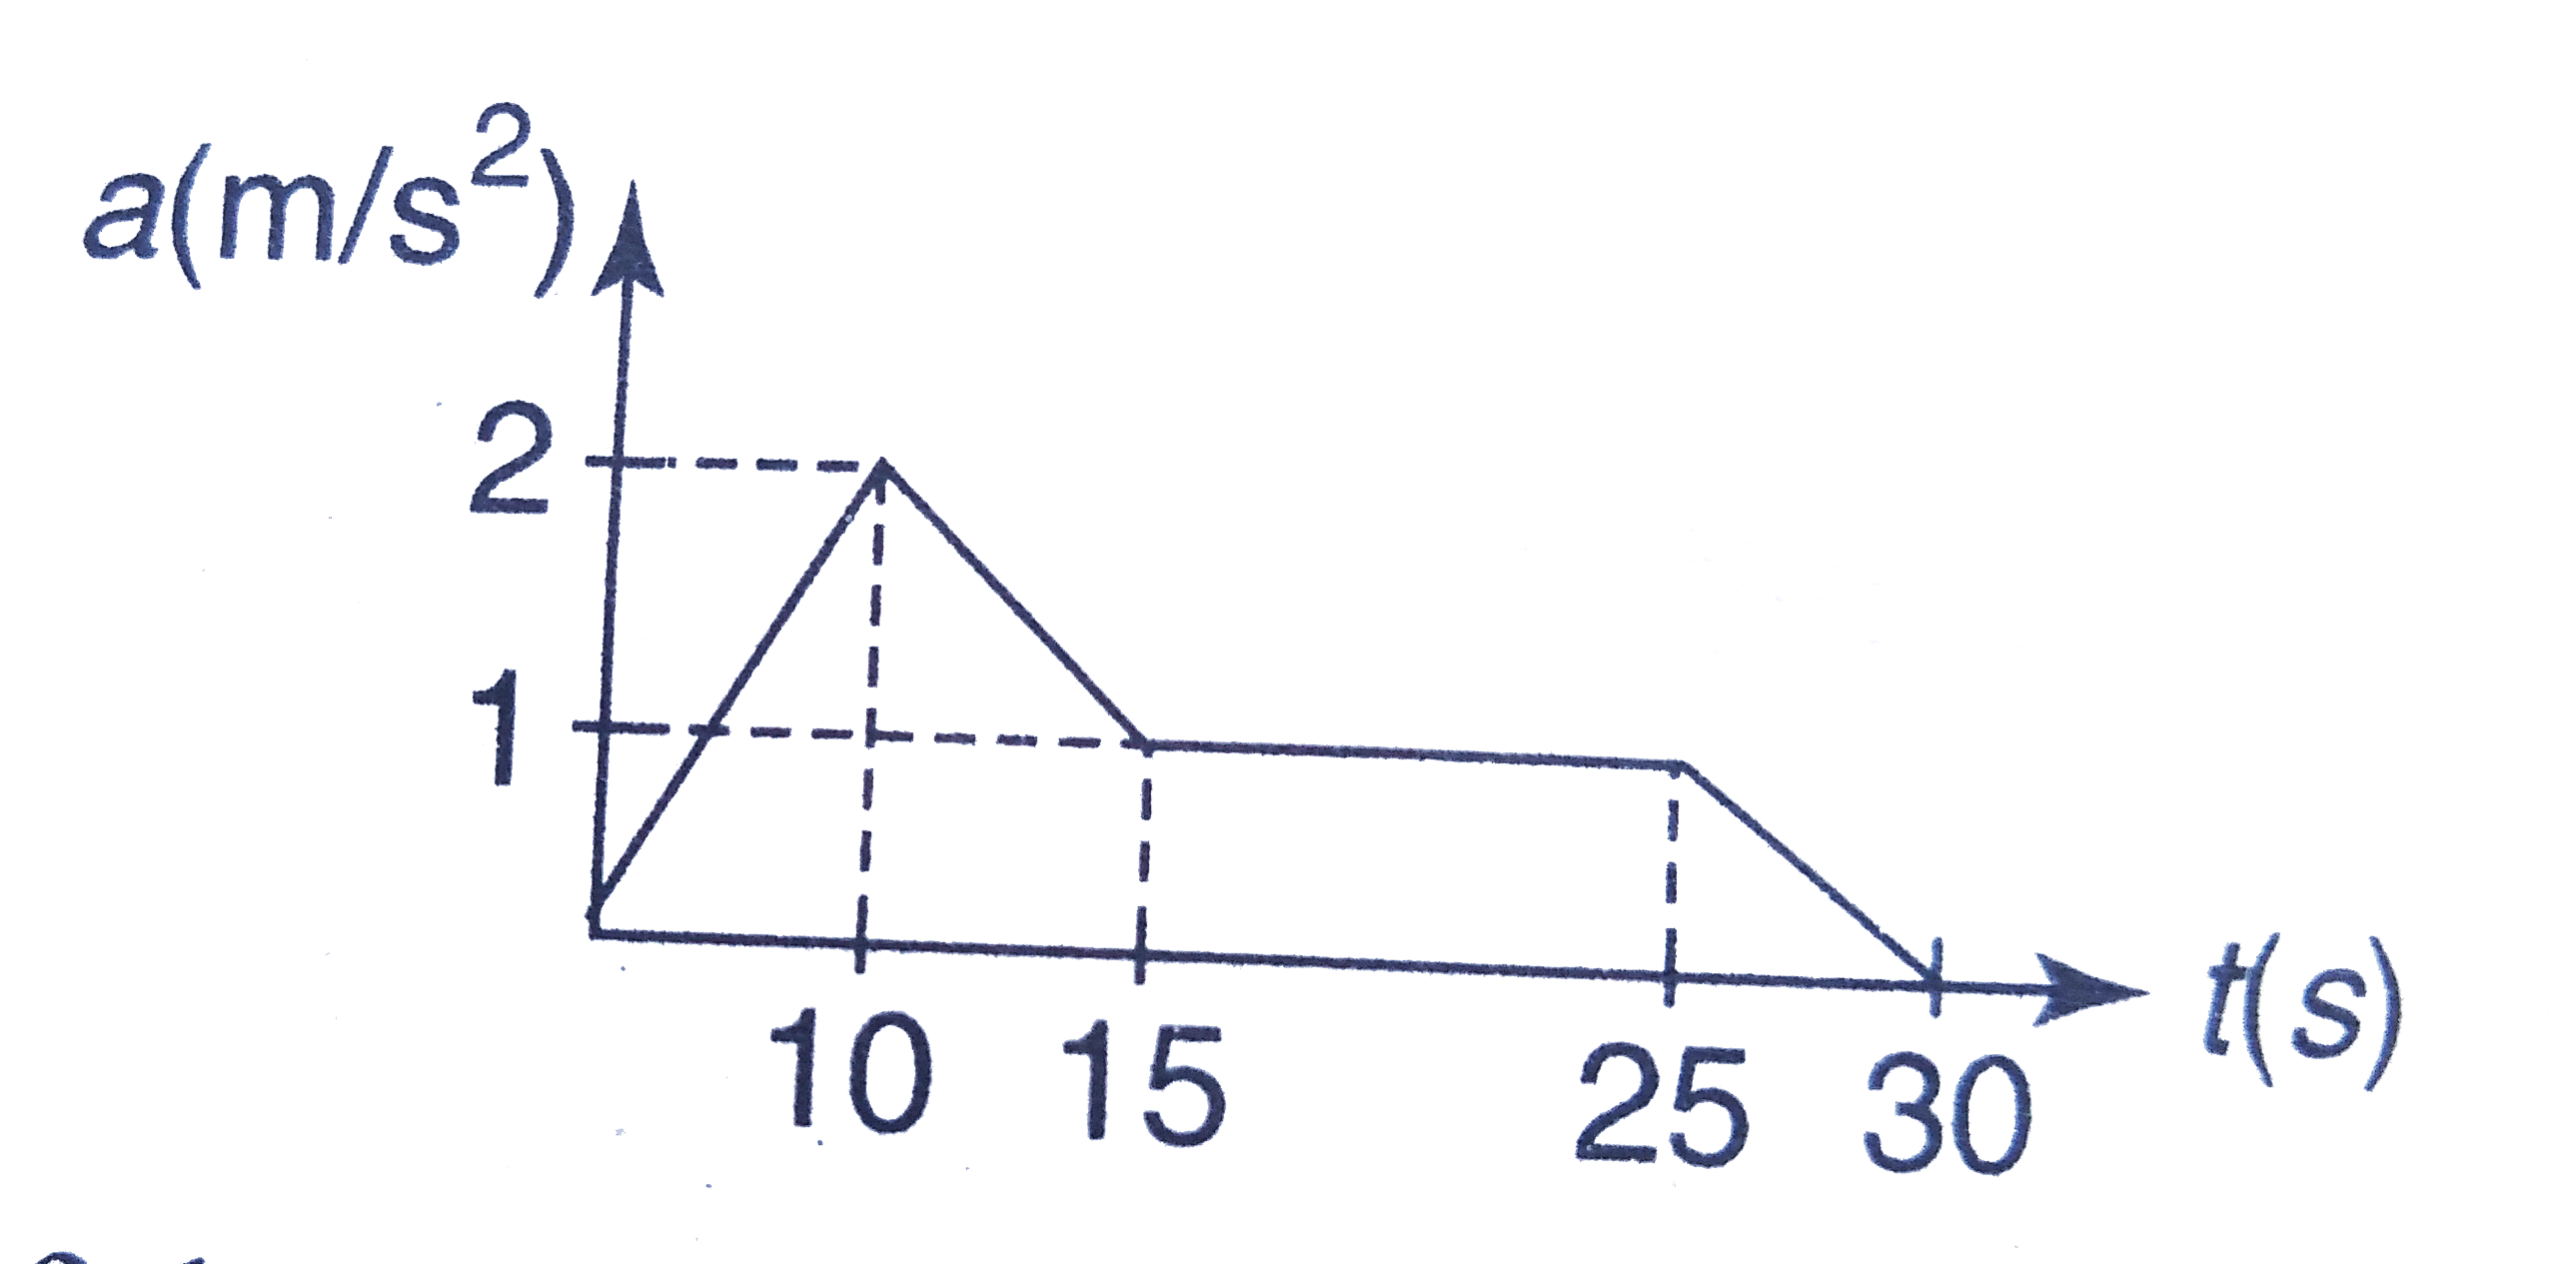 A30m/sB20m/sC40m/sDnone
 - Question 3 - Select One
The acceleration time graph of a body moving in a straight is shown in figure.
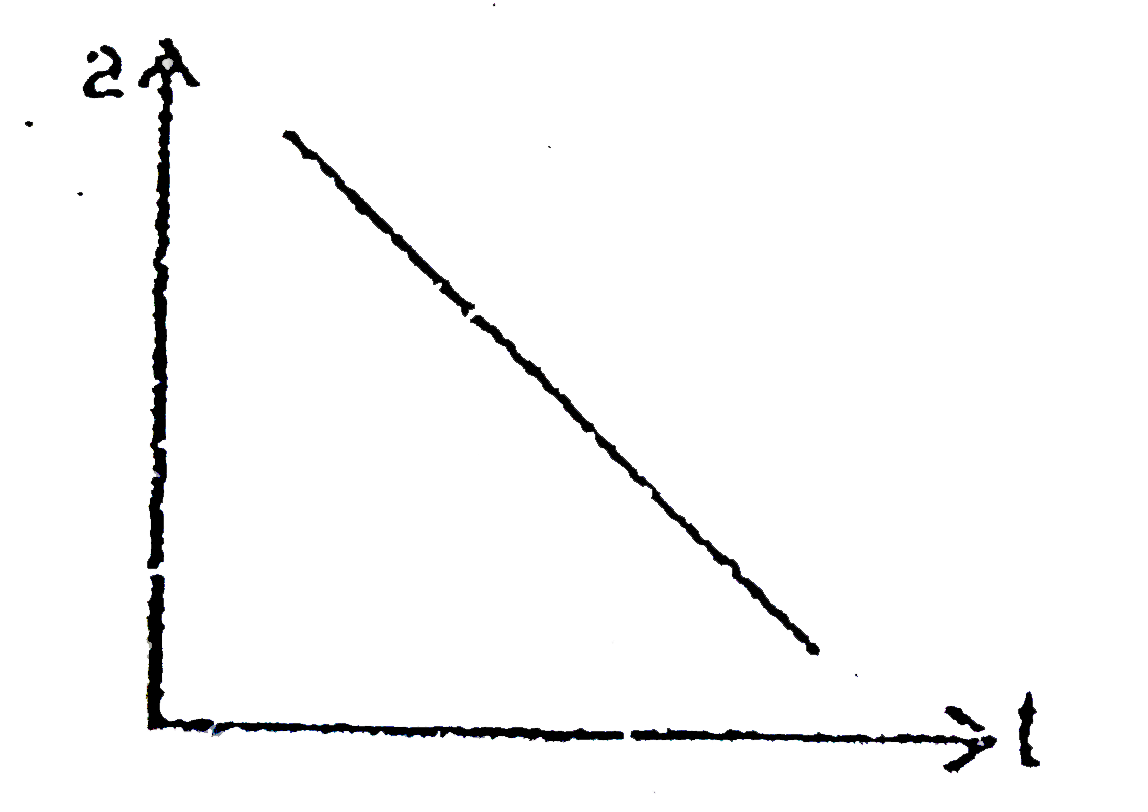
Assertion :− Velocity of the body is continously increasing over the time interval shown.
Reason :− Acceleration is positive for all shown value of t.AIf both Assertion & Reason are True & the Reason is a correct explanation of the Assertion.BIf both Assertion & Reason are True but Reason is not a correct explanation of the Assertiion.CIf Assertion is True but the Reason is False.DIf both Assertion & Reason are False
The only force acting on a 2.0−kg body as it moves along the x-axis varies as shown in figure. The velocity of the body at x=0 is 4.0ms−1.
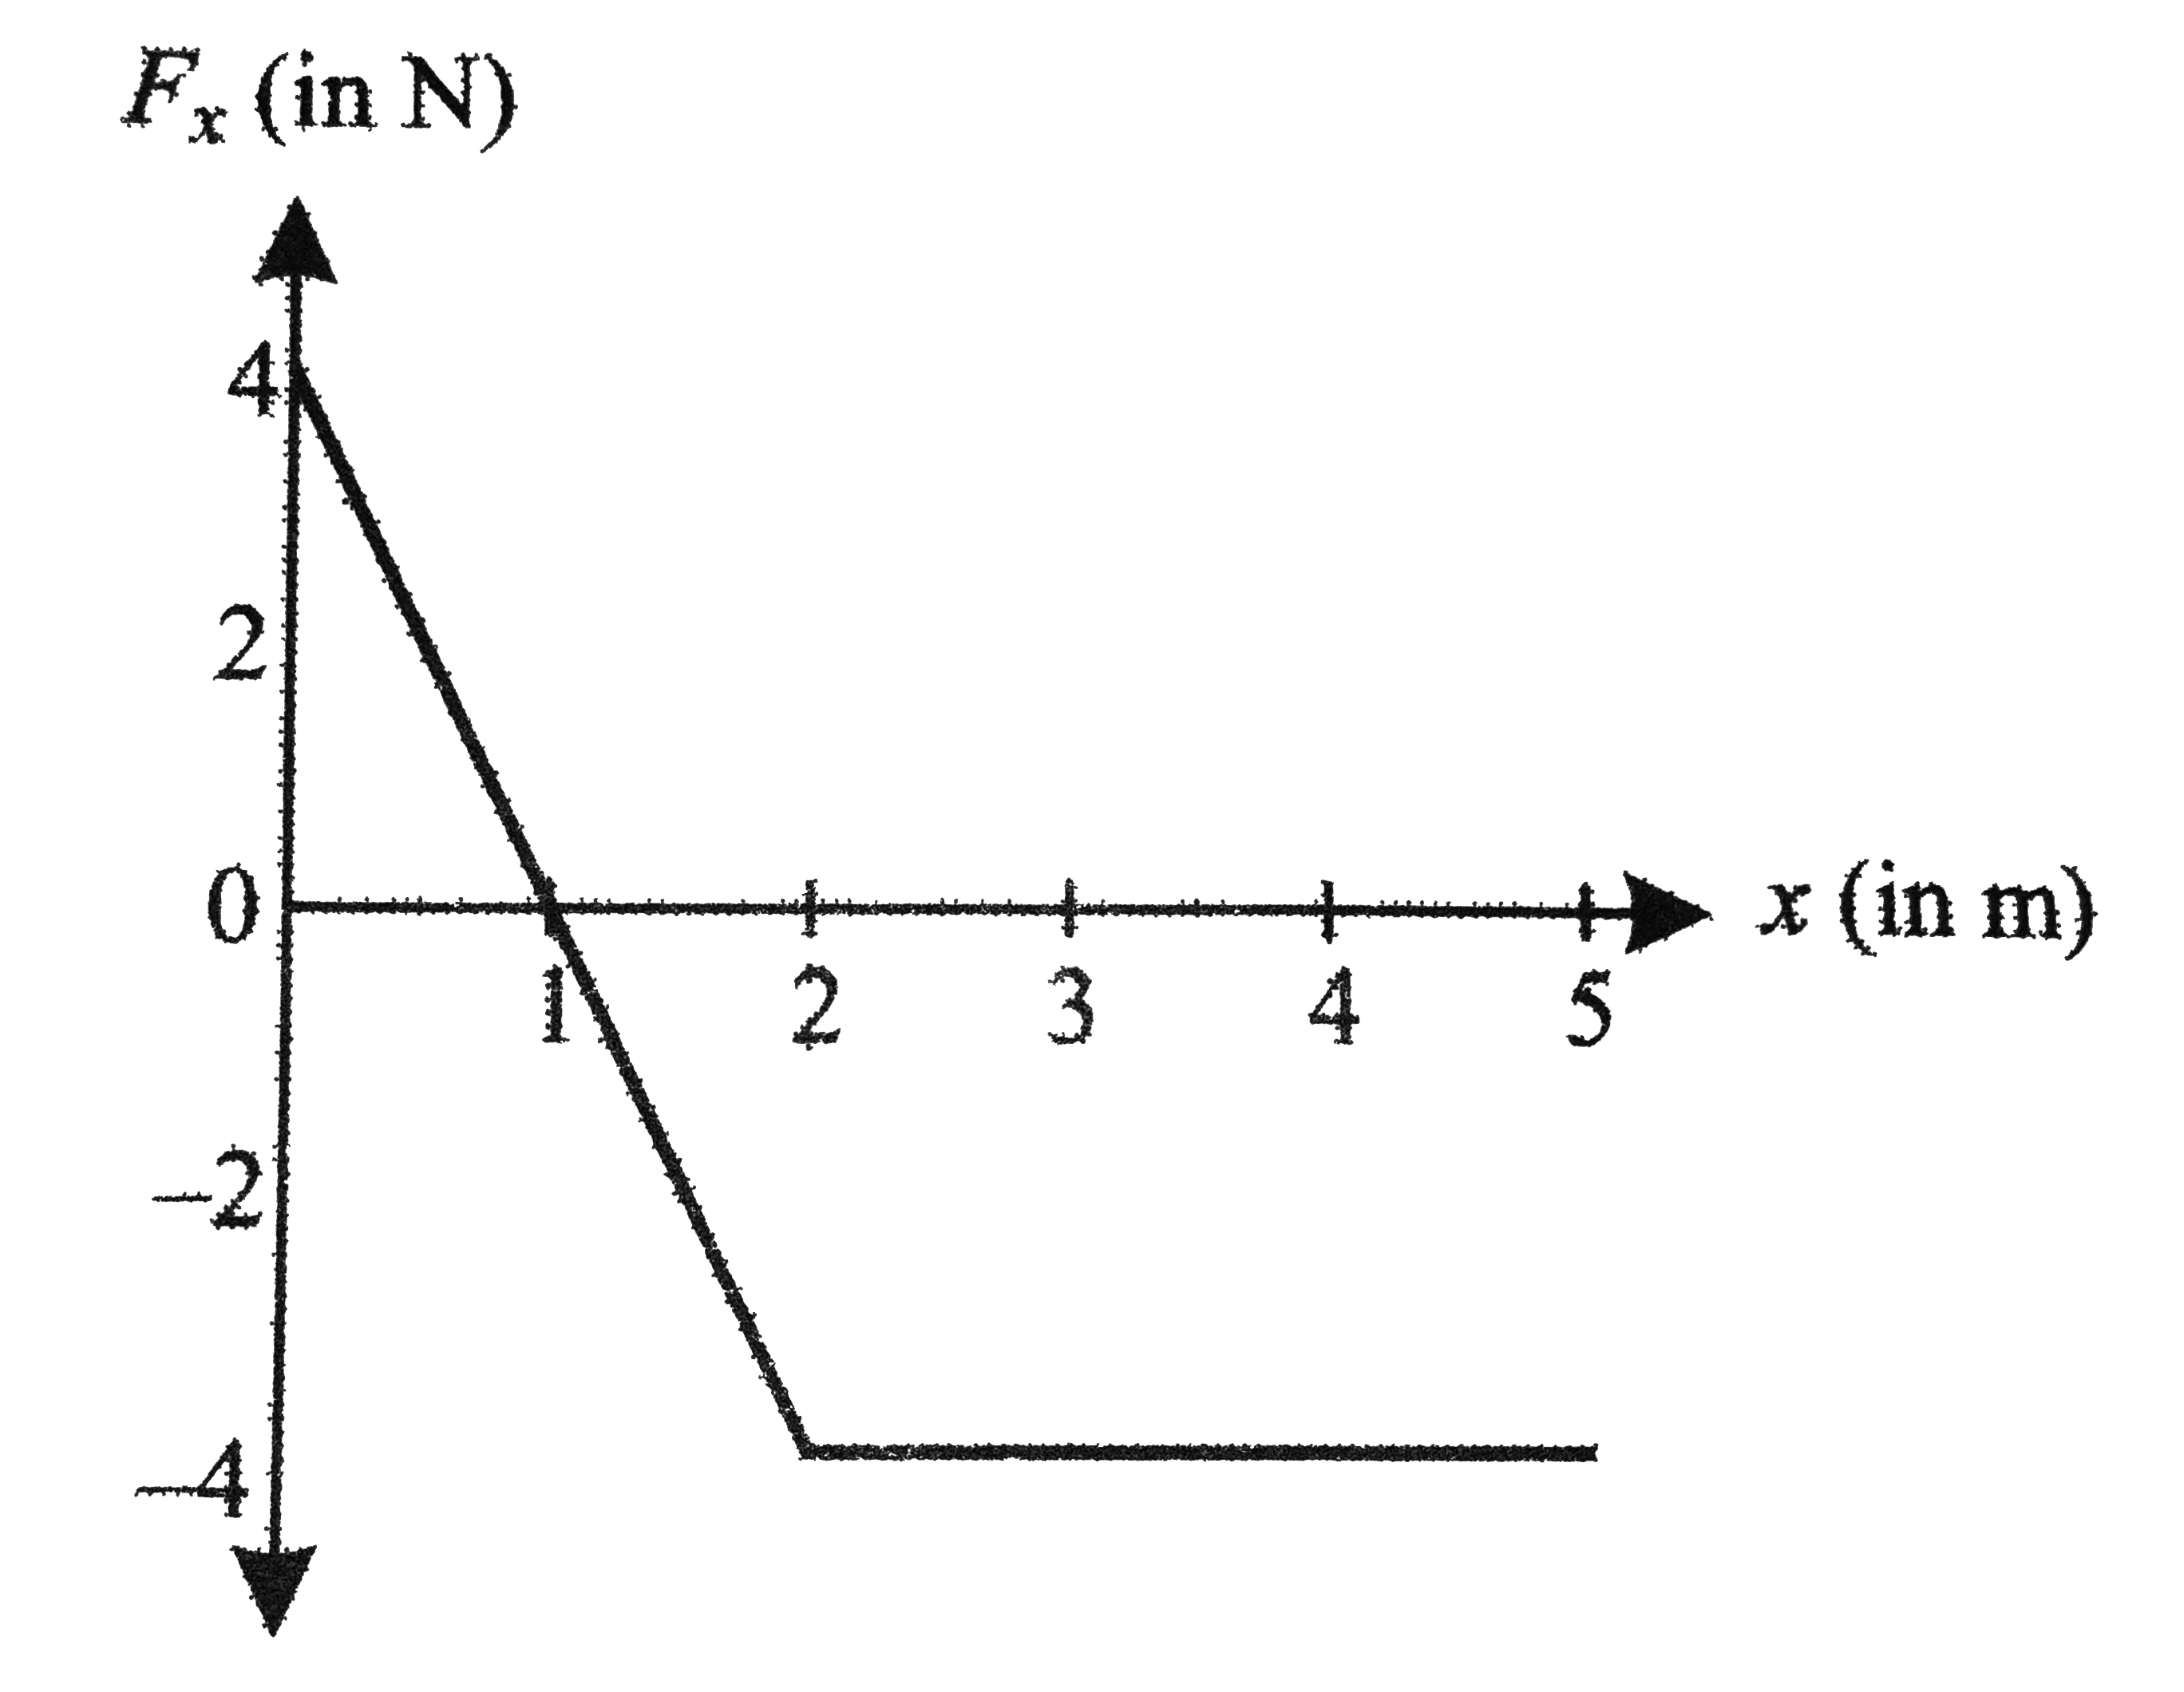
a. What is the kinetic energy of the body at x=3.0m?
b. At what value of x will the body have a kinetic energy of 8.0J?
c. What is the maximum kinetic energy attained by the body between x=0 and x=5.0m?View SolutionFor the acceleration - time (a - t) graph shown in figure, the change in velocity of particle from t = 0 to t = 6 s is
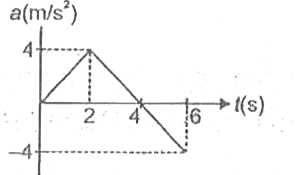 View Solution
The displacement of a body along the x-axis depends on time as √x=t+2, then the velocity of body
View SolutionThe acceleration-time graph of a particle moving in a straight line is as shown in figure. The velocity of the particle at time t=0 is 2m/s. The velocity after 2 seconds will be
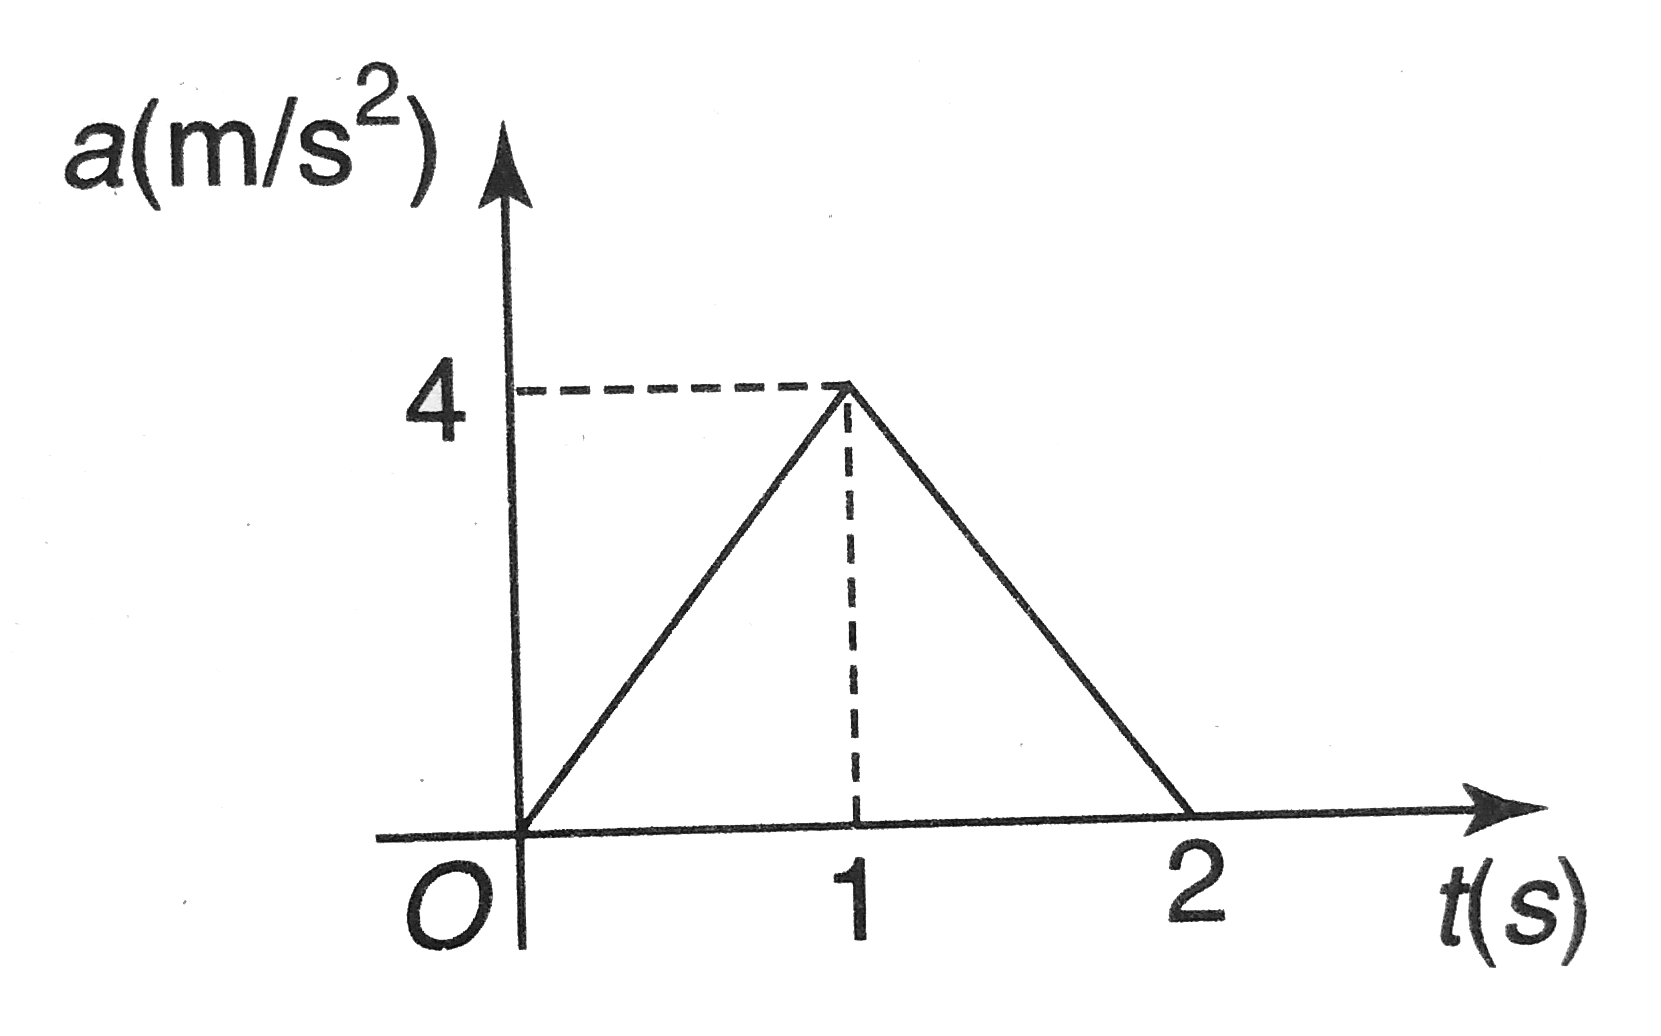 View Solution
The displacement of a body along X-axis depends on time as √x=t+1. Then the velocity of body.
View Solution

