The acceleration time graph of a body moving in a straight is shown in figure.
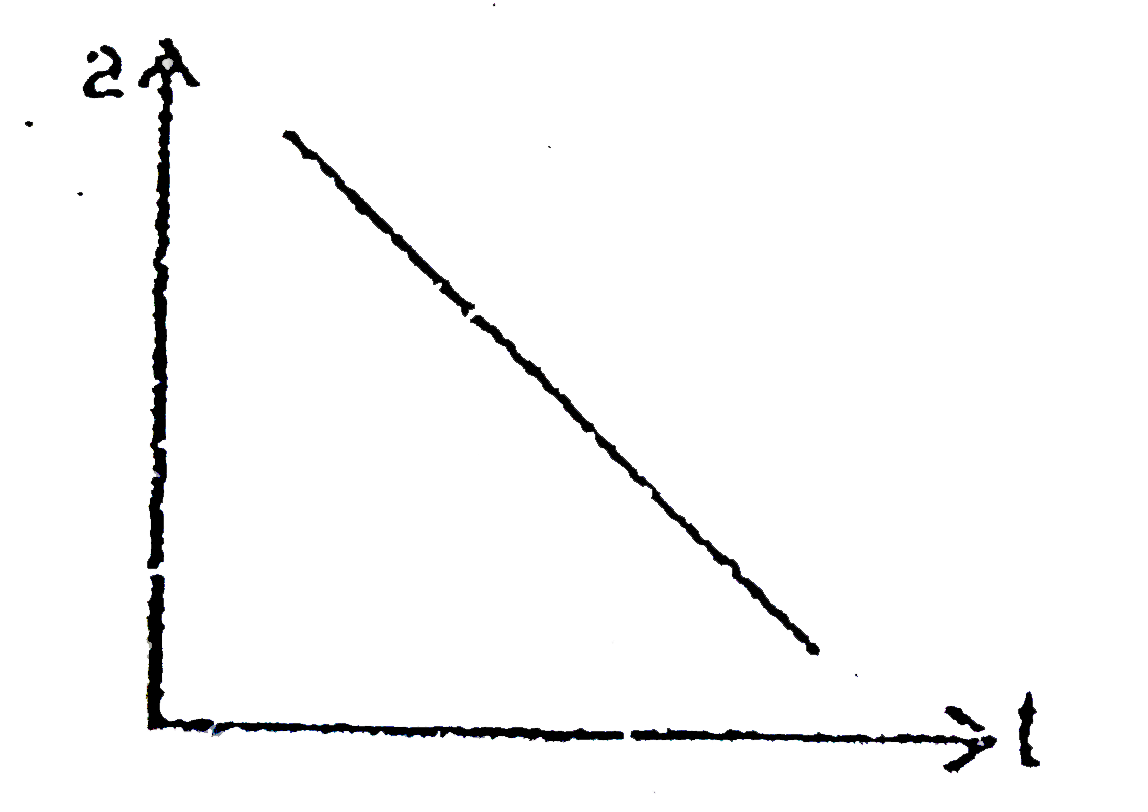
Assertion :− Velocity of the body is continously increasing over the time interval shown.
Reason :− Acceleration is positive for all shown value of t.
If both Assertion & Reason are True & the Reason is a correct explanation of the Assertion.
If both Assertion & Reason are True but Reason is not a correct explanation of the Assertiion.
If Assertion is True but the Reason is False.
If both Assertion & Reason are False
The correct Answer is:A
N/A
Topper's Solved these Questions
- TEST PAPERBOOK - ALLENCHAPTER - TEST PAPEREXERCISE - Exercise (Physics)
330 Videos
- TEST PAPERBOOK - ALLENCHAPTER - TEST PAPEREXERCISE - PHYSICS
4 Videos
- SIMPLE HARMONIC MOTIONBOOK - ALLENCHAPTER - SIMPLE HARMONIC MOTIONEXERCISE - Example
1 Videos
- TEST PAPER 1BOOK - ALLENCHAPTER - TEST PAPER 1EXERCISE - PHYSICS
11 Videos
Similar Questions
Knowledge Check
The velocity-time graph of a body moving in a straight line is shown in the figure.
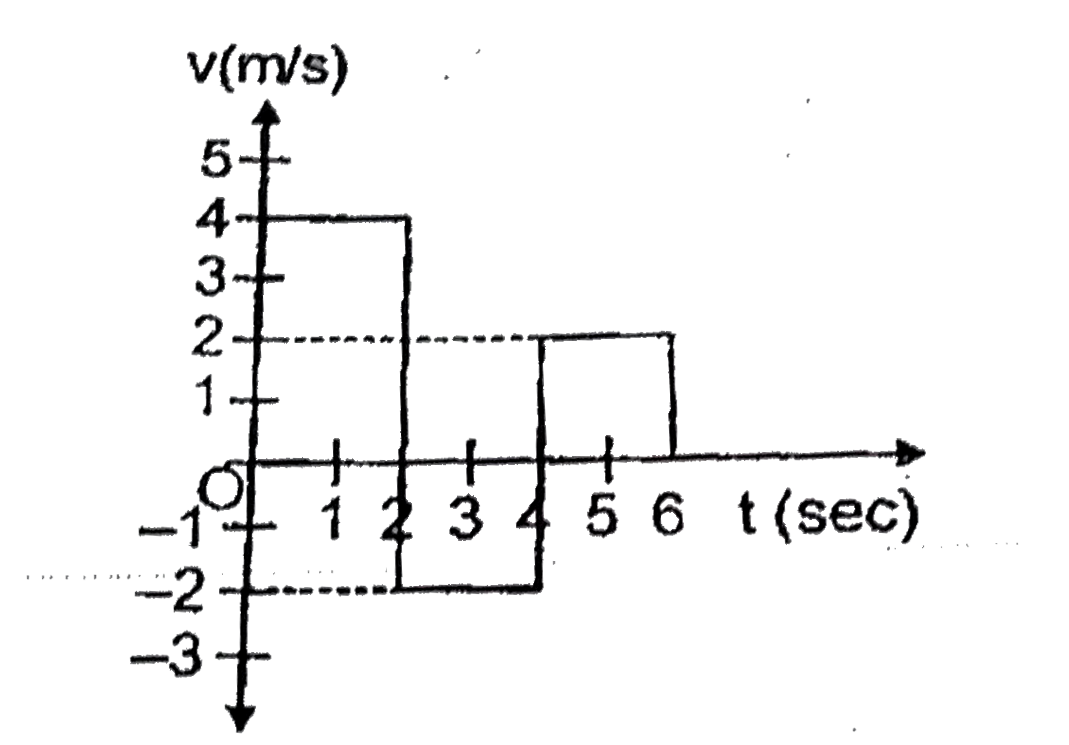 AThe magnitude of displacement of the body in 1st 2 sec is 8 mBThe magnitude of displacement of the body in 1st 4 sec is 4 mCThe distance travelled in 1st 2 sec is 8 mDThe distance travelled in 1st 4 sec is 12 m
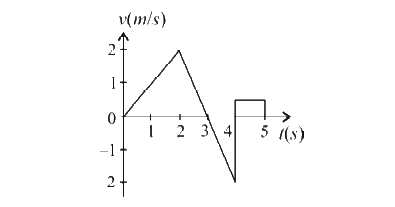
The velocity versus time graph of a body moving in a straight line is as shown in the figure below
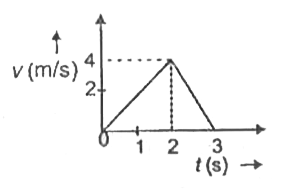 AThe distance covered by the body in 0 to 2s is 8mBThe acceleration of the body in 0 to 2s is 4ms−2CThe accelerationof the body in 2 to 3s is 4ms−2DThe distance moved by the body during 0 to 3 is 6 m
The speed - time graph for a body moving along a straight line is shown in figure. The average acceleration of body may be
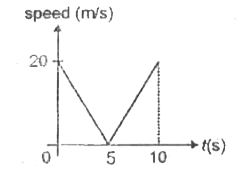 A0B4m/s2C−4m/s2DAll of these
The distance -time graph of a body moving in a straight line is shown below. Draw the speed time graph of the motion of the body.
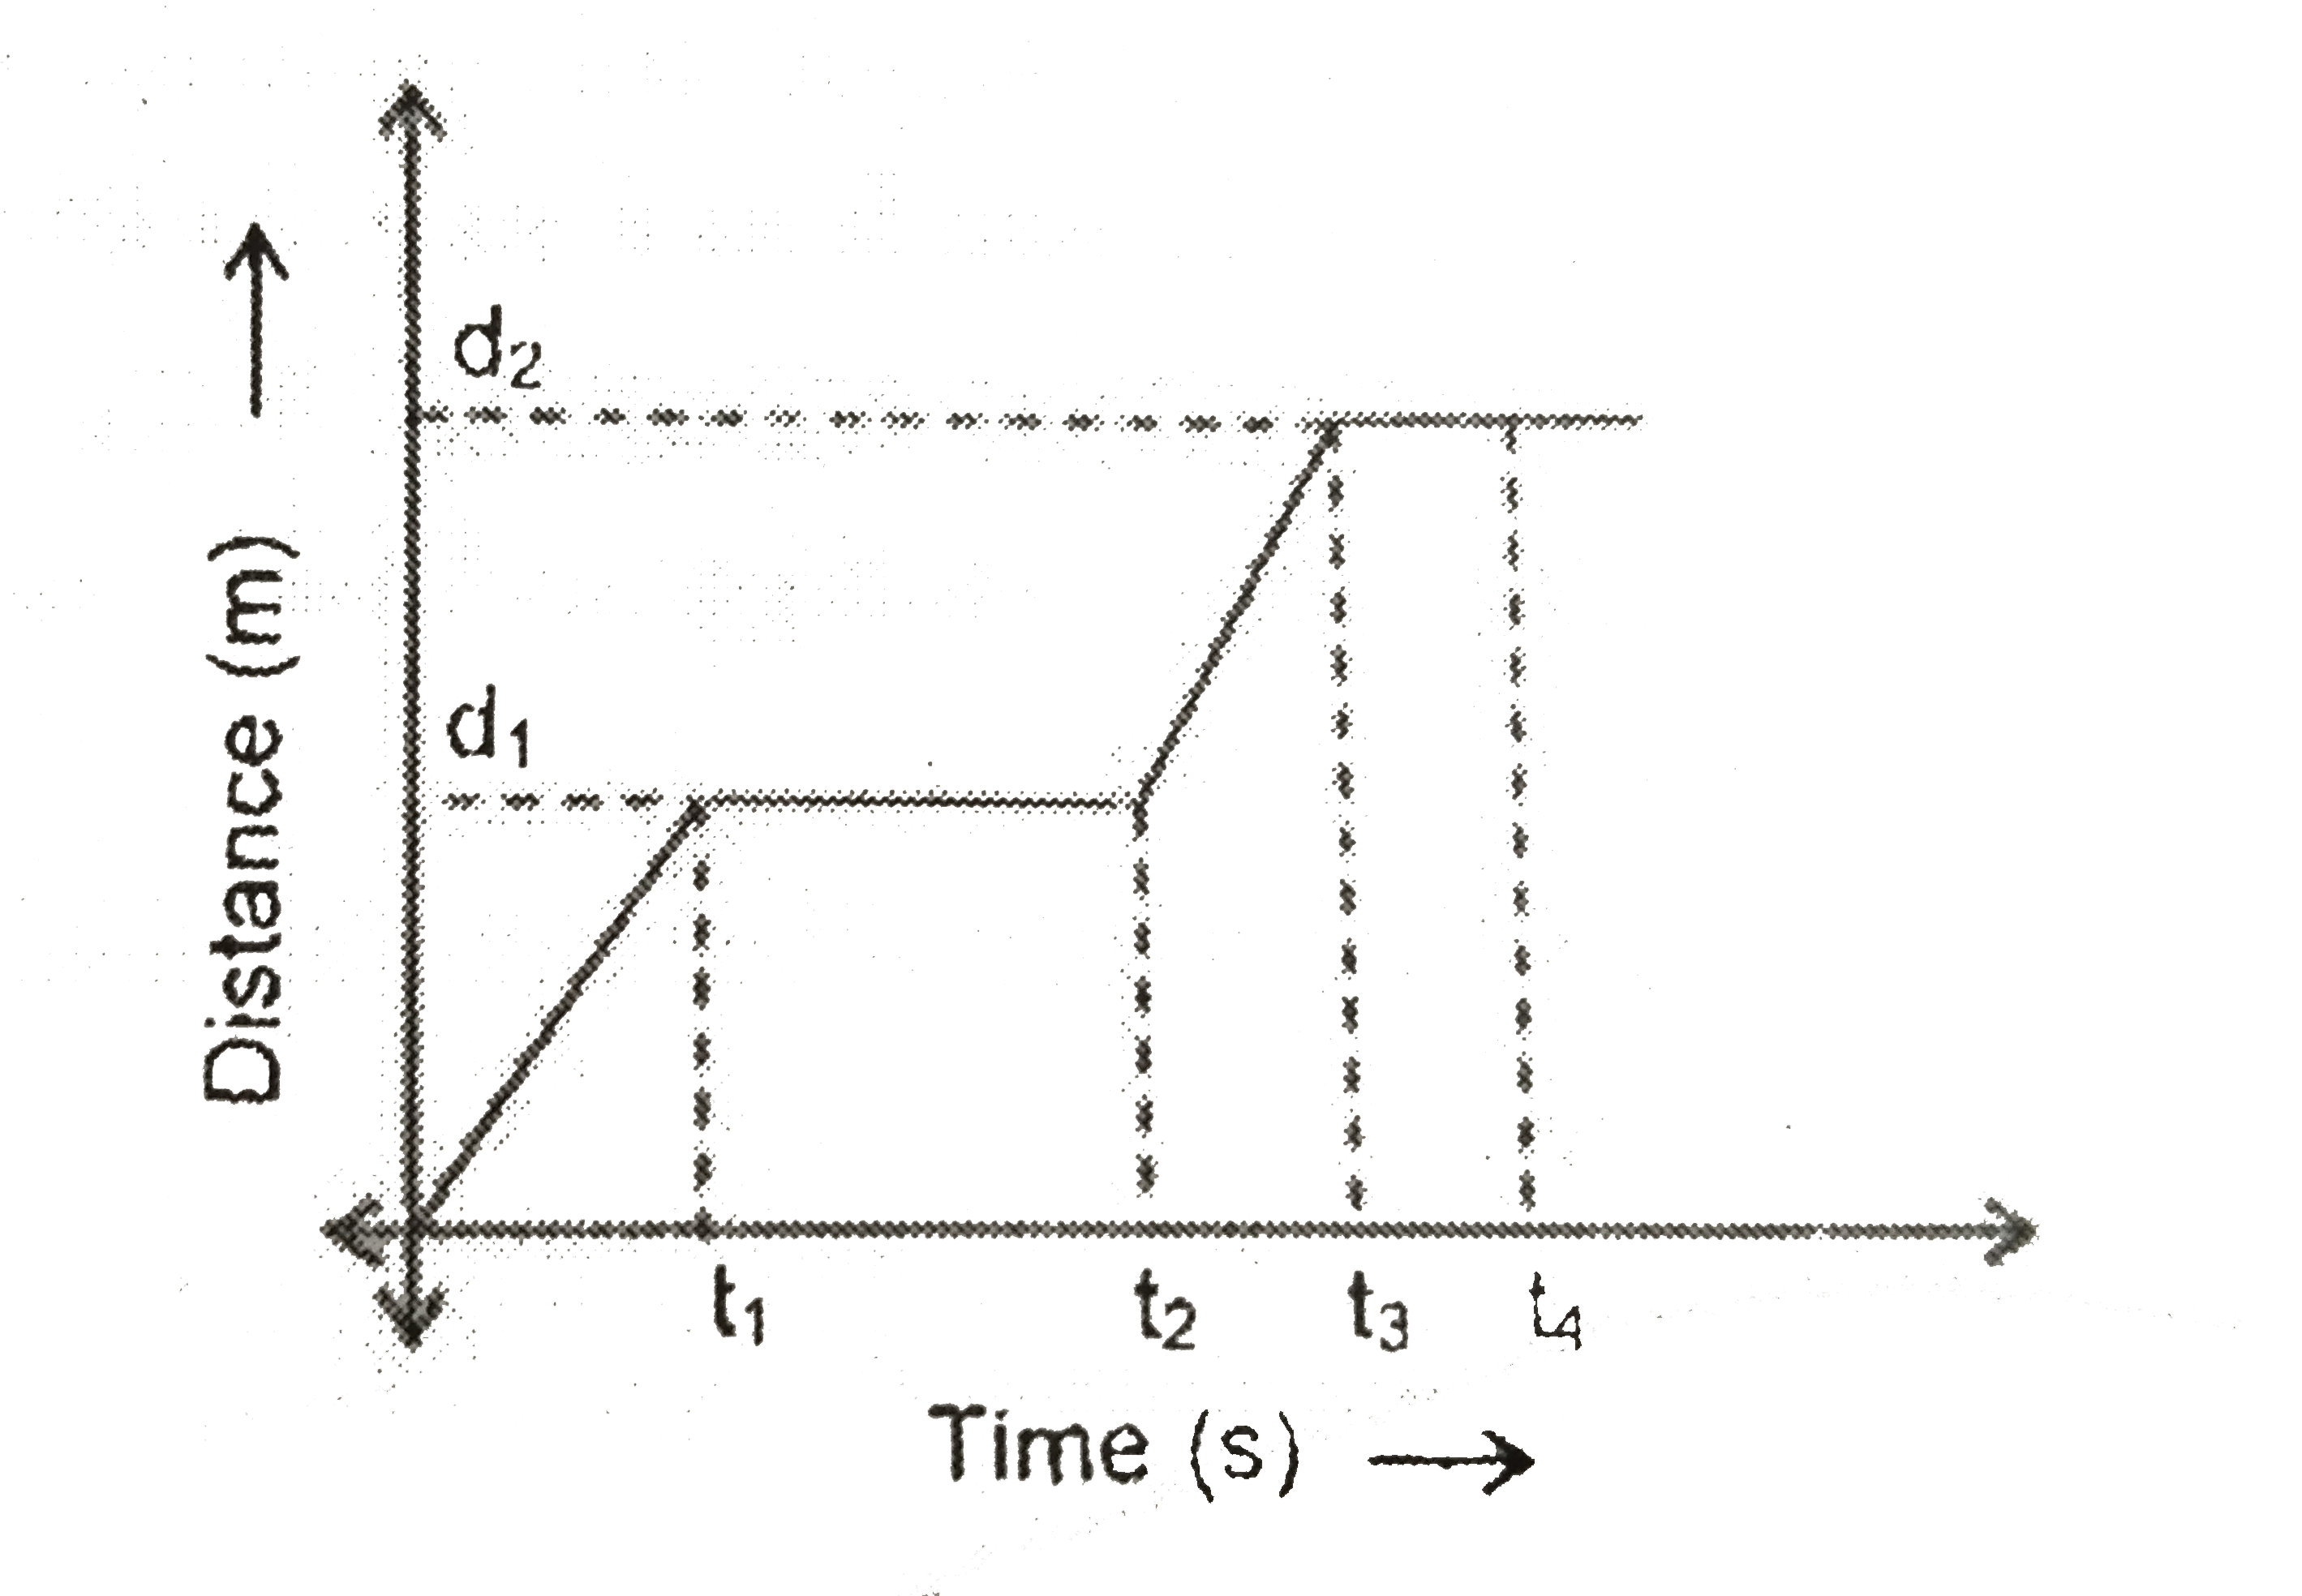
View SolutionThe distance -time graph of a body moving in a straight line is shown below. Draw the speed time graph of the motion of the body.

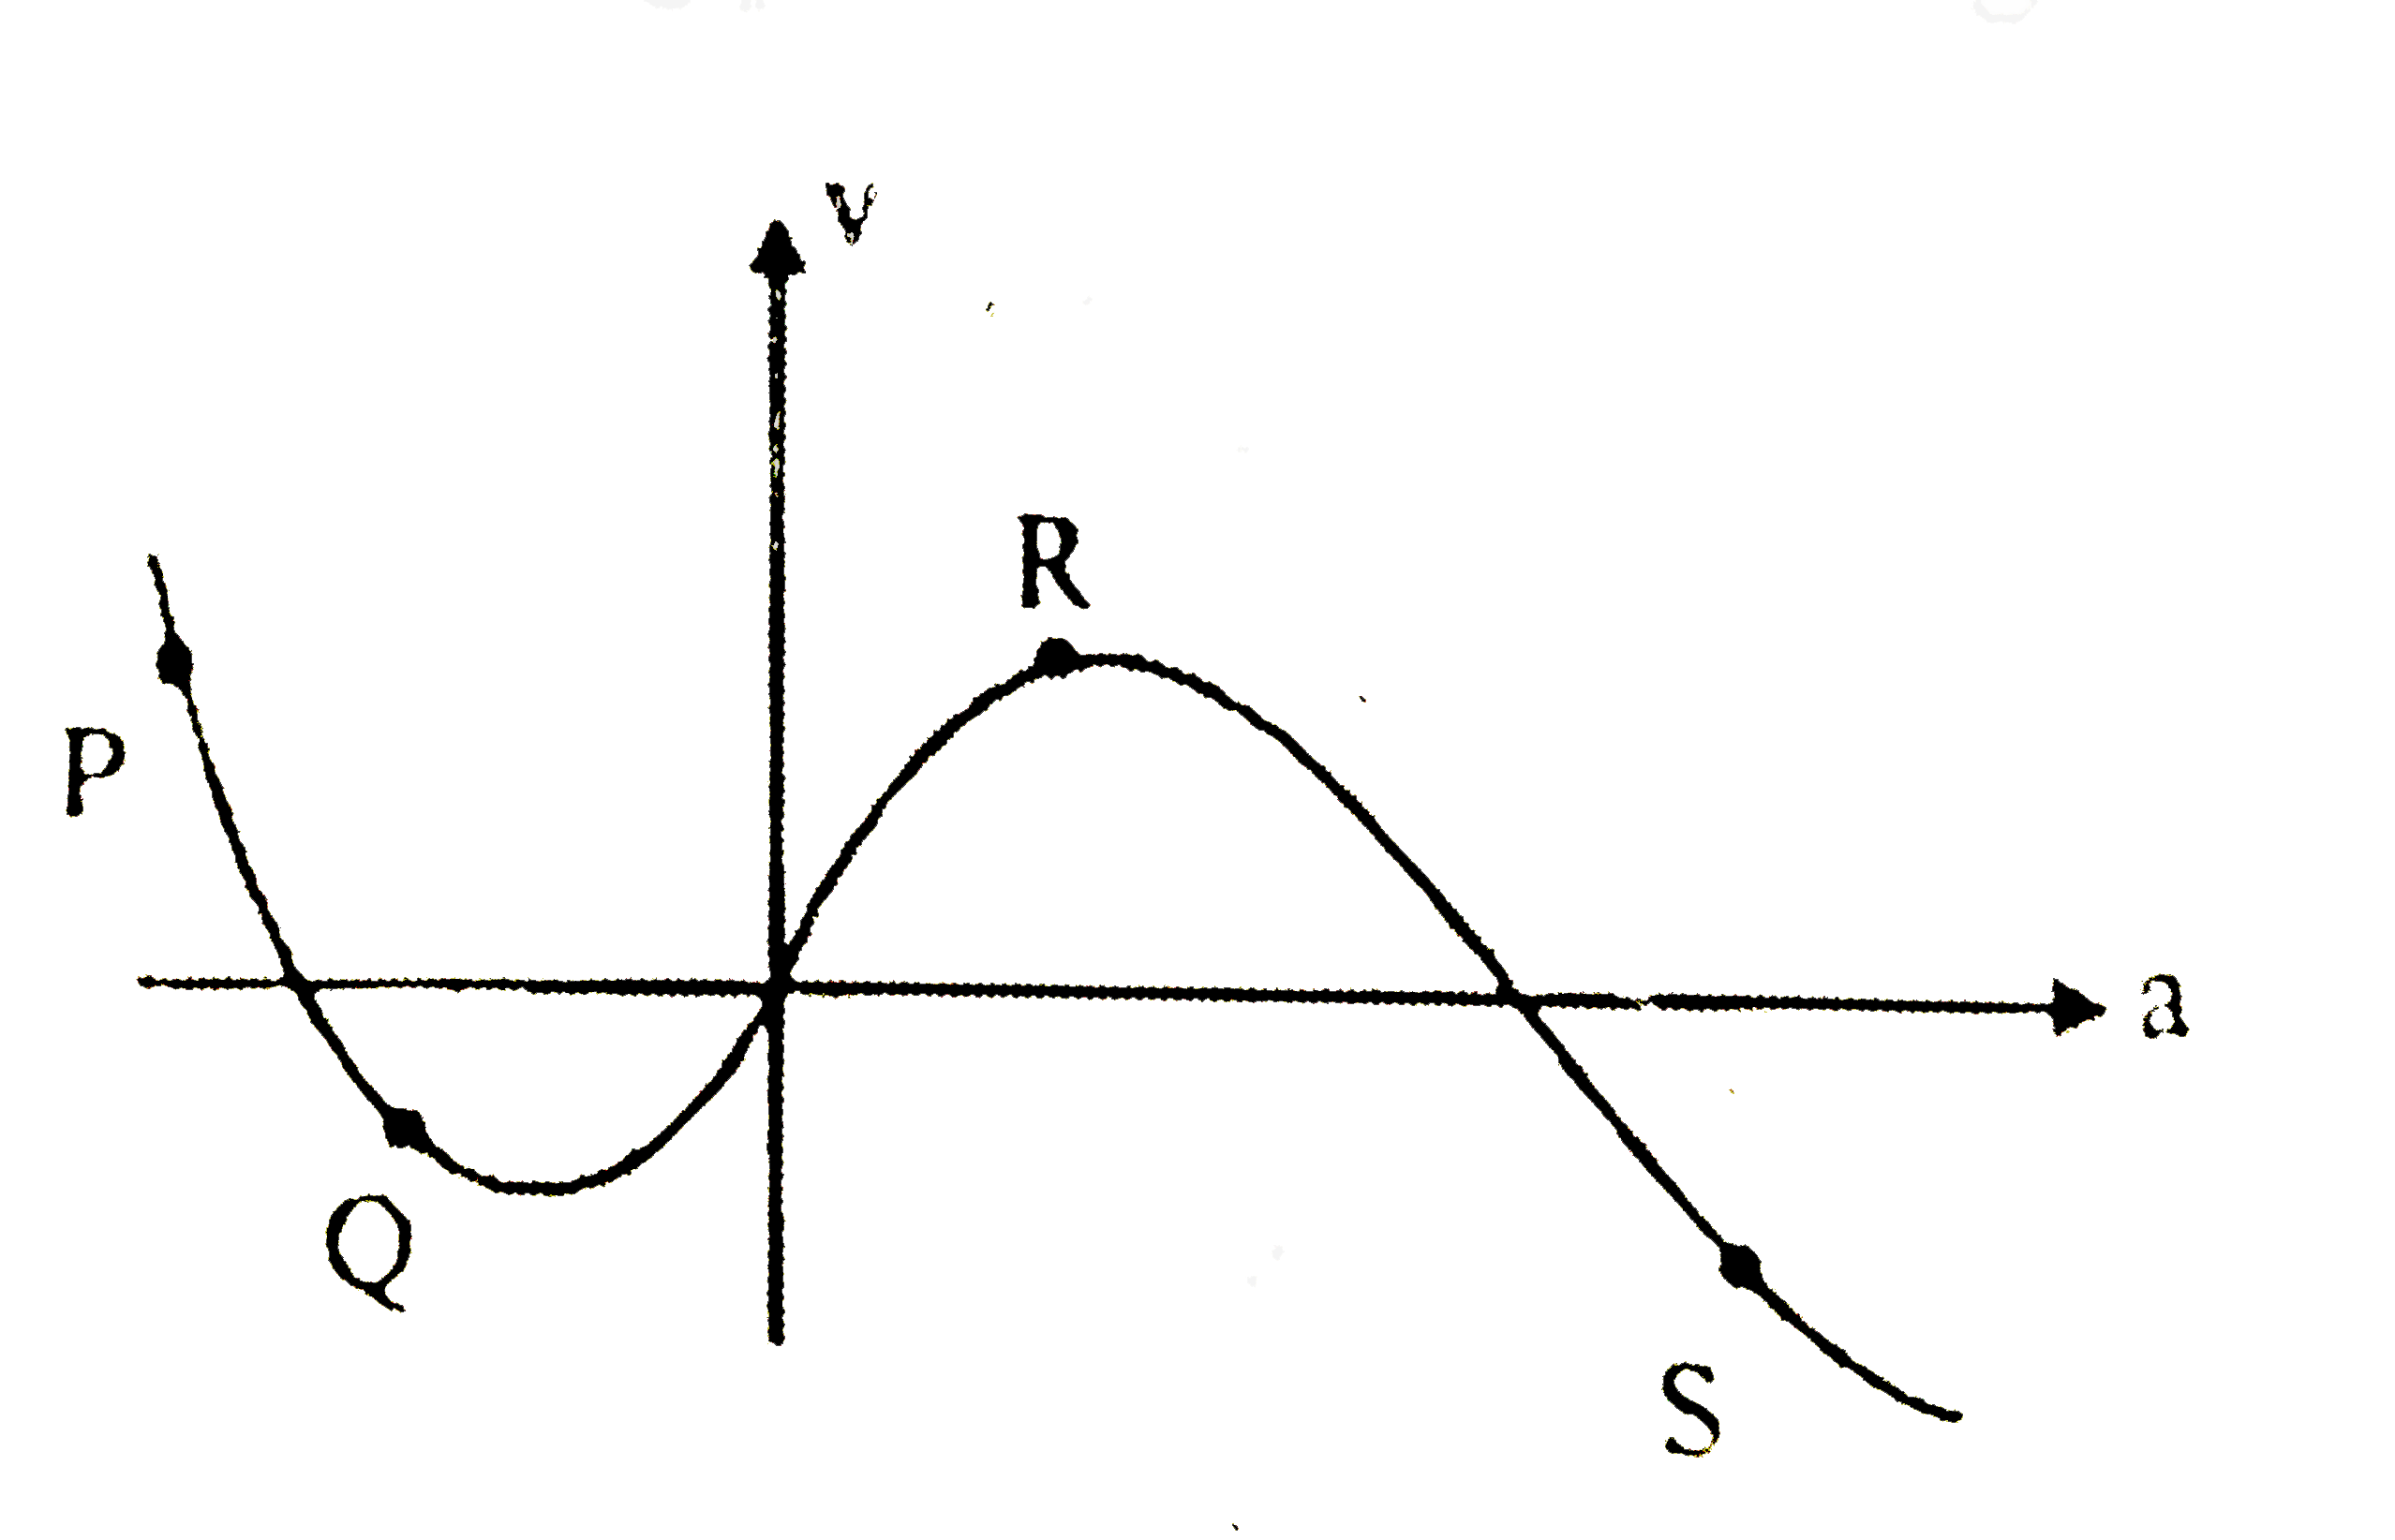
View SolutionThe acceleration - velocity graph of a particle moving in a straight line is shown in figure. Then the slope of the velocity- displacement graph
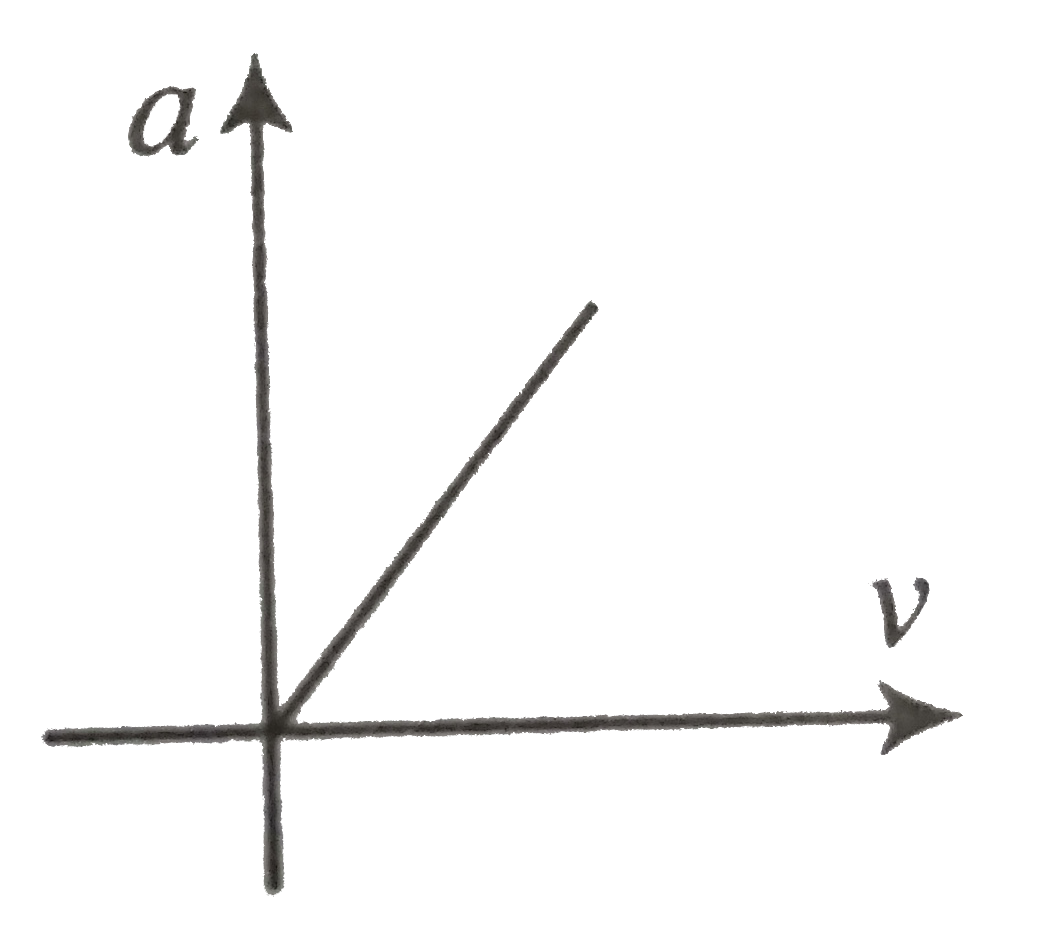
View SolutionThe velocity time graph of a body moving along a straight line is shown in figure. The ratio of the average velocities during the time t1 and t2 is.
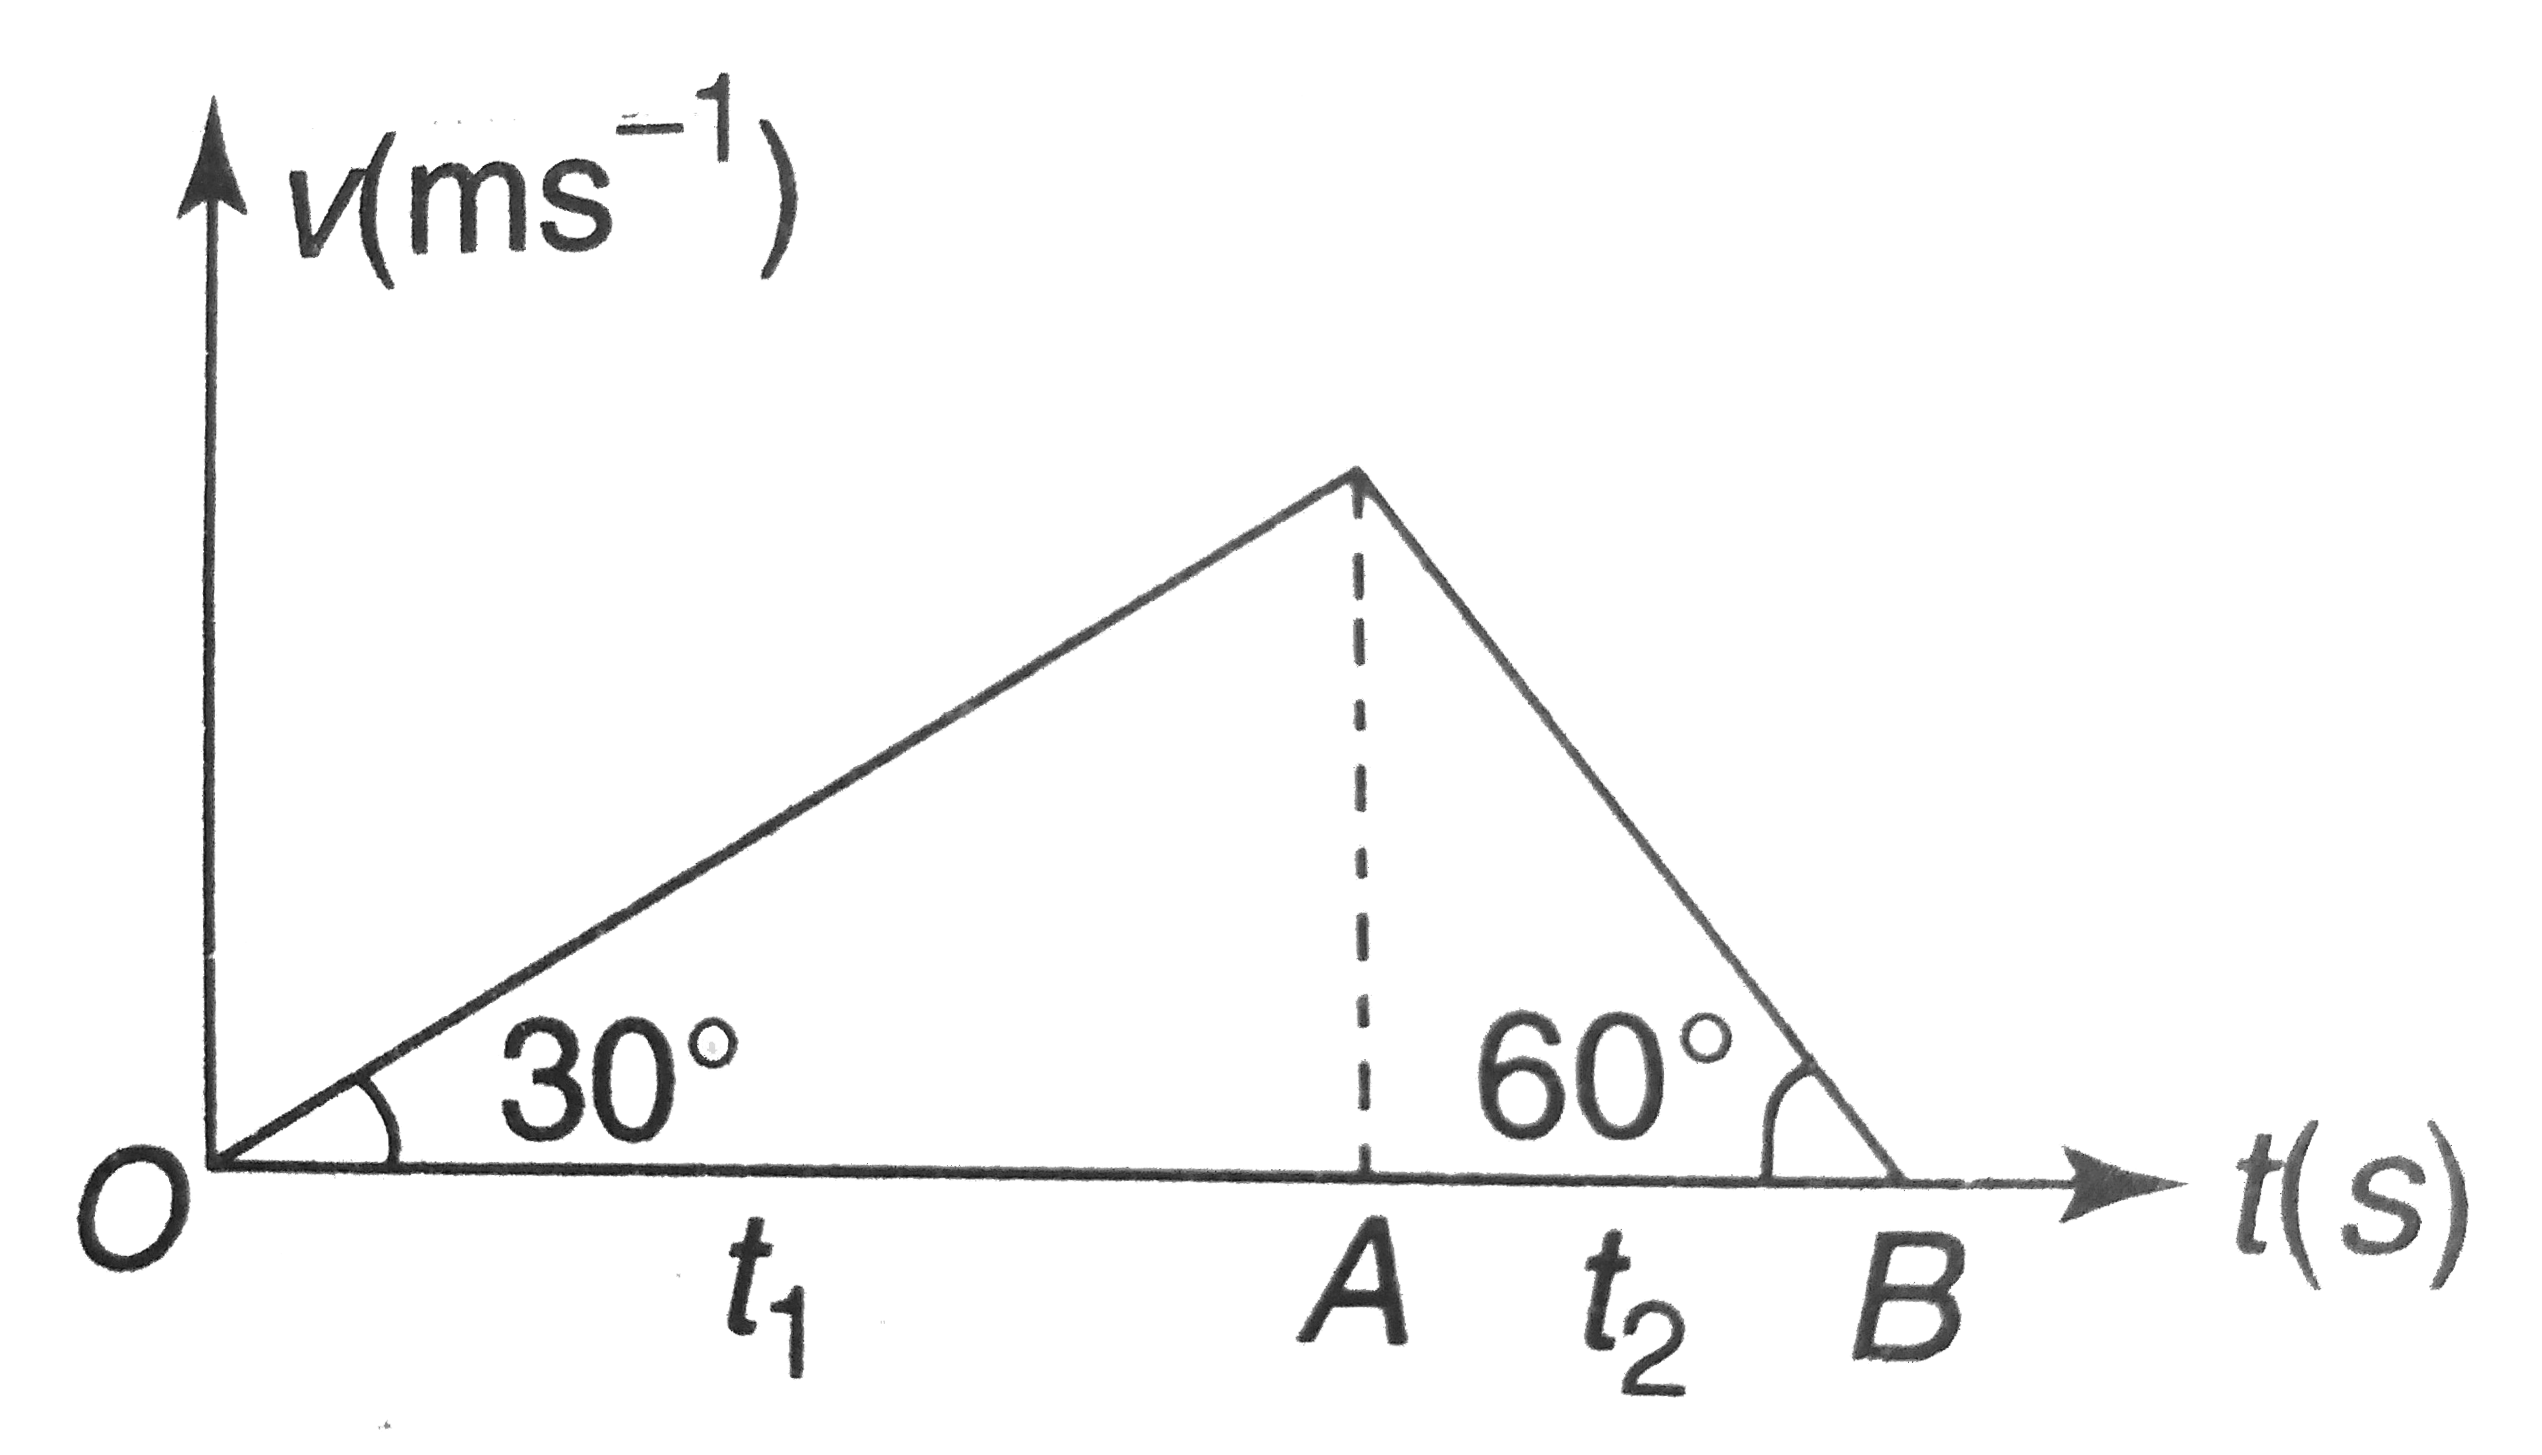
View SolutionThe acceleration-time graph of a particle moving along a straight line is as shown in figure. At what time the particle acquires its initial velocity ?

View Solution

