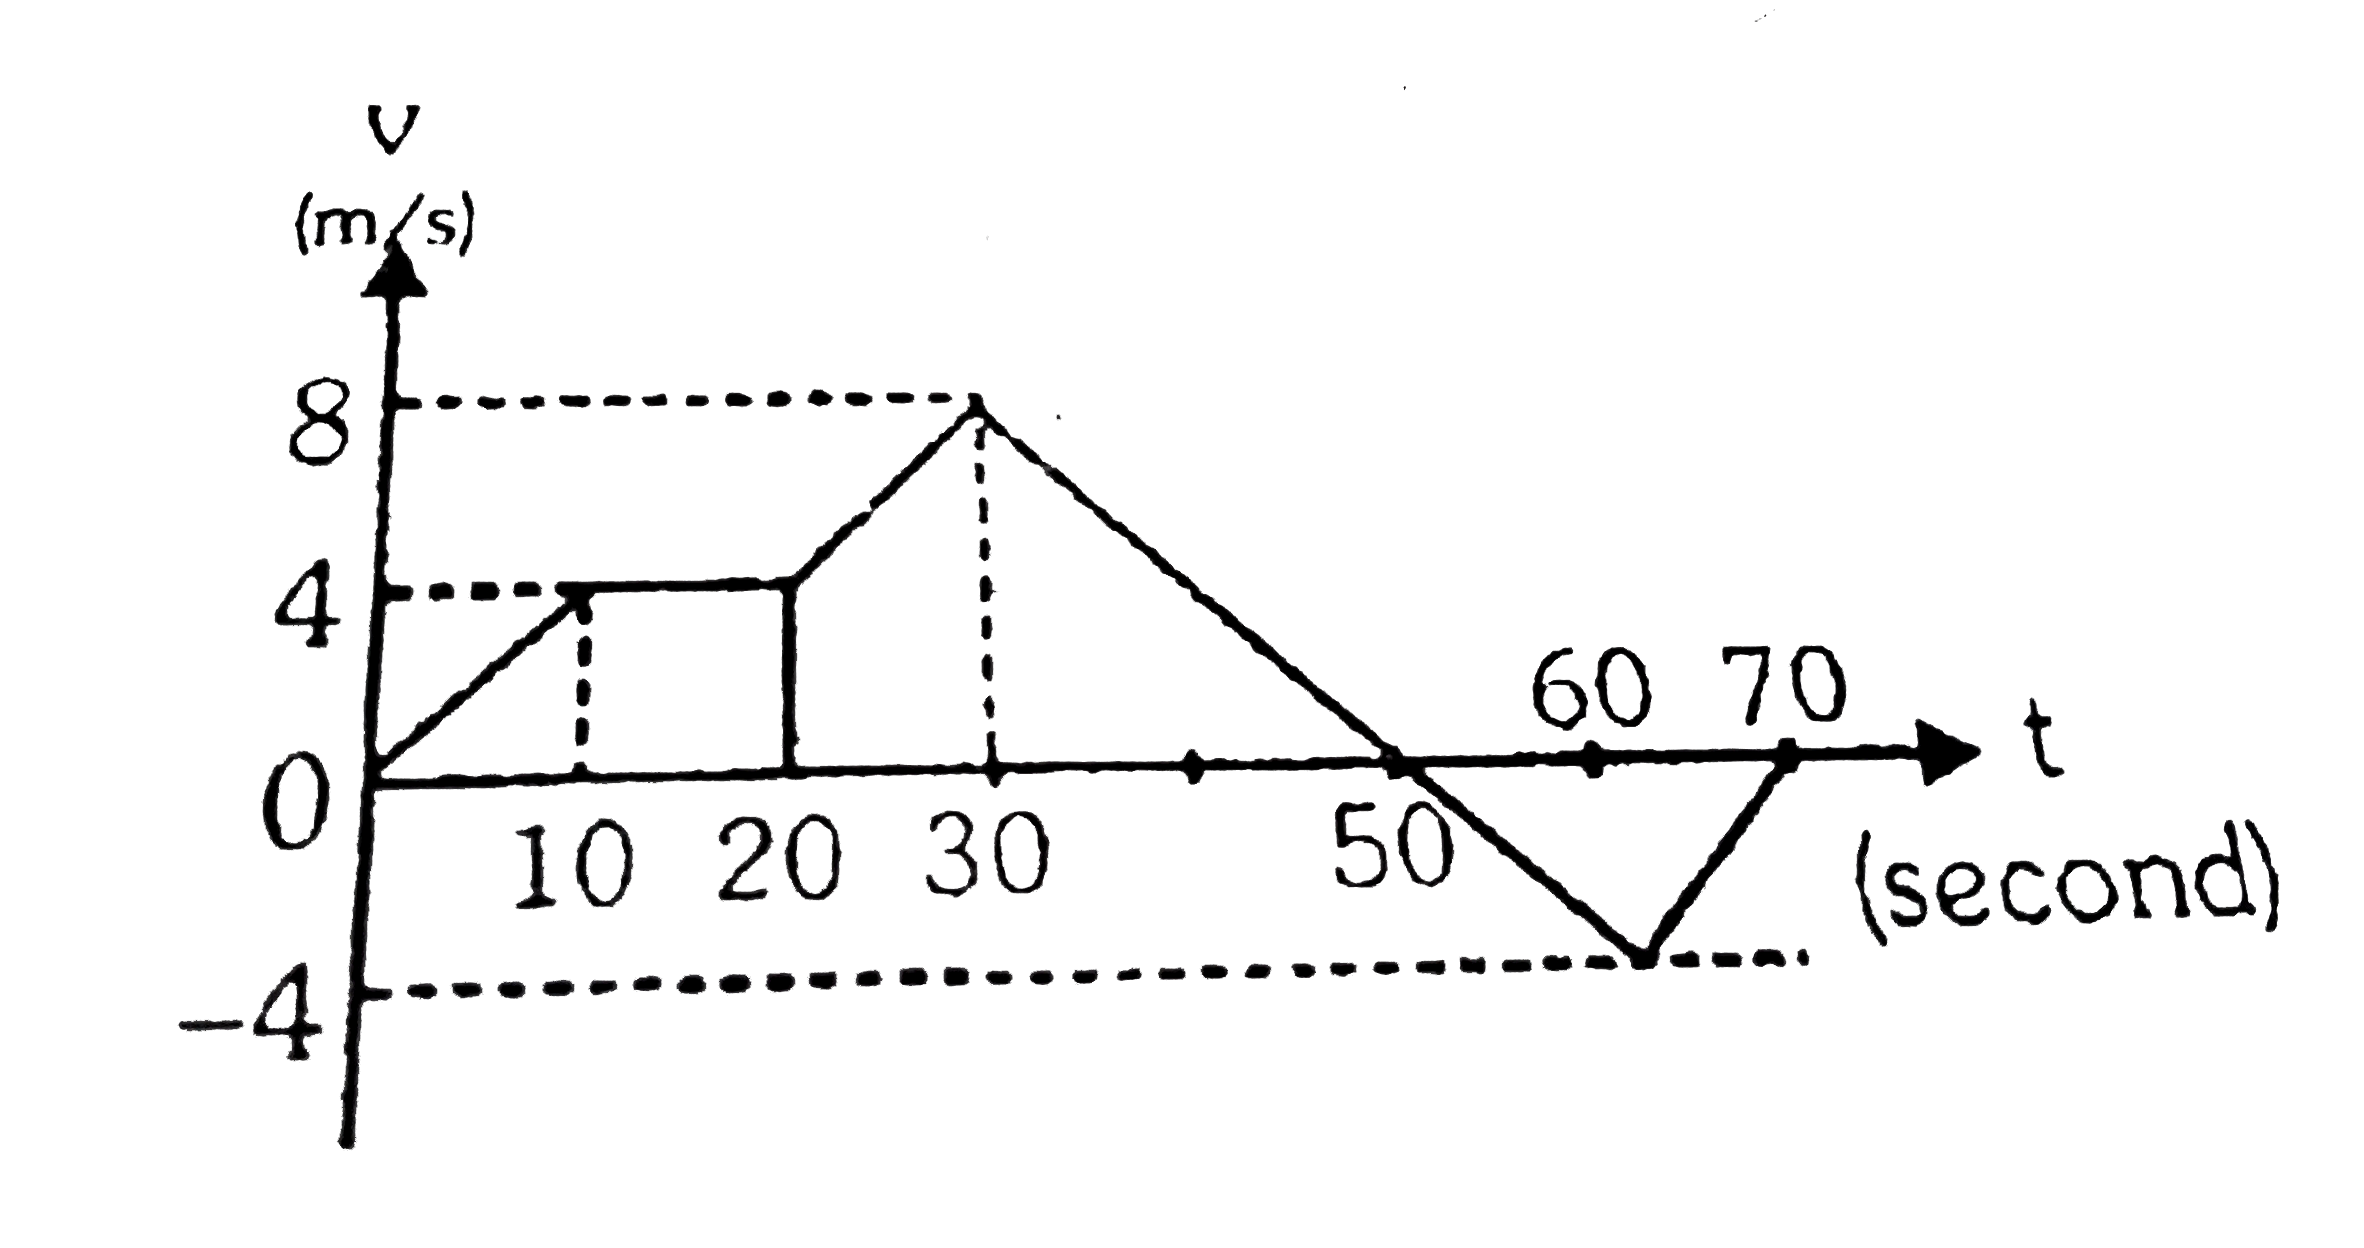
A car is moving on a straight road. The velocity of the car varies with time as shown in the figure. Initially (at t=0), the car was at x=0, where, x is the position of the car at any time 't'.
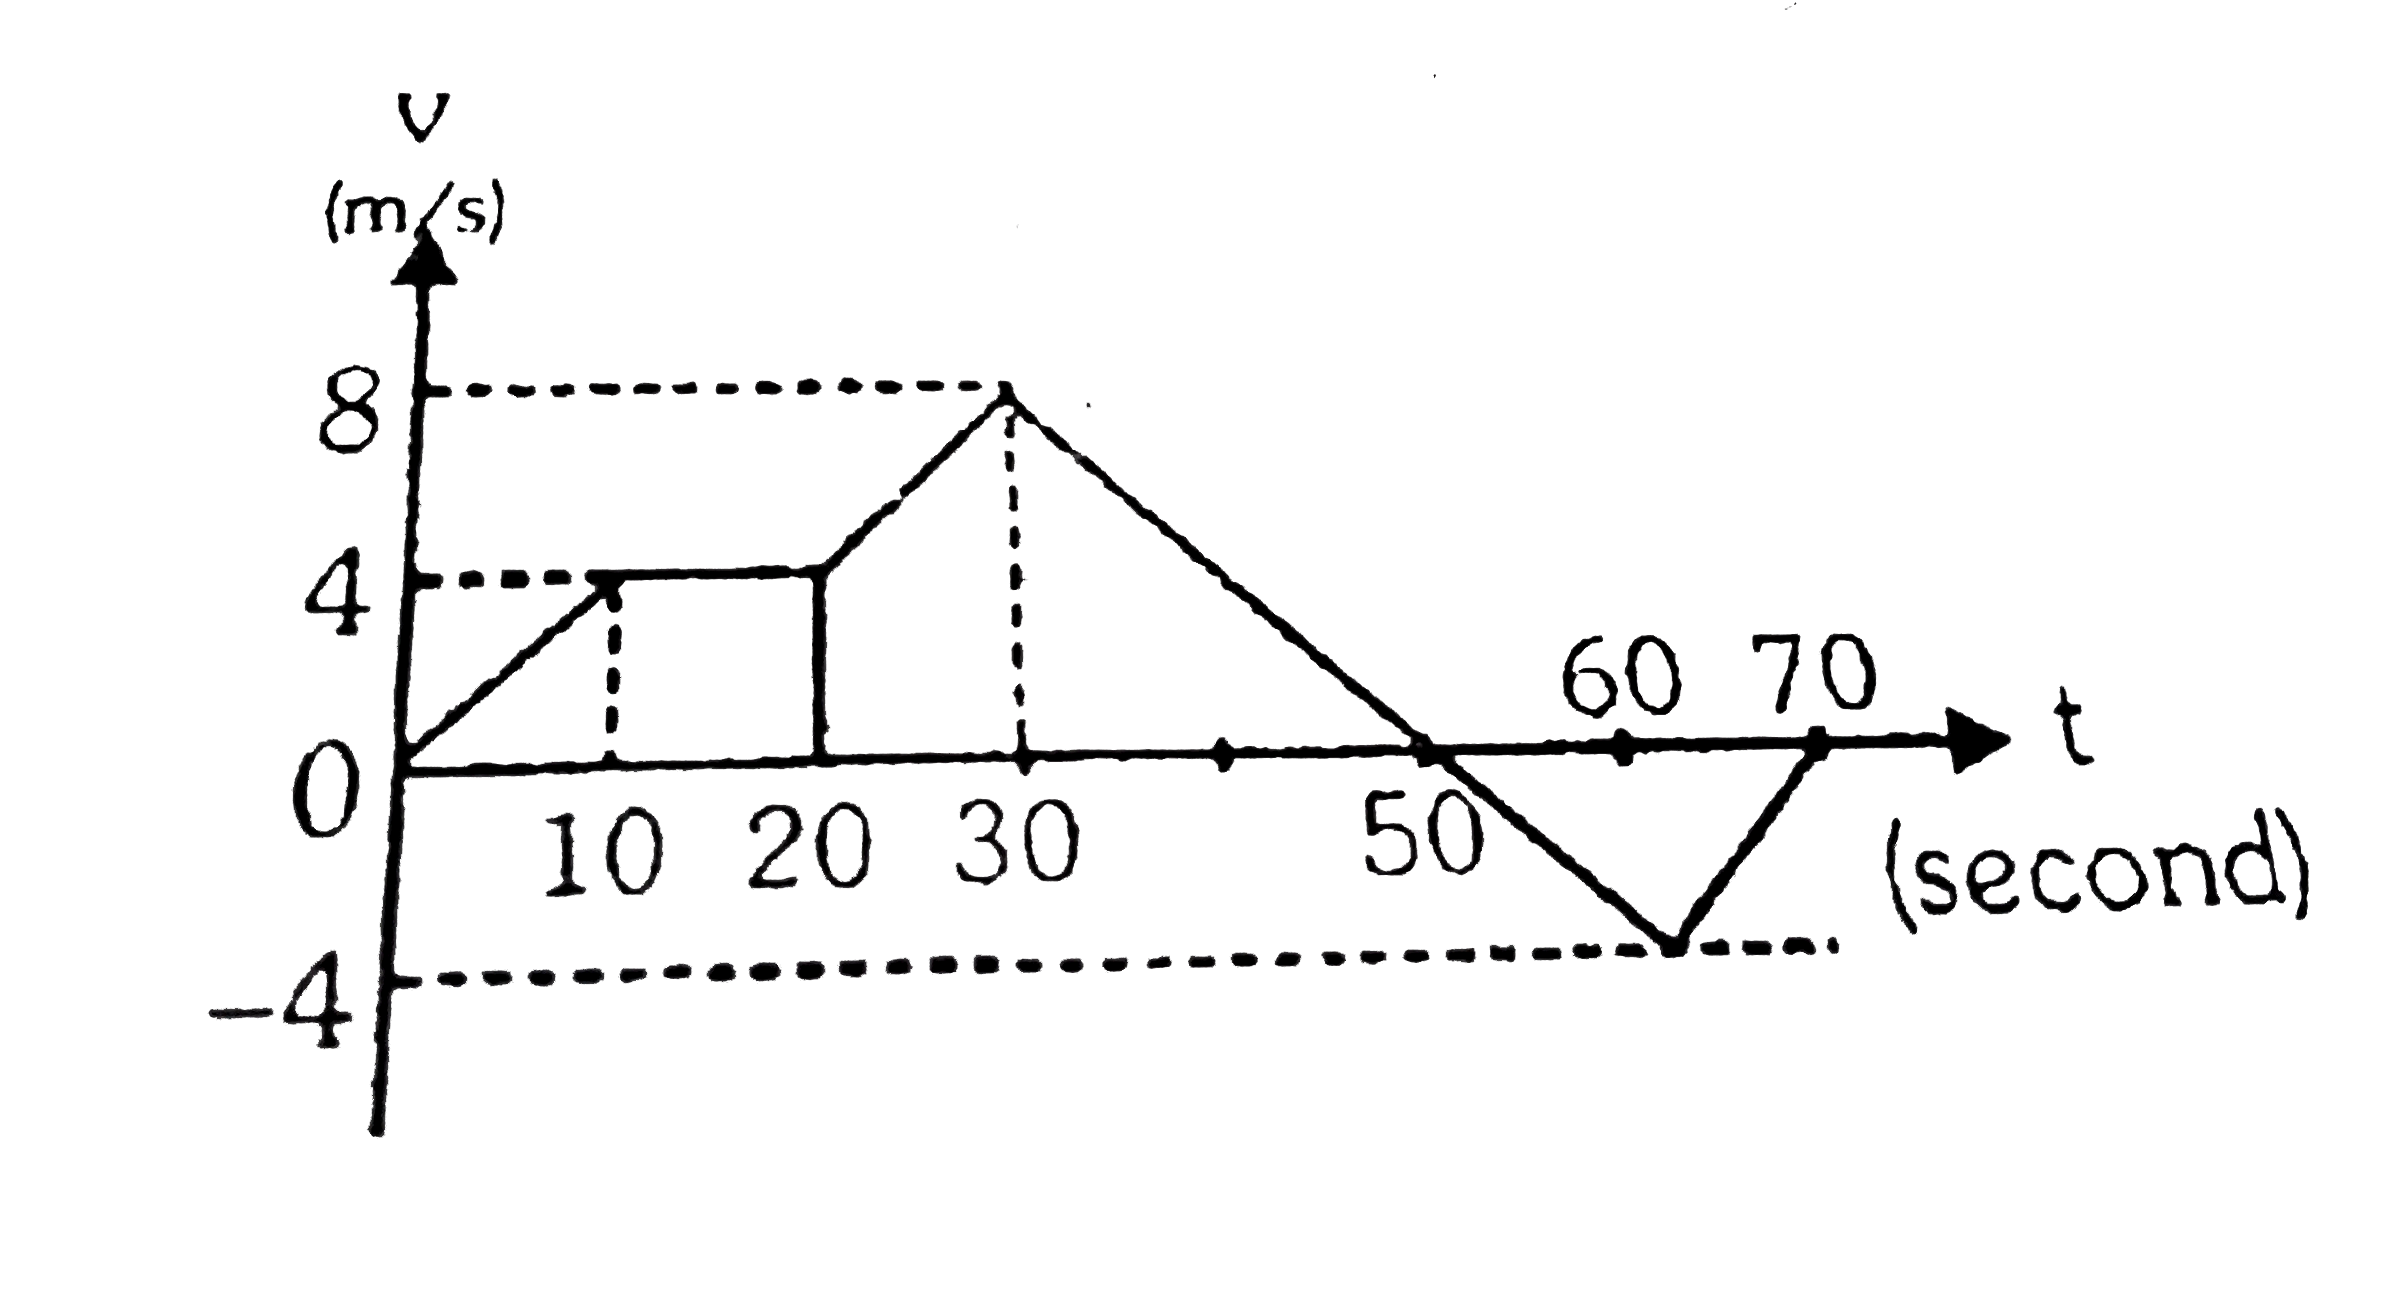
The variation of acceleration (a) with time (t) will be best represented by :-
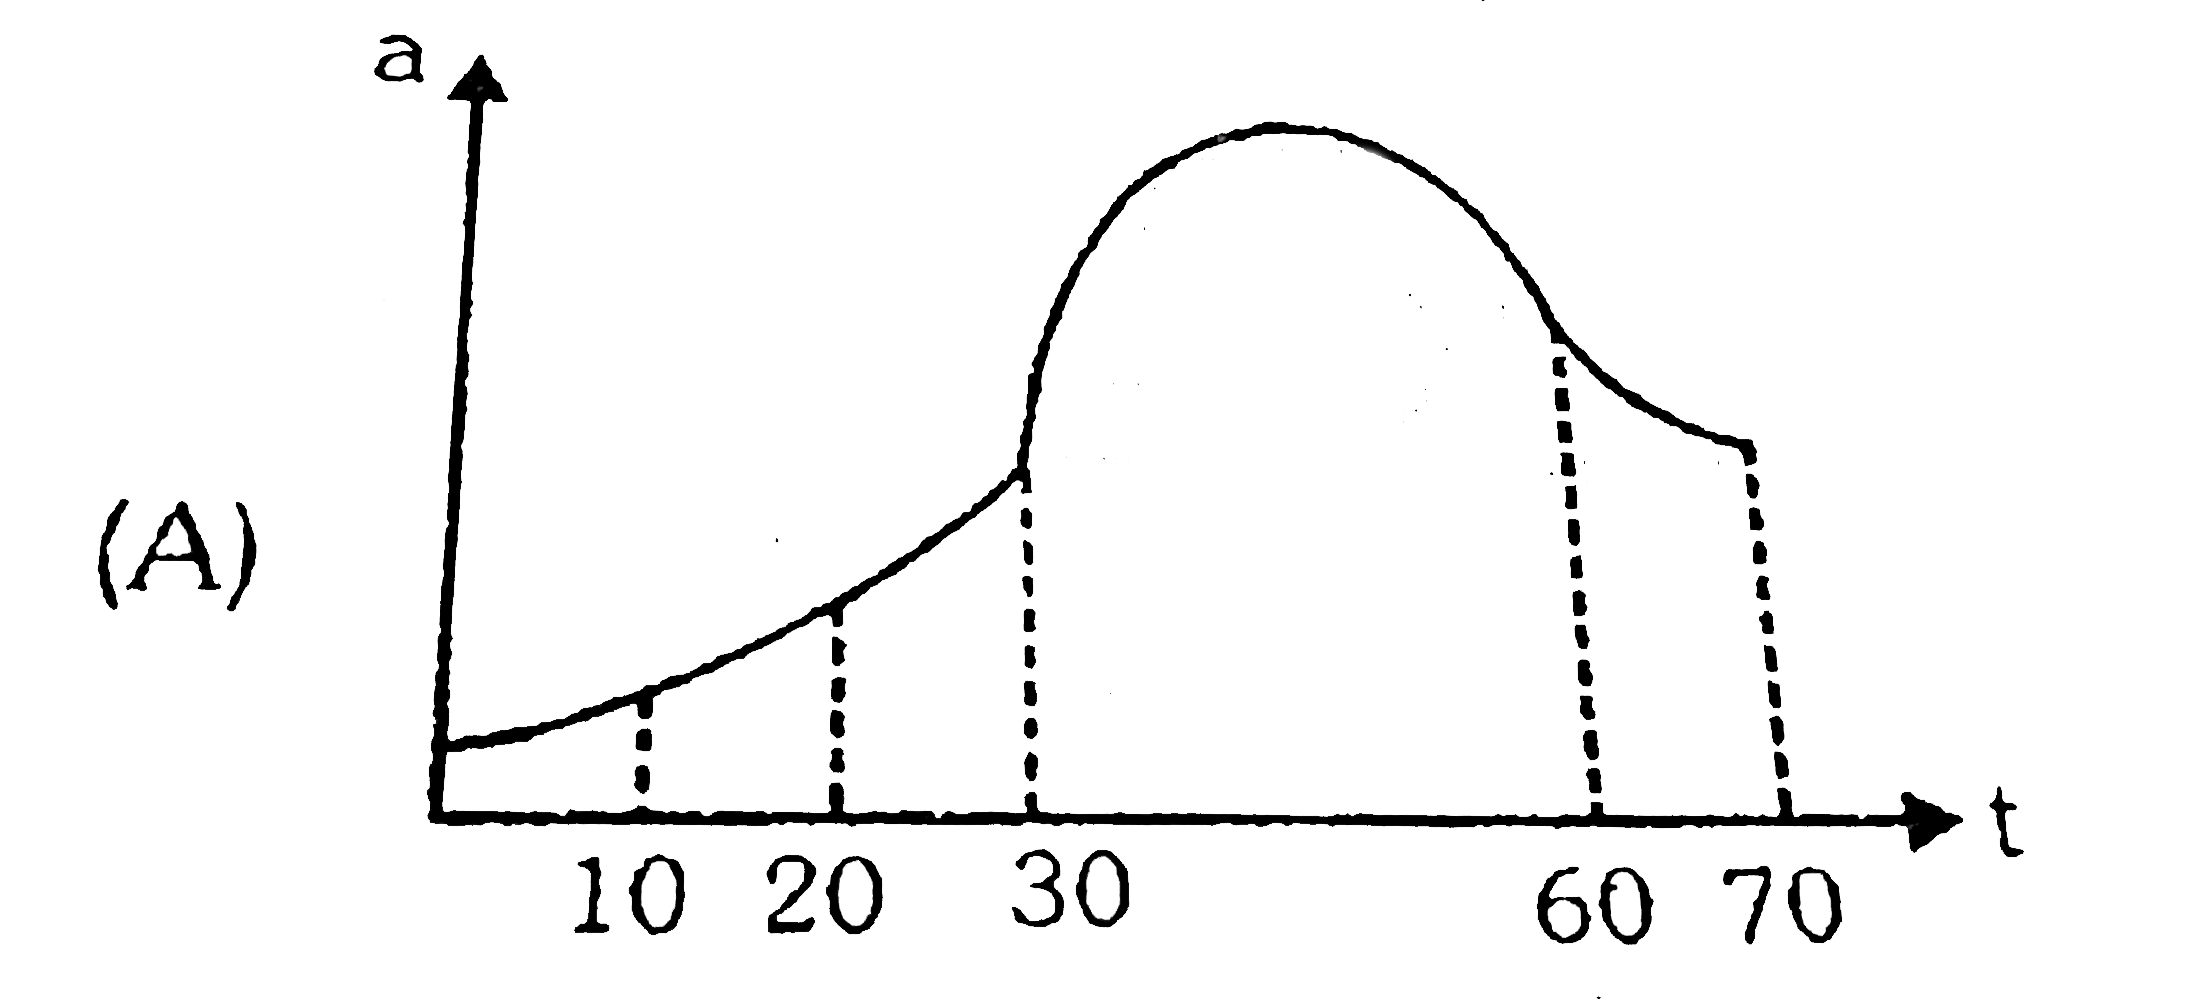
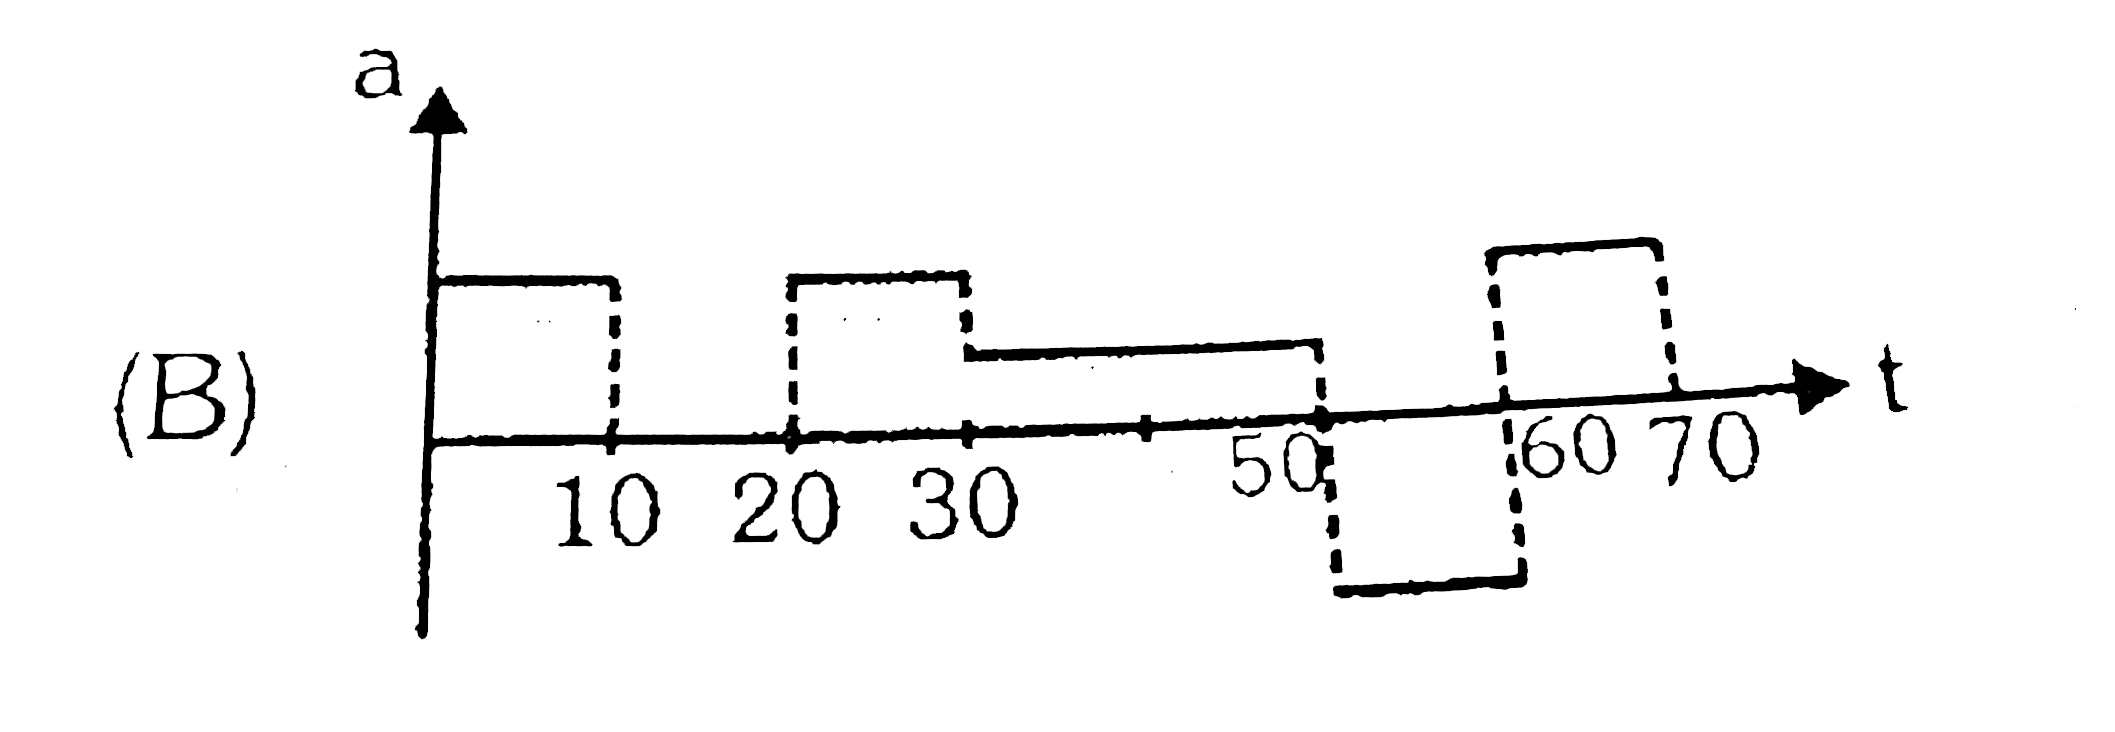
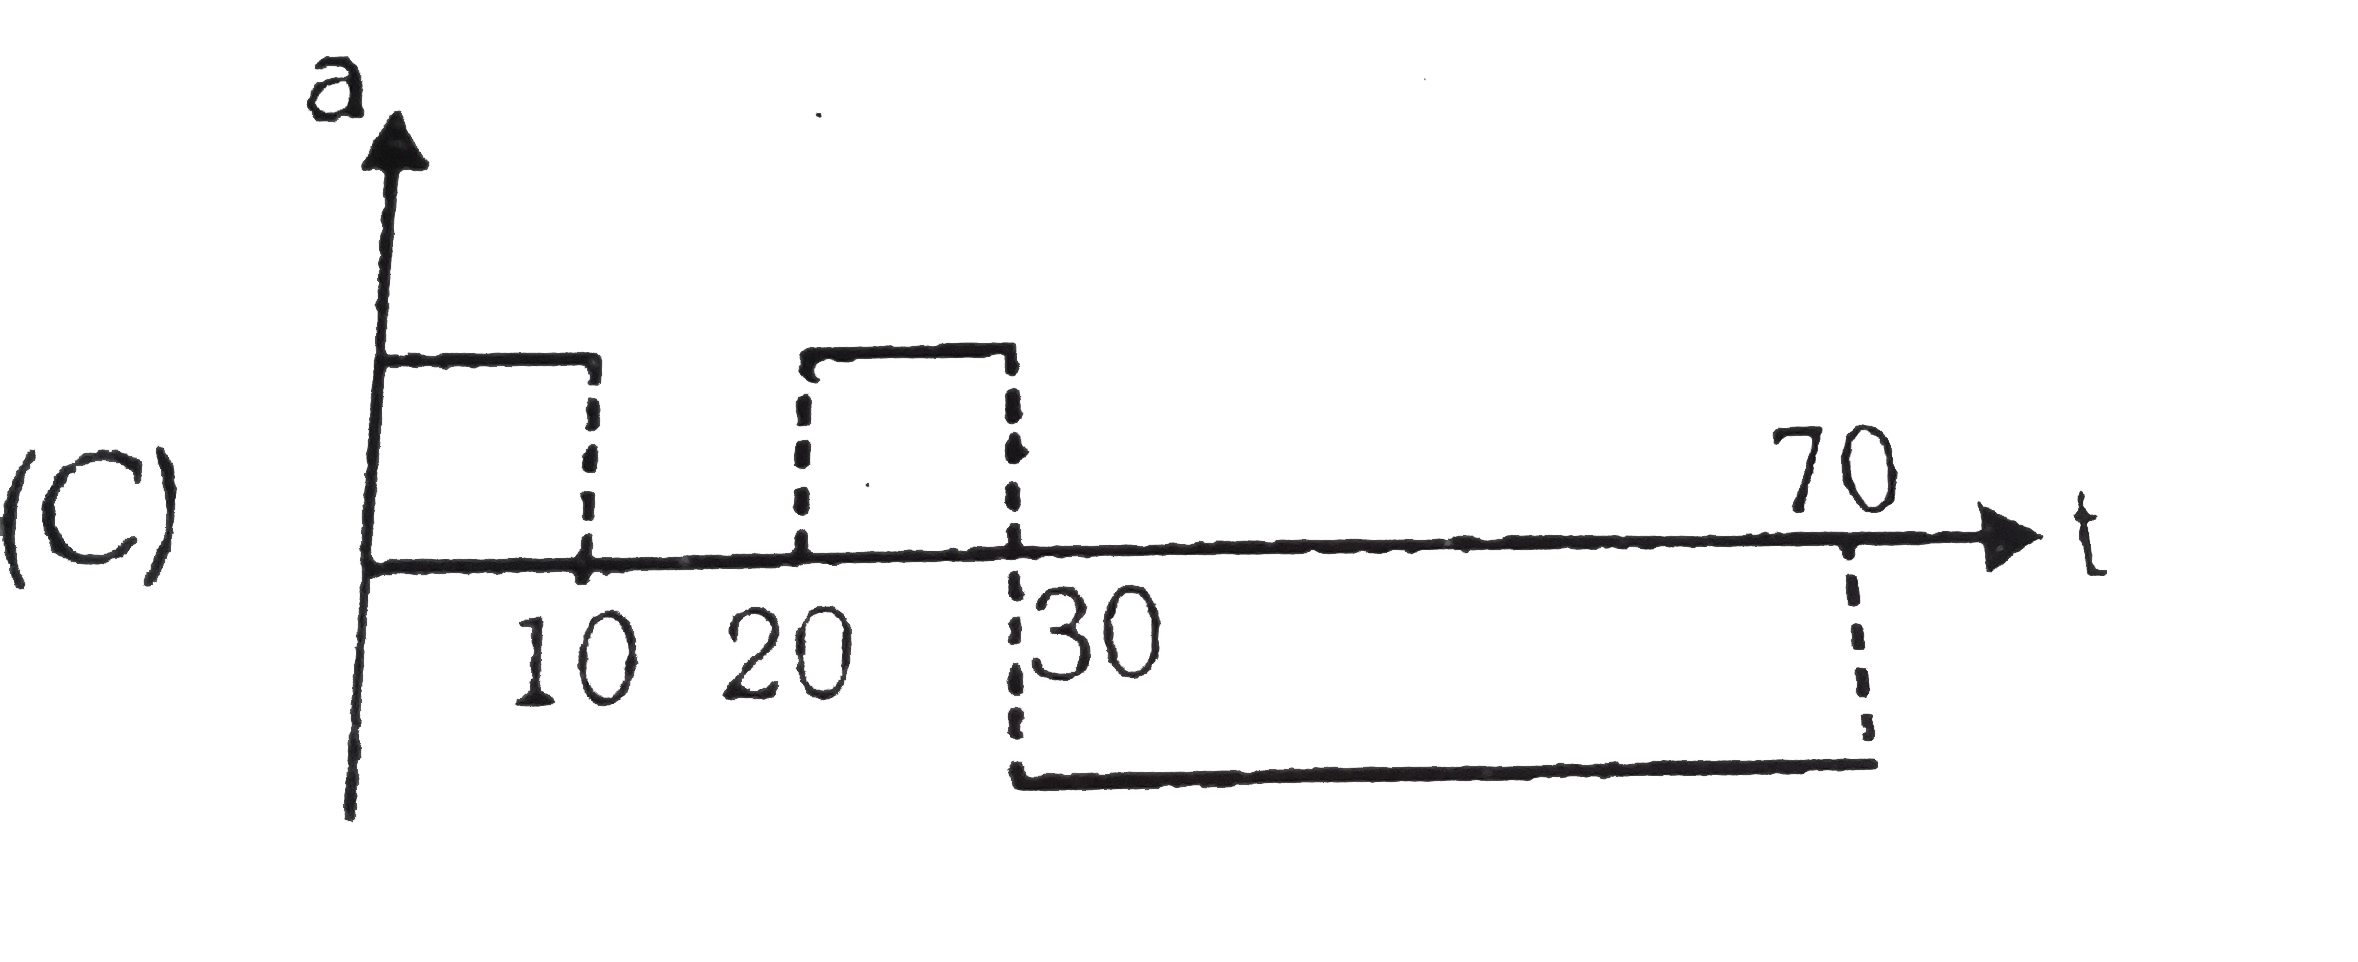

The correct Answer is:D
Positive slopes have positive acceleration, negative slopes have negative acceleration.
Topper's Solved these Questions
- BOOK - ALLENCHAPTER - KINEMATICSEXERCISE - Comprehension#35videos
KINEMATICS
- BOOK - ALLENCHAPTER - KINEMATICSEXERCISE - Comprehension#43videos
KINEMATICS
- BOOK - ALLENCHAPTER - KINEMATICSEXERCISE - Comprehension#13videos
KINEMATICS
- BOOK - ALLENCHAPTER - ERROR AND MEASUREMENTEXERCISE - Part-2(Exercise-2)(B)22videos
ERROR AND MEASUREMENT
- BOOK - ALLENCHAPTER - KINEMATICS (MOTION ALONG A STRAIGHT LINE AND MOTION IN A PLANE)EXERCISE - BEGINNER S BOX-78videos
KINEMATICS (MOTION ALONG A STRAIGHT LINE AND MOTION IN A PLANE)
Similar Questions
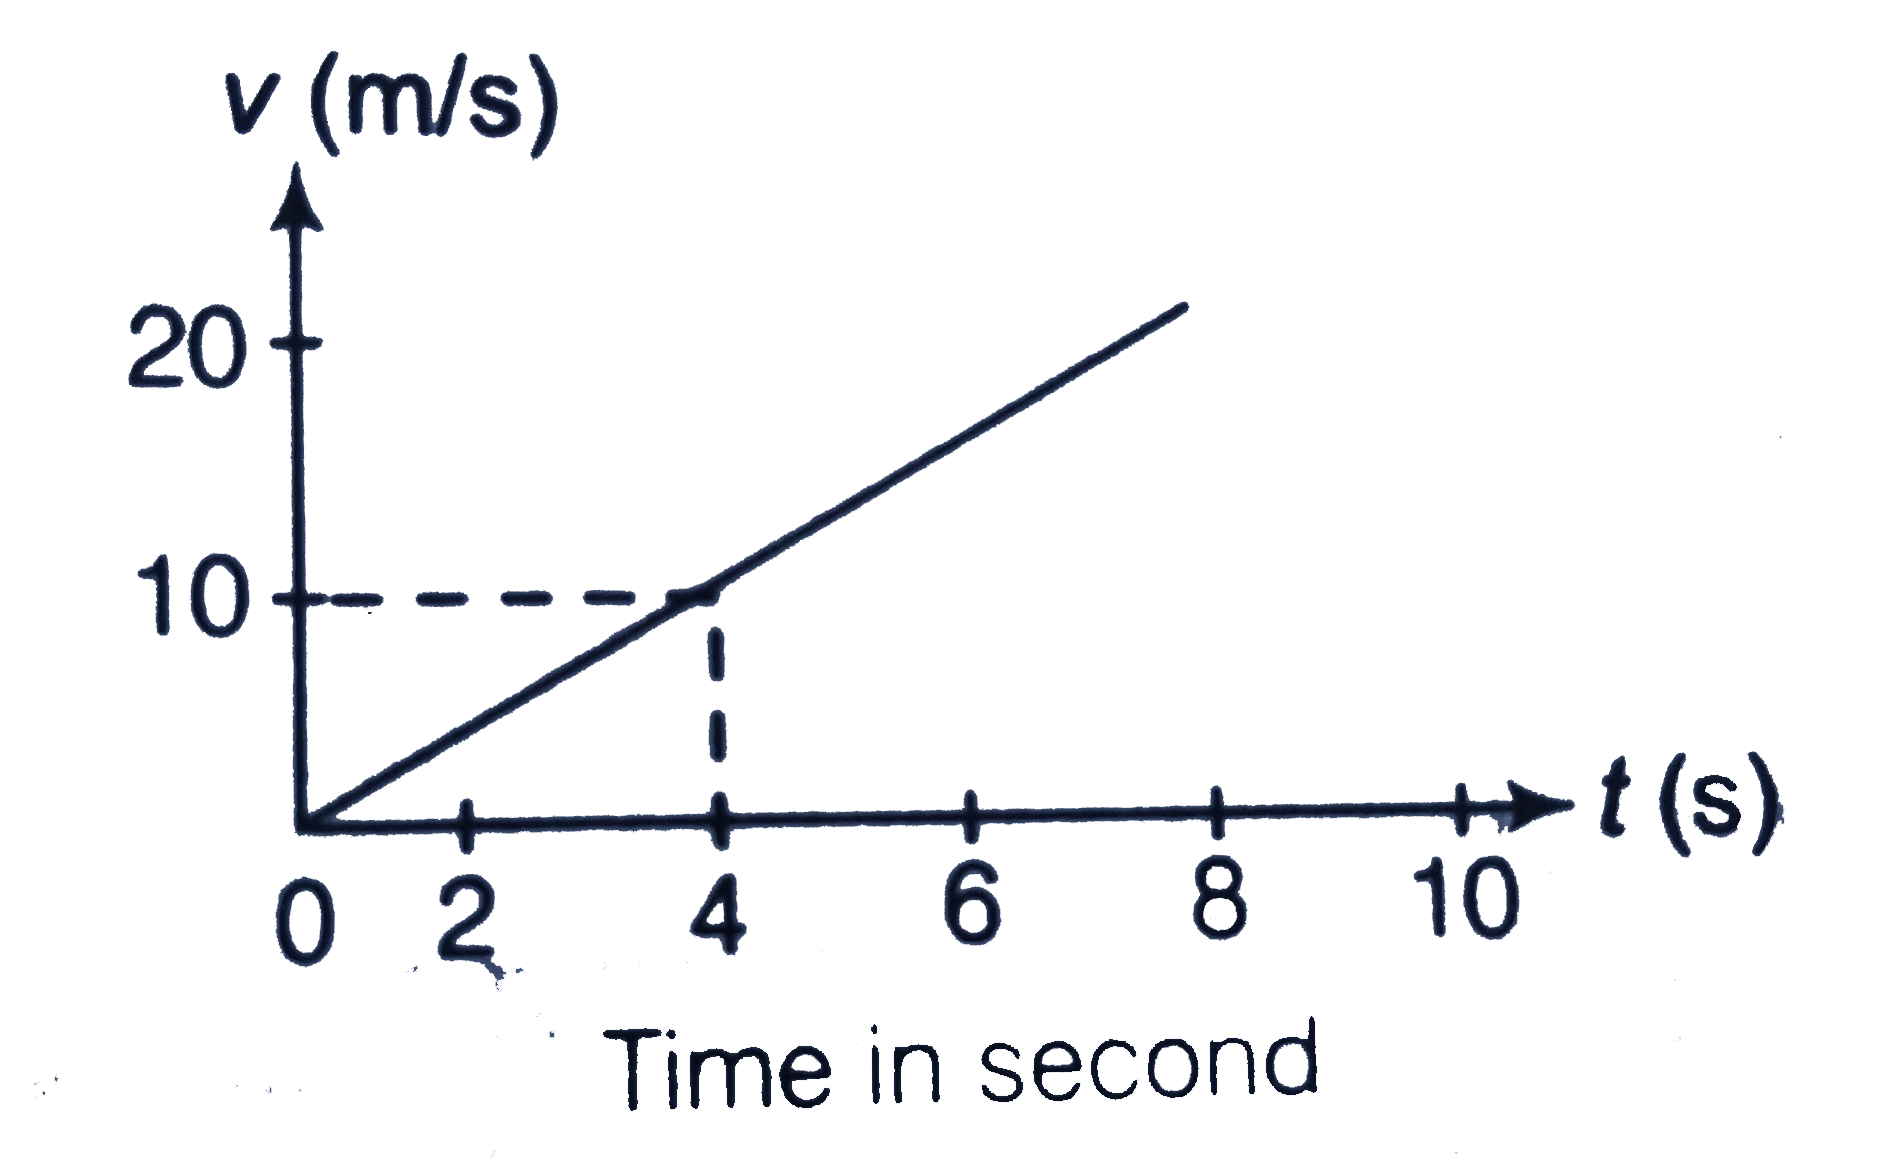
The velocity of a car as a function of time is shown in Fig. Find the distance travelled by the car in 8s and its acceleration.
 View Solution
A car is moving on a straight road. The velocity of the car varies with time as shown in the figure. Initially (at t=0), the car was at x=0, where, x is the position of the car at any time 't'.
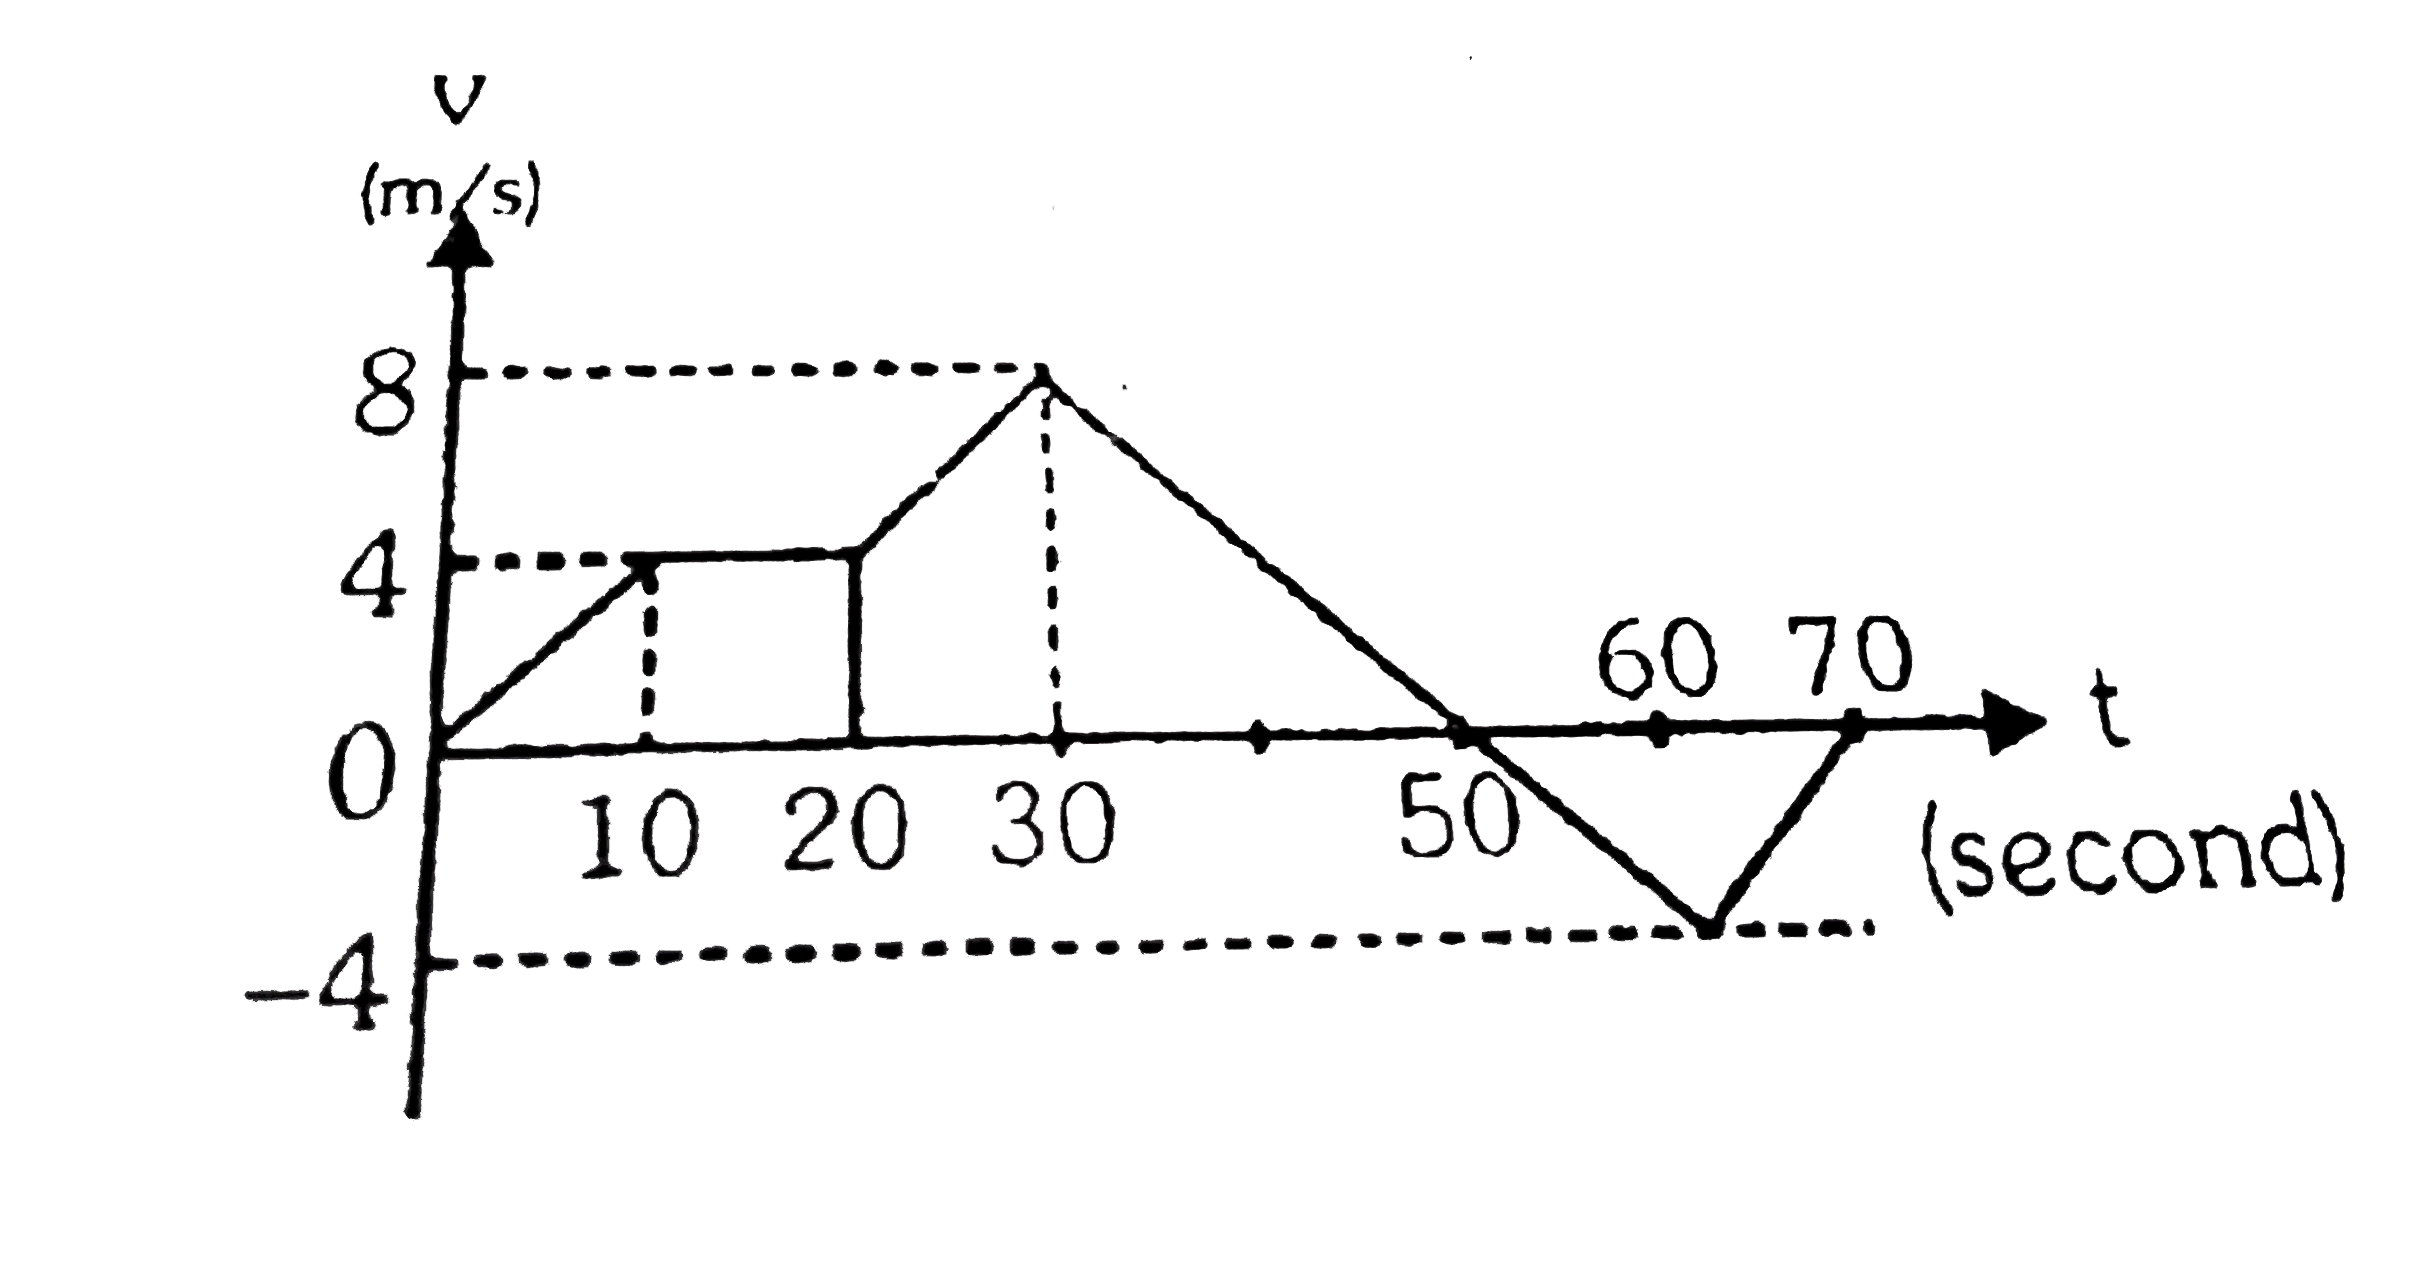
The time interval during which the car is retarding can be :-View Solution
Knowledge Check
- Question 1 - Select One
A car is moving on a straight road. The velocity of the car varies with time as shown in the figure. Initially (at t=0), the car was at x=0, where, x is the position of the car at any time 't'.
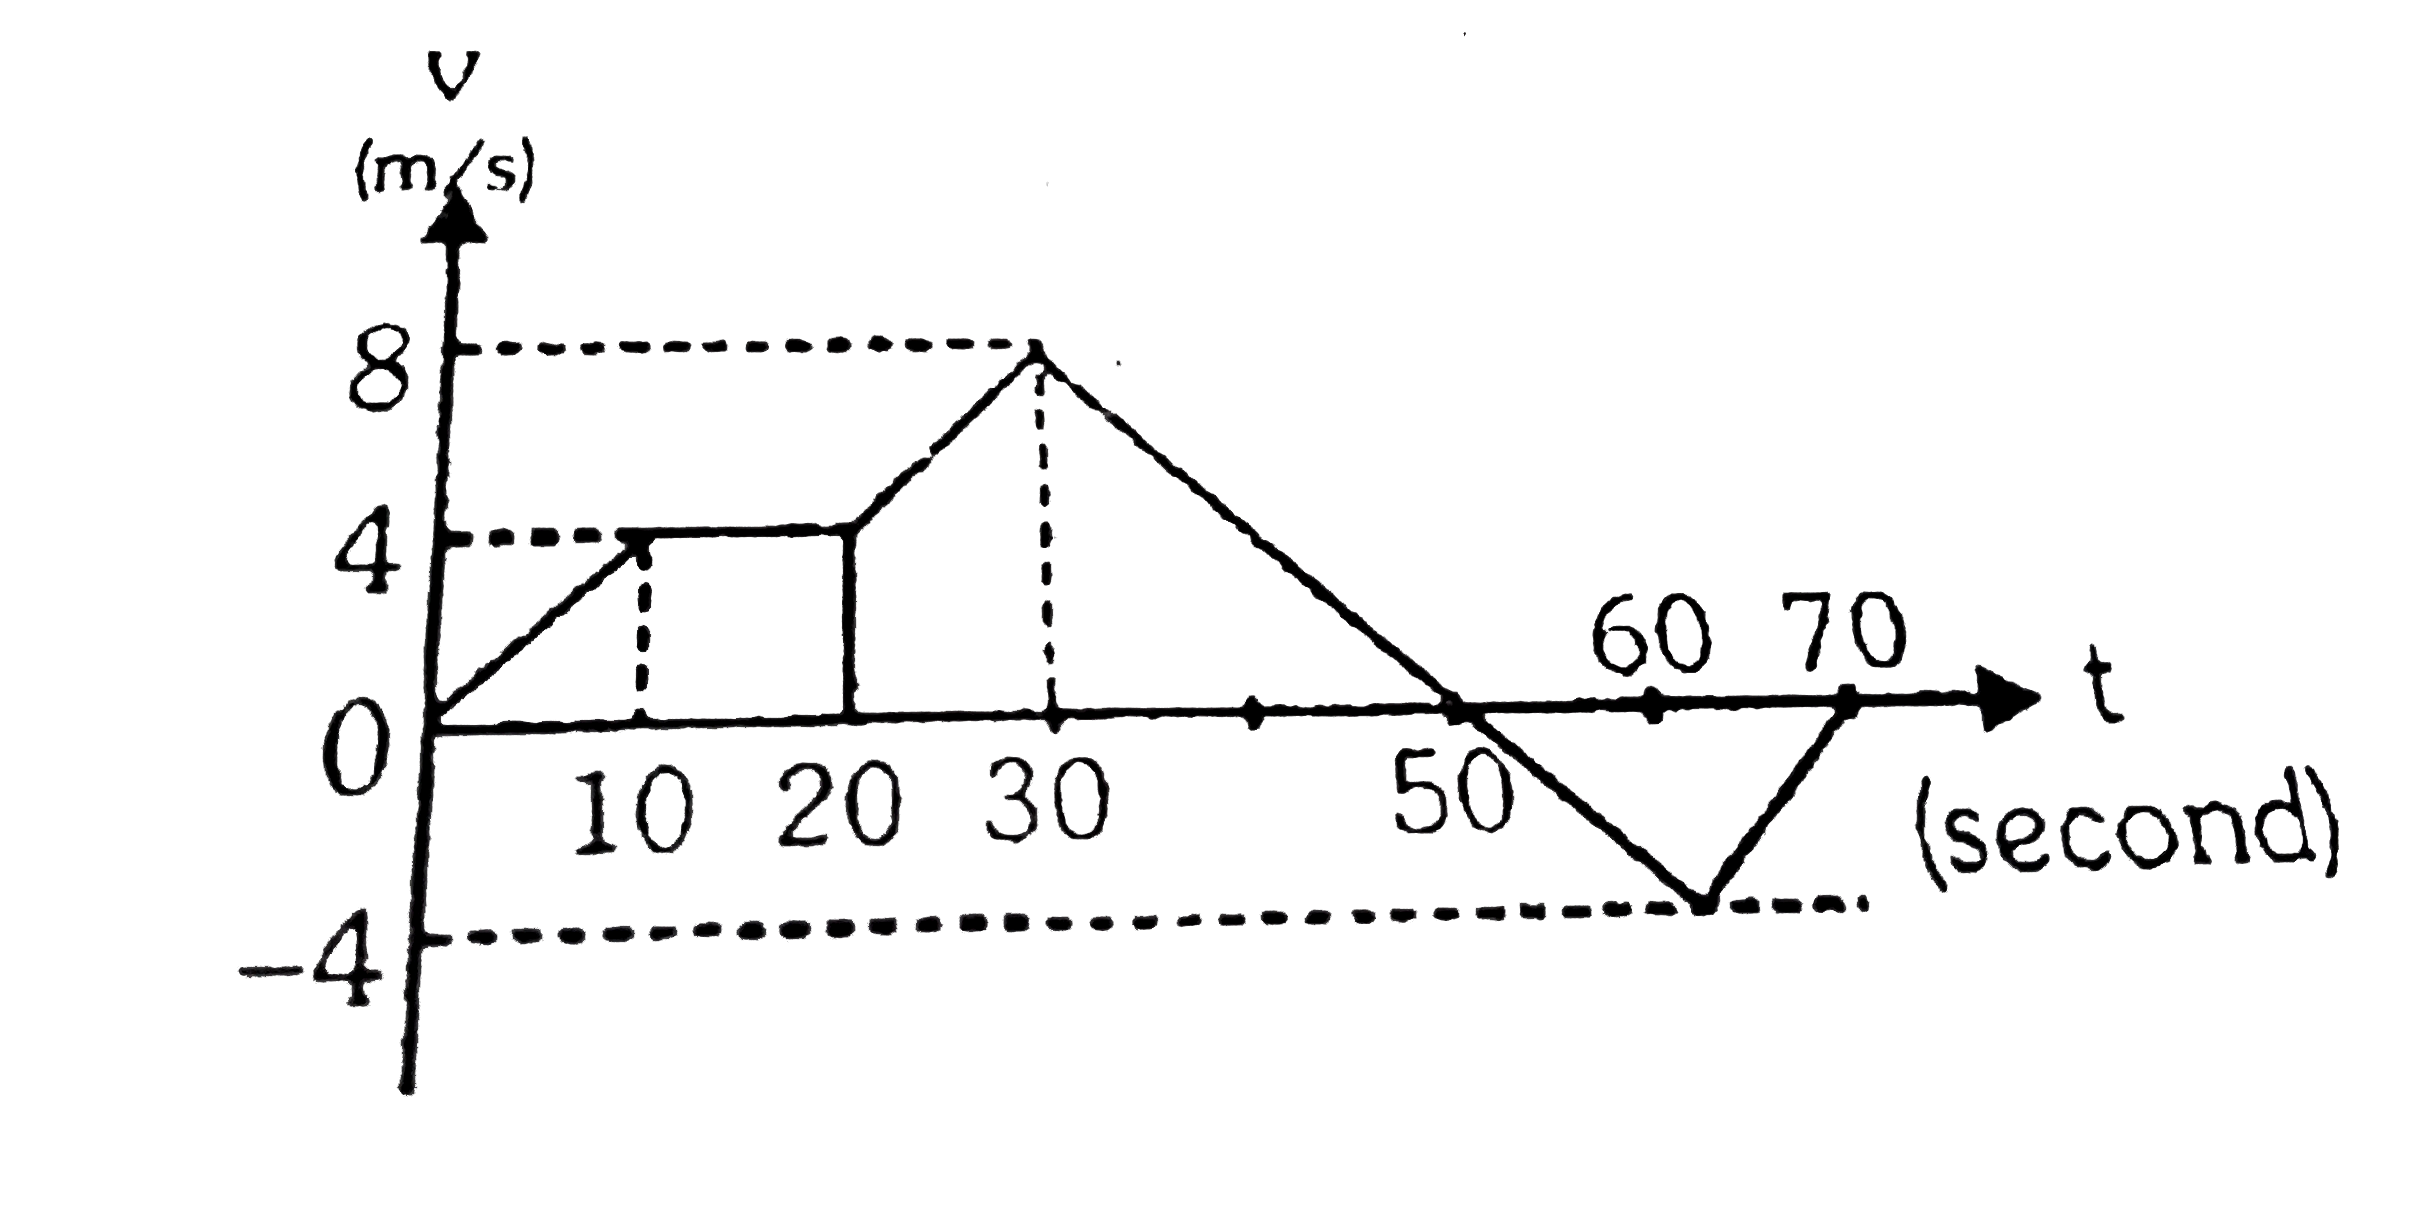
The maximum displacement from the starting position will be :-A200 mB250 mC160 mD165 m - Question 2 - Select One
A car is moving on a straight road. The velocity of the car varies with time as shown in the figure. Initially (at t=0), the car was at x=0, where, x is the position of the car at any time 't'.
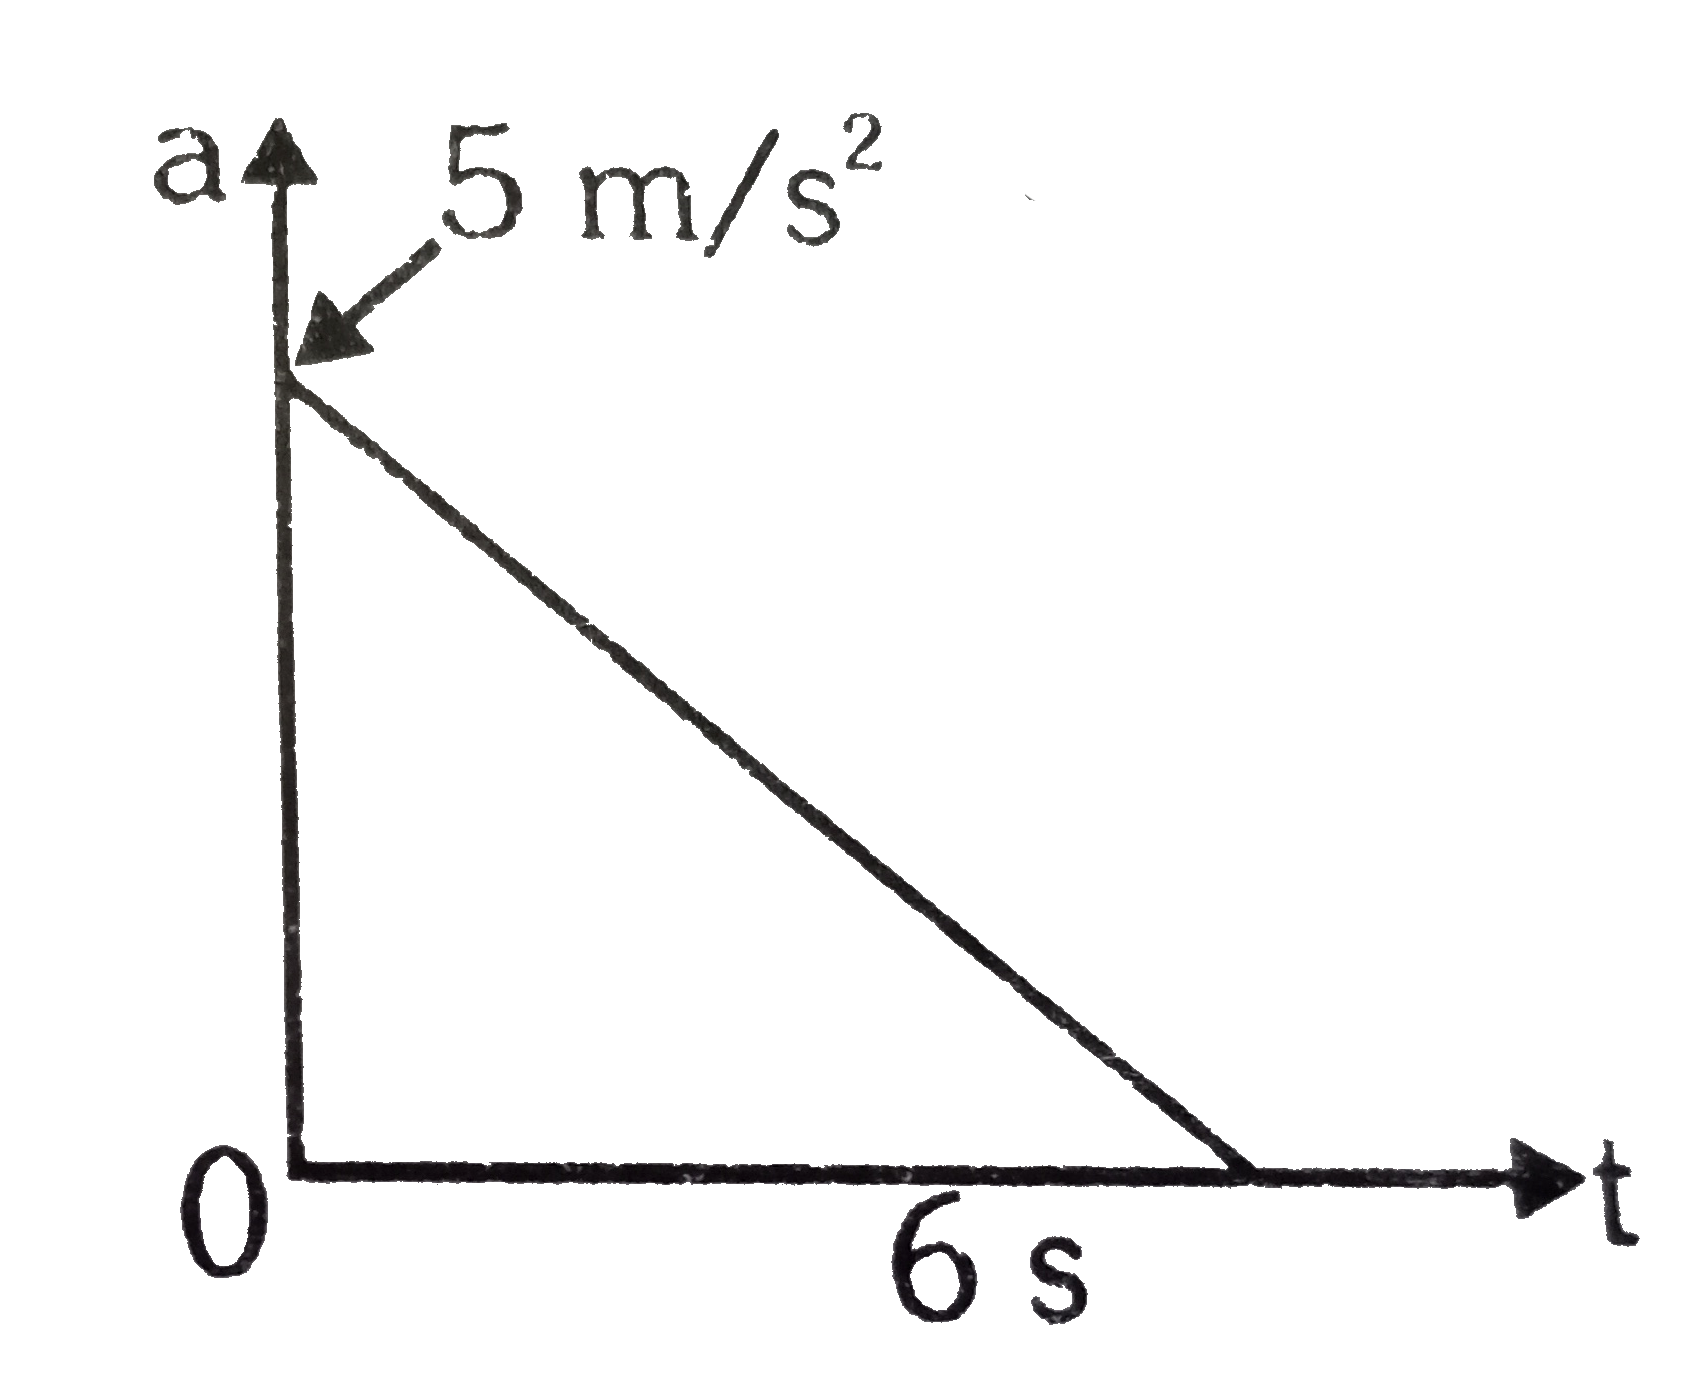
Average speed from t=0 to t=70s will be :-A167m/sB247m/sC207m/sDzero - Question 3 - Select One
A car is moving on a straight road. The velocity of the car varies with time as shown in the figure. Initially (at t=0), the car was at x=0, where, x is the position of the car at any time 't'.
The displacement time graph will be best represented by :-A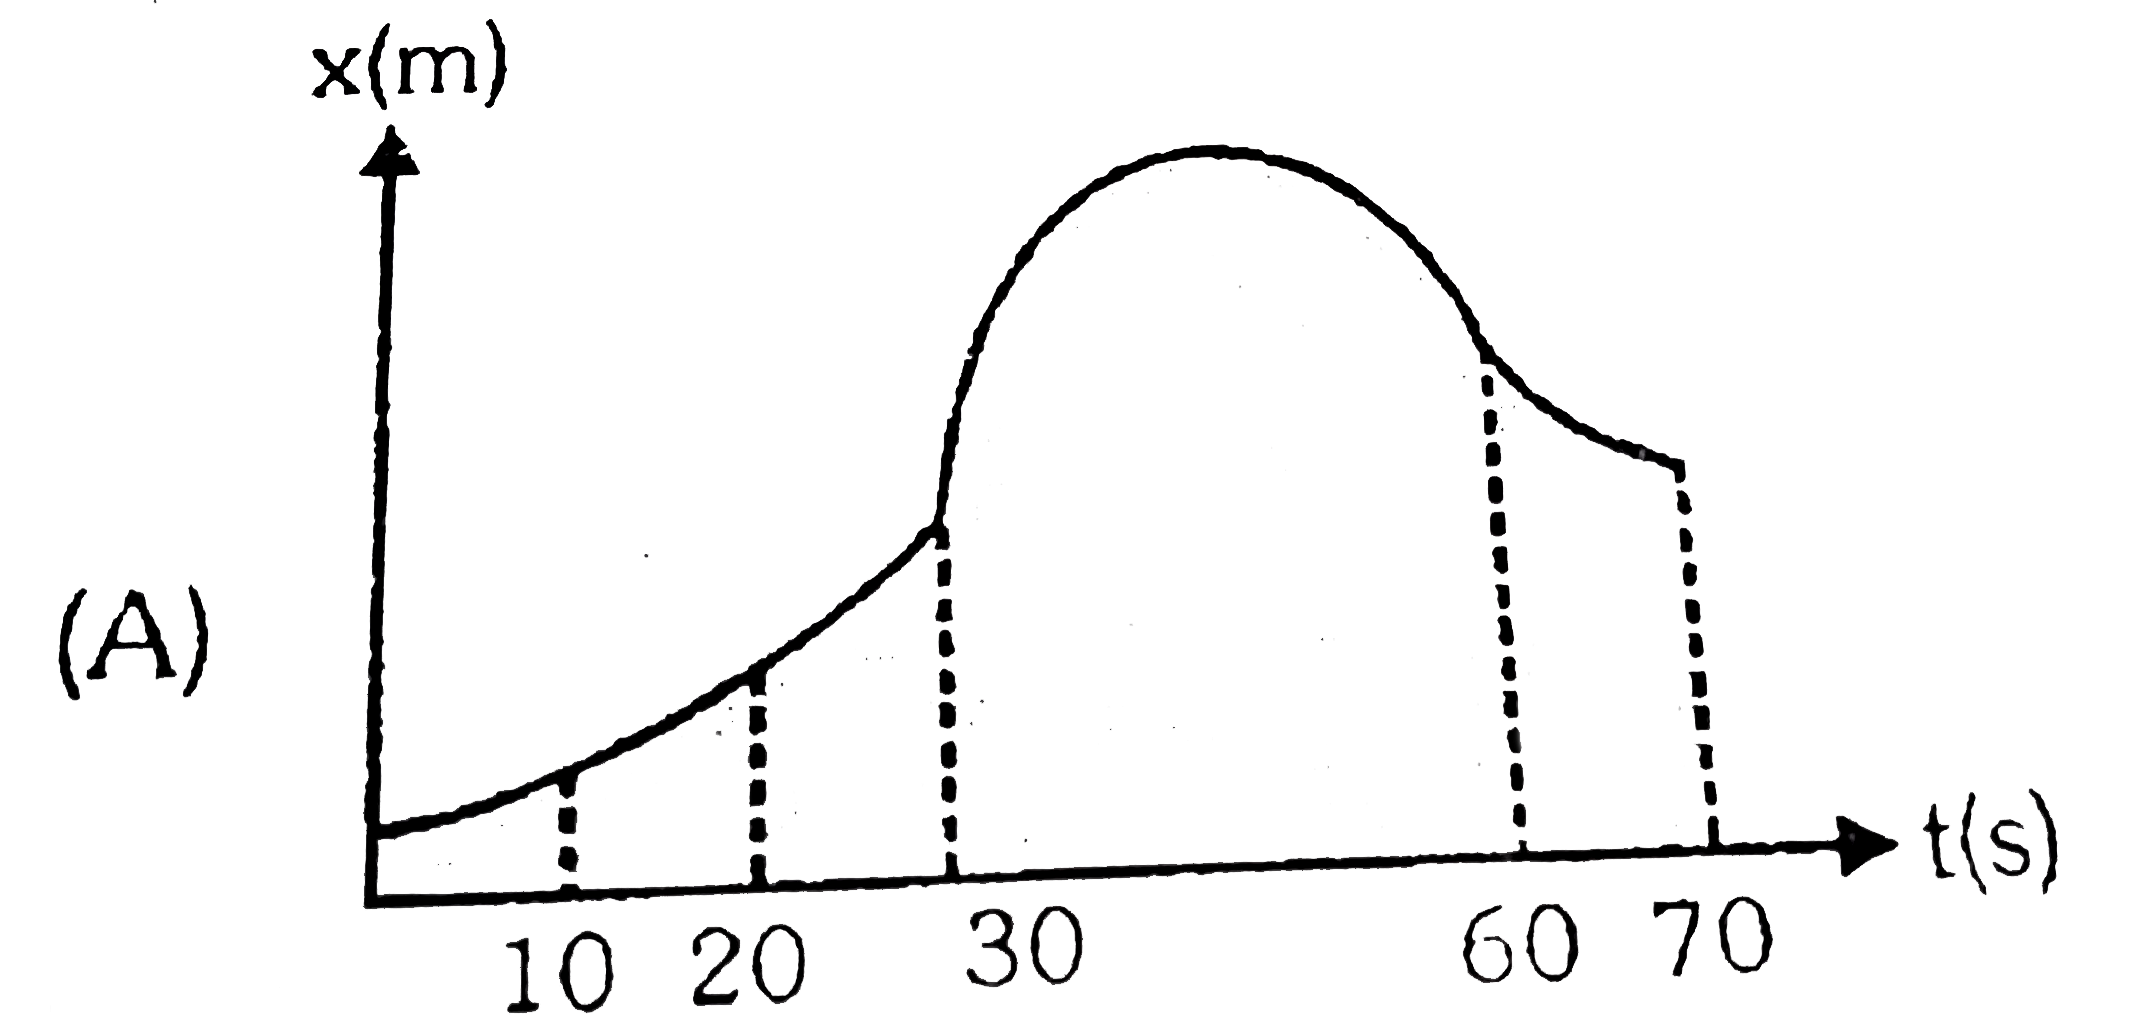 B
B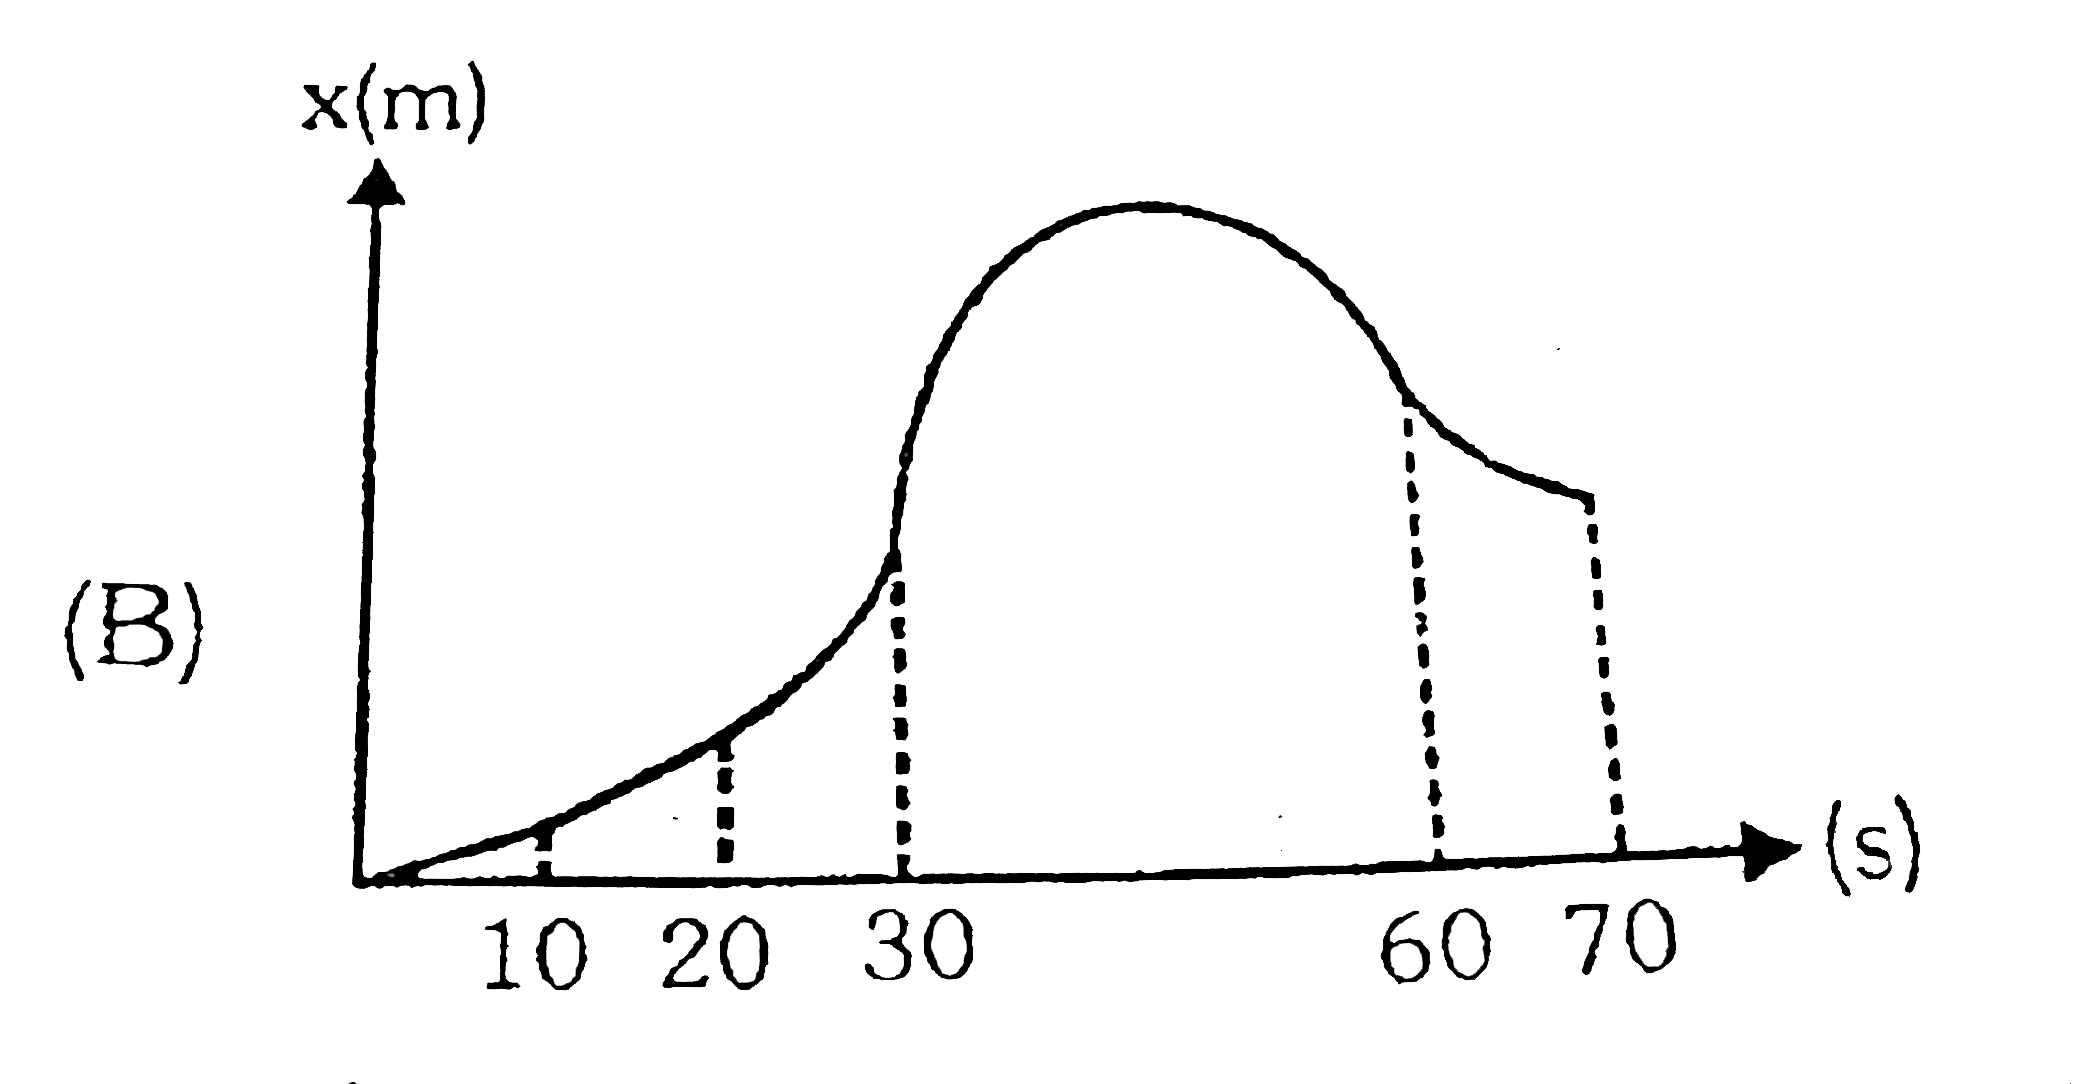 C
C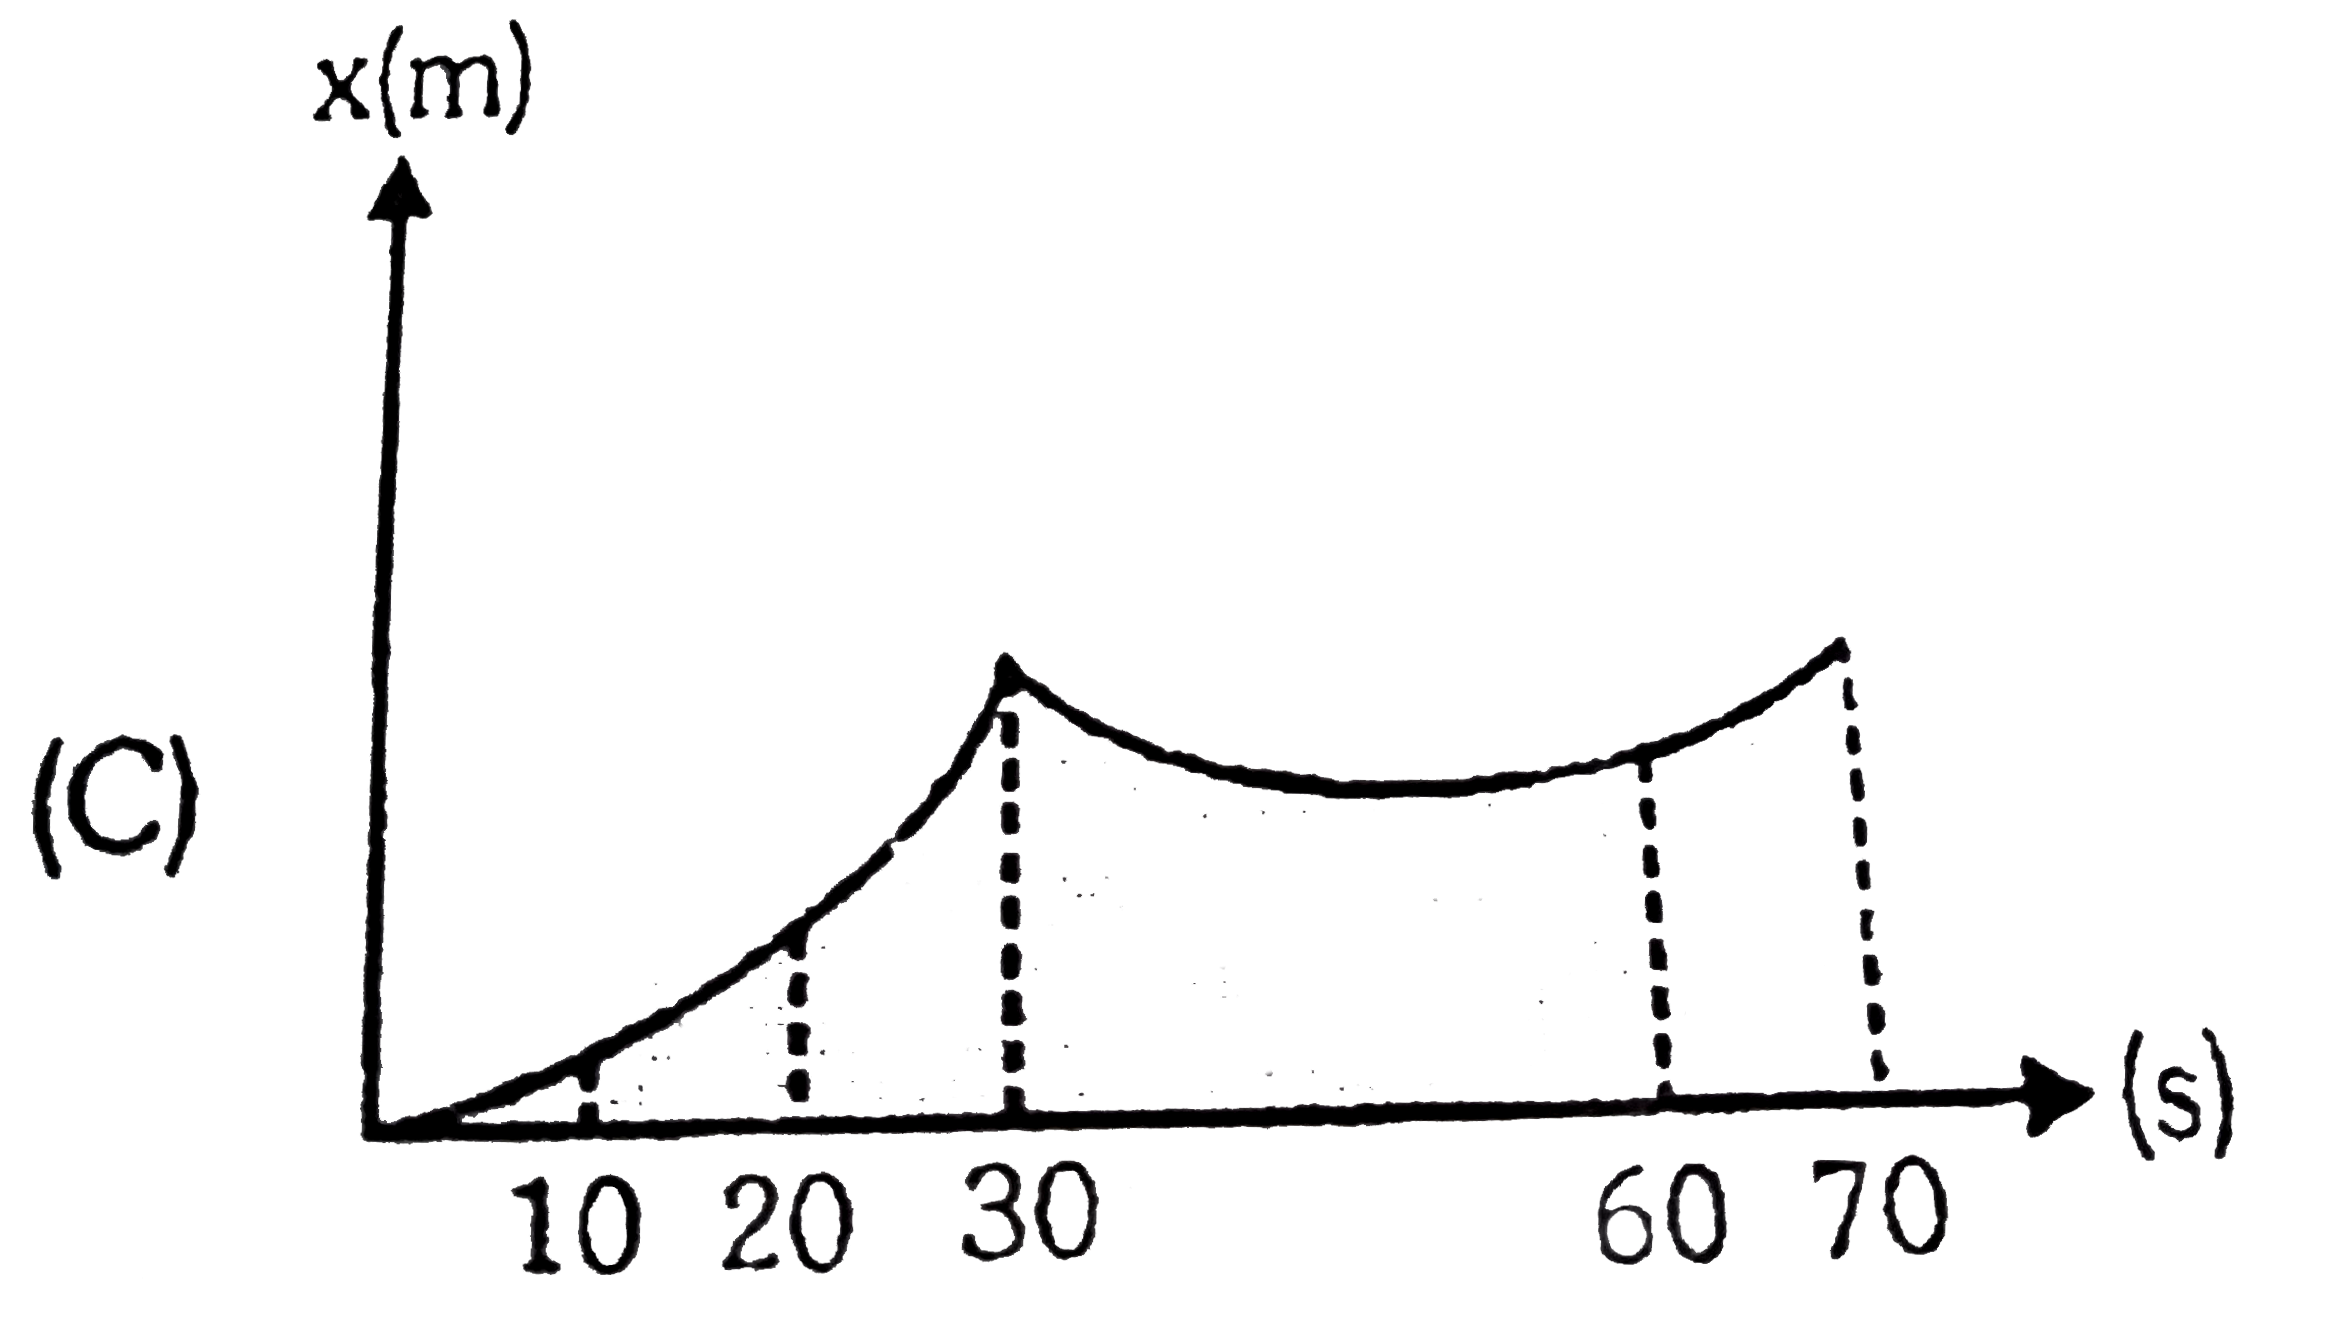 D
D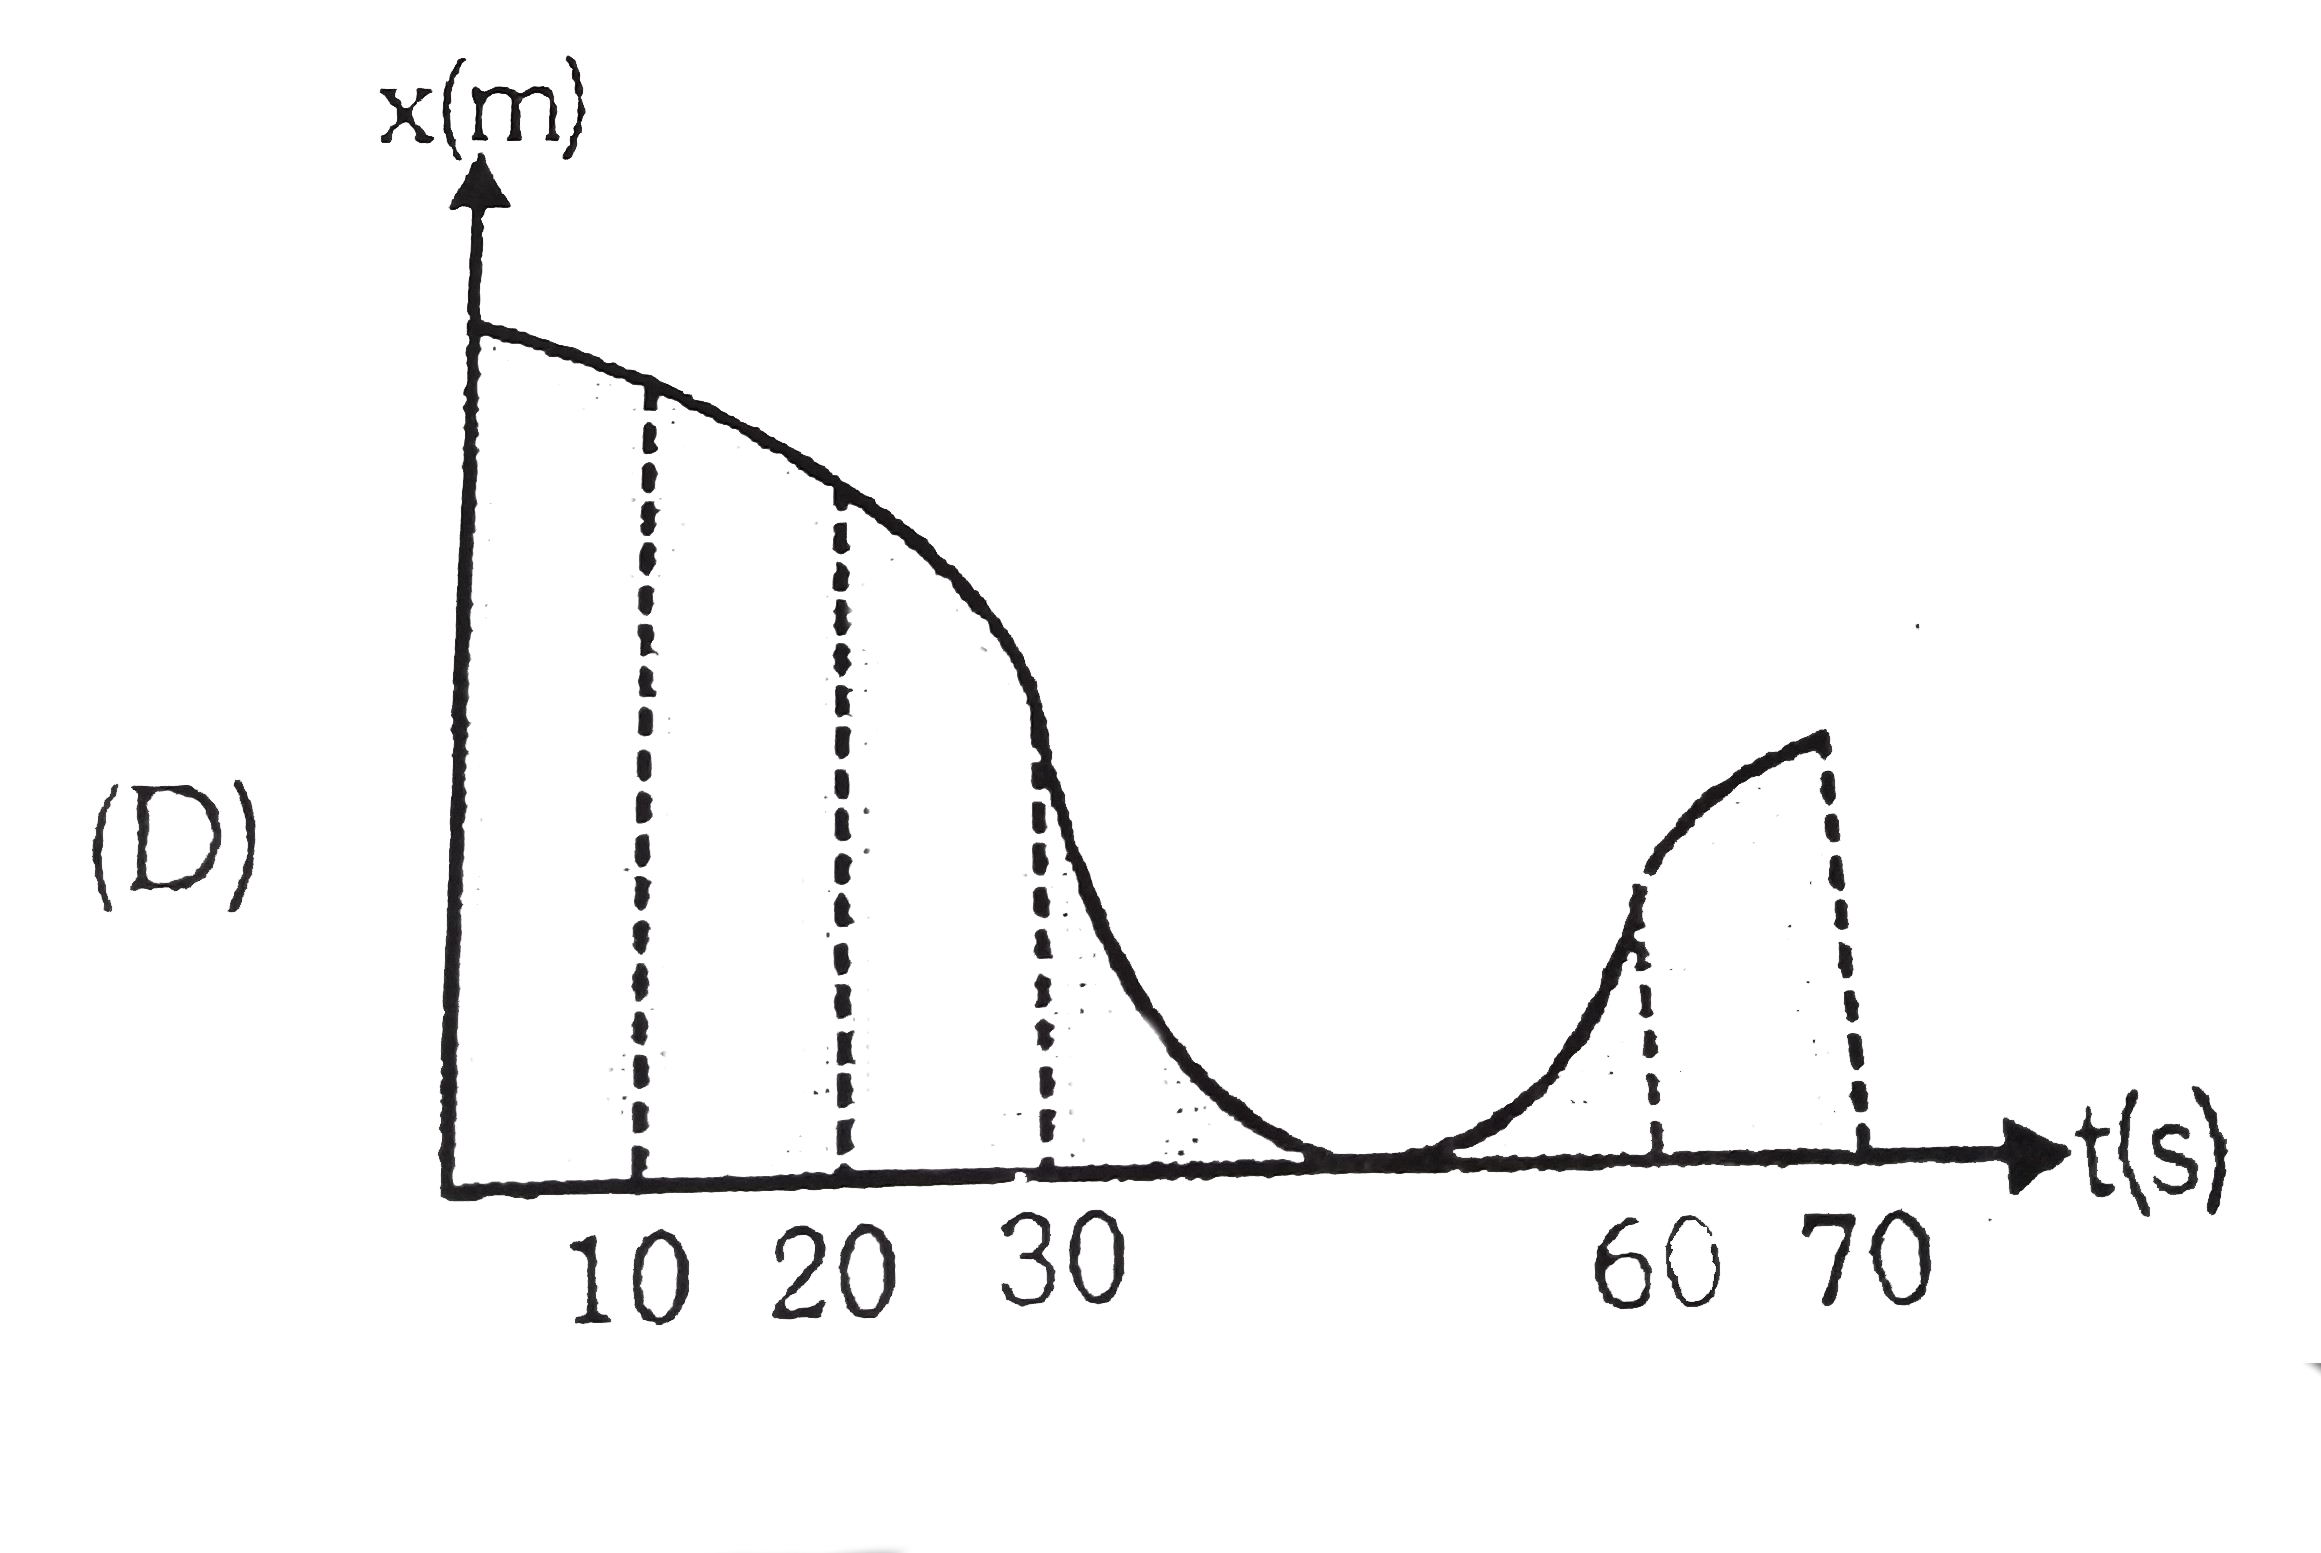
A constant power P is applied to a car starting from rest. If v is the velocity of the car at time t, then:
View SolutionA constant power P is applied to a car starting from rest If v is the velocity of the car at time t,then
View SolutionA constant power P is applied to a car starting from rest If v is the velocity of the car at time t,then
View SolutionCar A and car B move on a straight road and their velocity versus time graph are as shown in figure. Comparing the motion or car A in between t=0 to t=8sec. And motion of car B in between t=0 to t=7sec., pick up the correct statement.
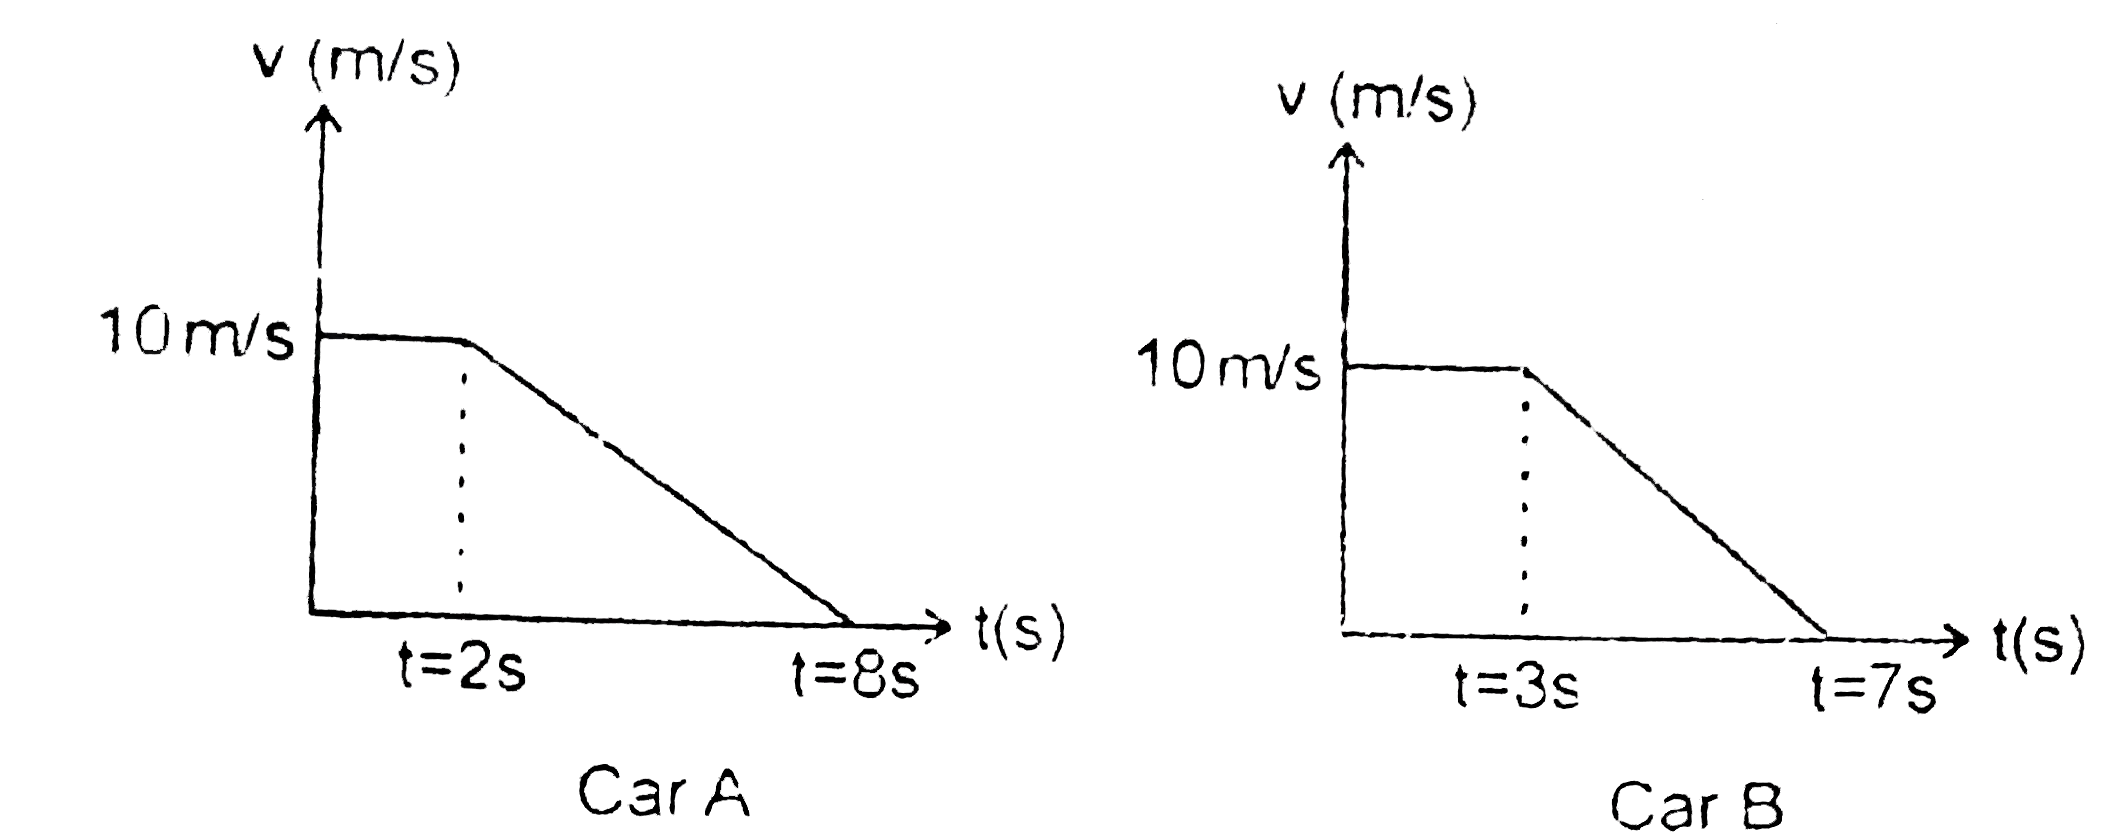 .View Solution
The graph shown the variation with times t of the velocity v of an object . Which one of the following graphs best represents the variation of acceleration a of the object with time t?
 View Solution

