A survey was carried out in a certain school to find about different modes of transport used by students to travel to school each day. 30 students of class VI were interviewed and the data obtained was displayed in the form of a pictographs given below: Mode of Transport, Number of Students Scooter, Figure Public Bus, Figure School Bus, Figure Cycle, Figure Walking, Figure Look at the above pictograph and answer the following questions: Look at the above pictograph and answer the following questions: How many students are using cycle or walking as a mode of travel? Which is most popular mode of travel?
Step by step video & image solution for A survey was carried out in a certain school to find about different modes of transport used by students to travel to school each day. 30 students of class VI were interviewed and the data obtained was displayed in the form of a pictographs given below: Mode of Transport, Number of Students Scooter, Figure Public Bus, Figure School Bus, Figure Cycle, Figure Walking, Figure Look at the above pictograph and answer the following questions: Look at the above pictograph and answer the following questions: How many students are using cycle or walking as a mode of travel? Which is most popular mode of travel? by Maths experts to help you in doubts & scoring excellent marks in Class 6 exams.
Updated on:21/07/2023Topper's Solved these Questions
Similar Questions
A survey was carried out on 30 students of class VI in a school. Data about the different modes of transport used by them to travel to school was displayed as pictograph. What can you conclude from the pictograph?
View SolutionA survey was carried out in a certain school to find out the popular school subjects among students of Classes VI to VIII. The data in this regard is displayed as pictograph given below:
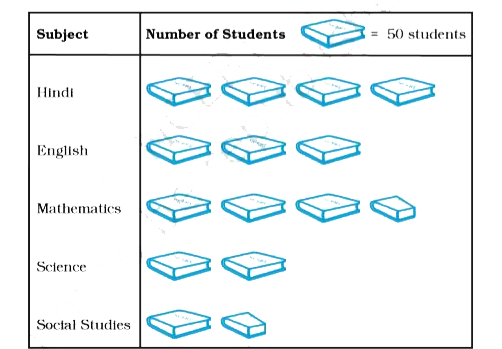
Which subject is most popular among the students?
View Solution
Knowledge Check
The following pictograph shows different using conveyance by the students of a school:

What per cent of students used school bus?A0.06B0.16C0.4D0.36The following graph represents the transport used by children. Study the graph and answer the given questions.
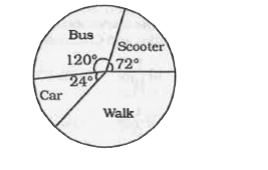
What is the percentage of children using scooter ?A1800B2000C3600D3000
A survey was carried out in a certain school to find out the popular school subjects among students of Classes VI to VIII. The data in this regard is displayed as pictograph given below:
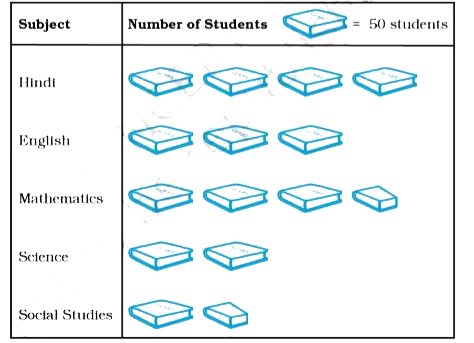
How many students like Mathematics?
View SolutionA survey was carried out in a certain school to find out the popular school subjects among students of Classes VI to VIII. The data in this regard is displayed as pictograph given below:
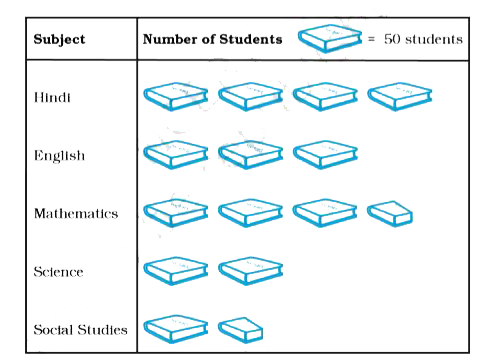
Find the number of students who like subjects other than Mathematics and Science.
View Solution70 students from a locality use different modes of transport to go to school as given below:

Draw the bar graph representing the above data.
View Solution70 students from a locality use different modes of transport to go to school as given below:
 Draw the bar graph representing the above data.
View SolutionA survey was carried out by the principal of a school to find the favourite subject of middle school students. The results of the survey is shown in the pictograph.
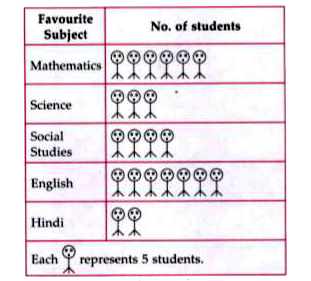
How many more students like English than Science?
View SolutionThe number of girl students in each class of co-ed. Middle school is depicted by the following pictograph: Class, No. of girls, = 4 girls I, Figure, II, Figure, III, Figure, IV, Figure, V, Figure, VI, Figure, VII, Figure, VIII, Figure, Observe the above pictograph and answer the following questions: Which class has the maximum number of girl students? Is the number of girls in class VI is less than the number of girls in class V? How many girls are there in VII class?
View Solution
