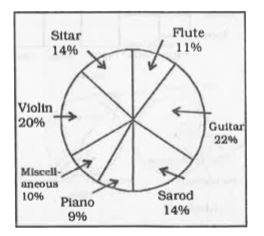
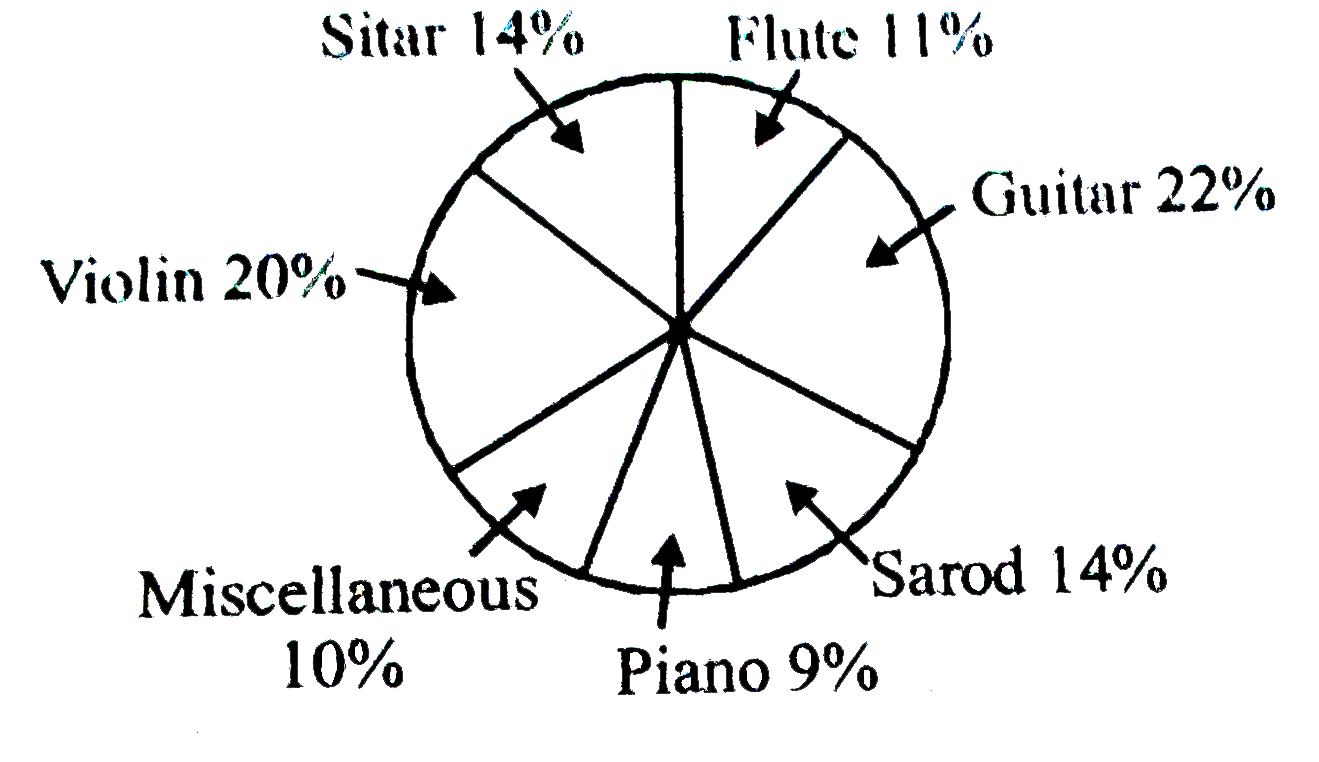
If the following pie-chart shows the preference of musical instruments of 60,000 people surveyed over wholw India.
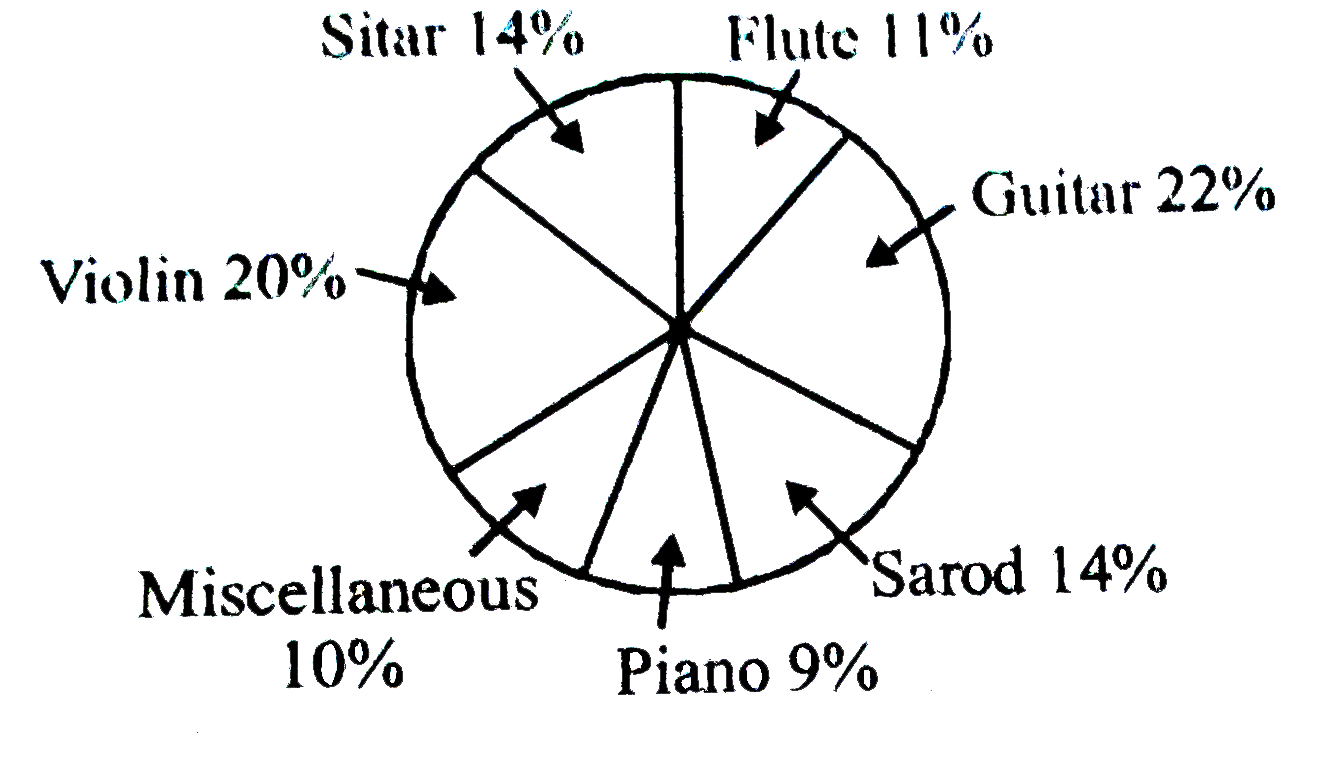
If 2100 opeople be less from the number of people who prefer Flute, the percentage og people who prefer Flute would have been :
3.5%
6.5%
7.5%
8.5%
The correct Answer is:C
No. of people who prefer flute =11% of 60,000
=11100×60000=6600
2100 people be less from the people who prefer flute. Therefore, 6600-2100=4500
Required percentage =450060000×(100)=7.5%
Topper's Solved these Questions
Similar Questions
If the following pie-chart shows the preference of musical instruments of 60,000 people surveyed over wholw India.
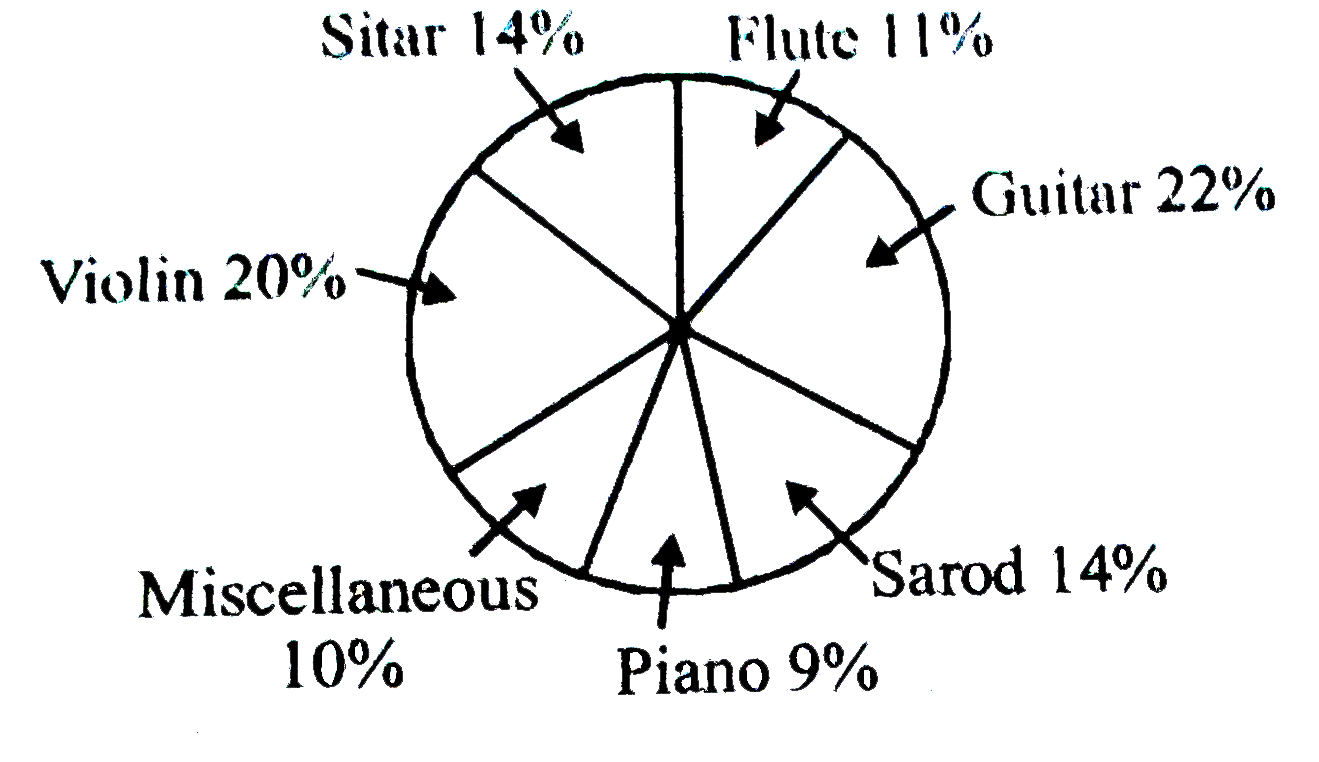
If 1623% of the people who prefer Piano, would go with the people wo prefers Flute. the percentage of people who prefer Fluter would have been :
View SolutionIf the following pie-chart shows the preference of musical instruments of 60,000 people surveyed over wholw India.
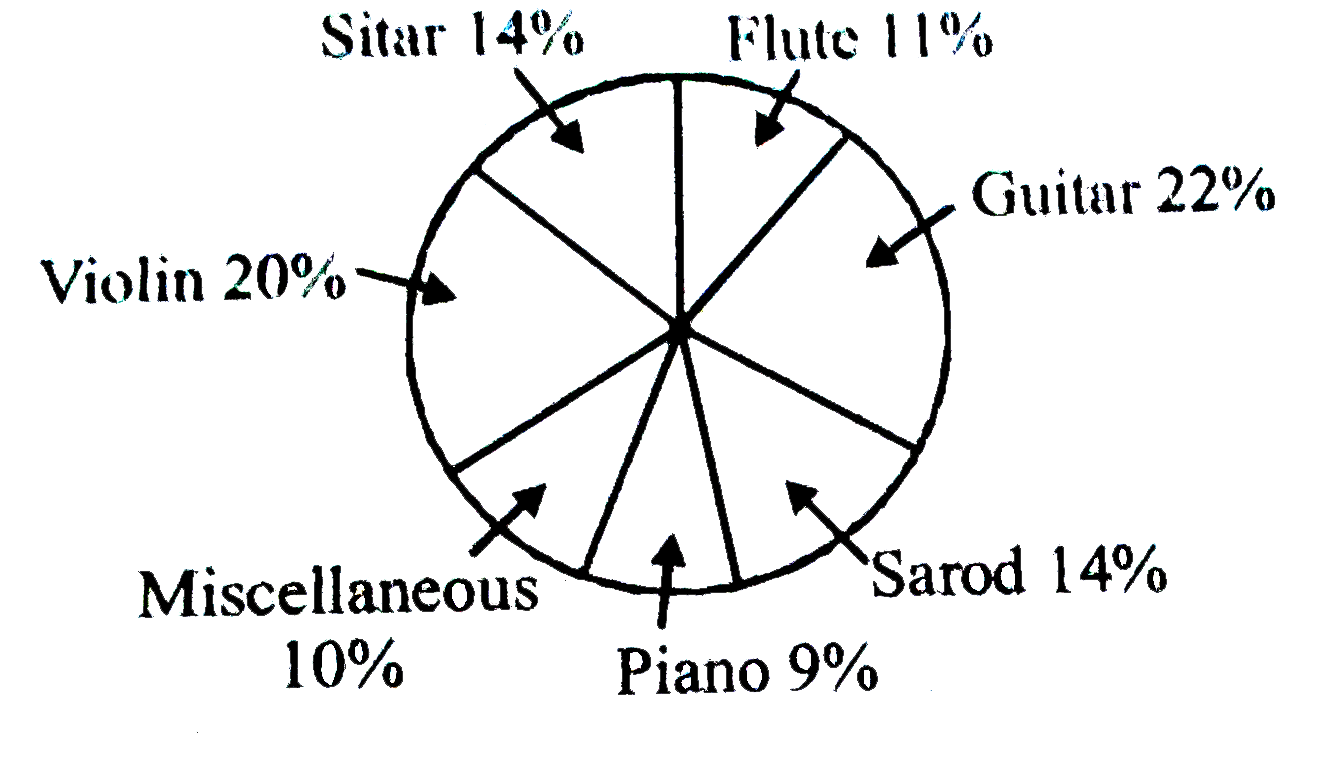
The number of people who prefer the musical instruments Sarod is :
View Solution
Knowledge Check
The following pie-chart shows the preference of musical instruments of 60,000 people surveyed over whole India. Examine the chart and answer the questions.
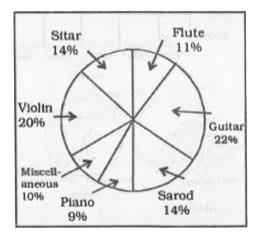
The number of people who prefer Guitar is greater than the total number of people who prefer either Flute or Piano by :A1200B1100C1300D1400The following pie-chart shows the preference of musical instruments of 60,000 people surveyed over whole India. Examine the chart and answer the questions.
If 1623% of the people who prefer Piano, would go with the people who prefer Flute, the percentage of people who prefer Flute would have beenA13.5%B14.5%C15.5%D12.5%
If the following pie-chart shows the preference of musical instruments of 60,000 people surveyed over wholw India.
The number of people who prfer Guitar is greater than the total number of people who prefer either Flute of Piano by :
View SolutionThe following pie-chart shows the preference of musical instruments of 60,000 people surveyed over whole India. Examine the chart and answer the questions.
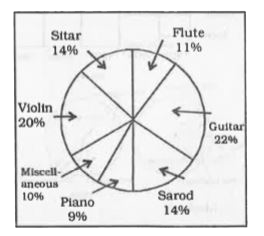
The number of people who prefer the musical instrument Sarod is :
View SolutionIf the following pie-chart shows the preference of musical instruments of 60,000 people surveyed over wholw India.
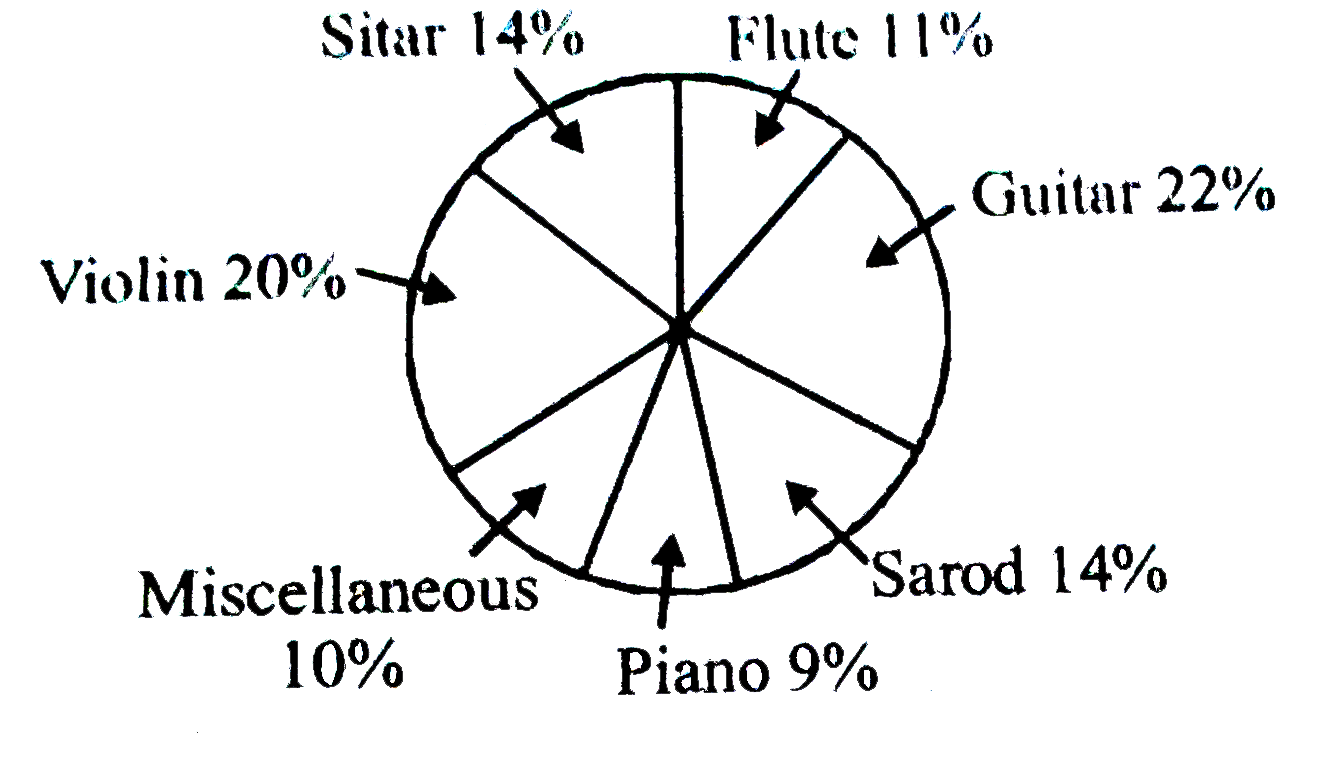
The total number of people prefer either Sarod or Guitar, is greater than the total number of popole who prefer either Violin or Sitar by :
View SolutionThe following pie-chart shows the preference of musical instruments of 60,000 people surveyed over whole India. Examine the chart and answer the questions.
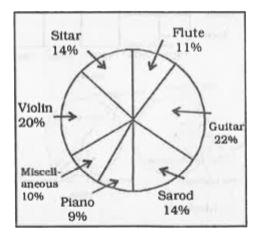
The total number of people who prefer either Sarod or Guitar, is greater than the total number of people who prefer either Violin or Sitar by :
View SolutionThe Pie-chart shows the result of a survey among 119060 people concerning the use of tobacco. Study the Pie-chart and answer the questions.
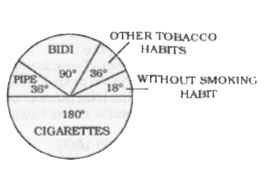
The number of people preferring Bidi is :
View SolutionGiven below is a pie chart depicting the reason given by people who had injured their lower back.
If the number of people surveyed is doubled, would the number of people who injured their back by bending and lifting also be doubled?
View Solution
