No. of students and % of students passed out of those who appeared are given for two subjects from year 2011 to 2015 in a college XYZ.
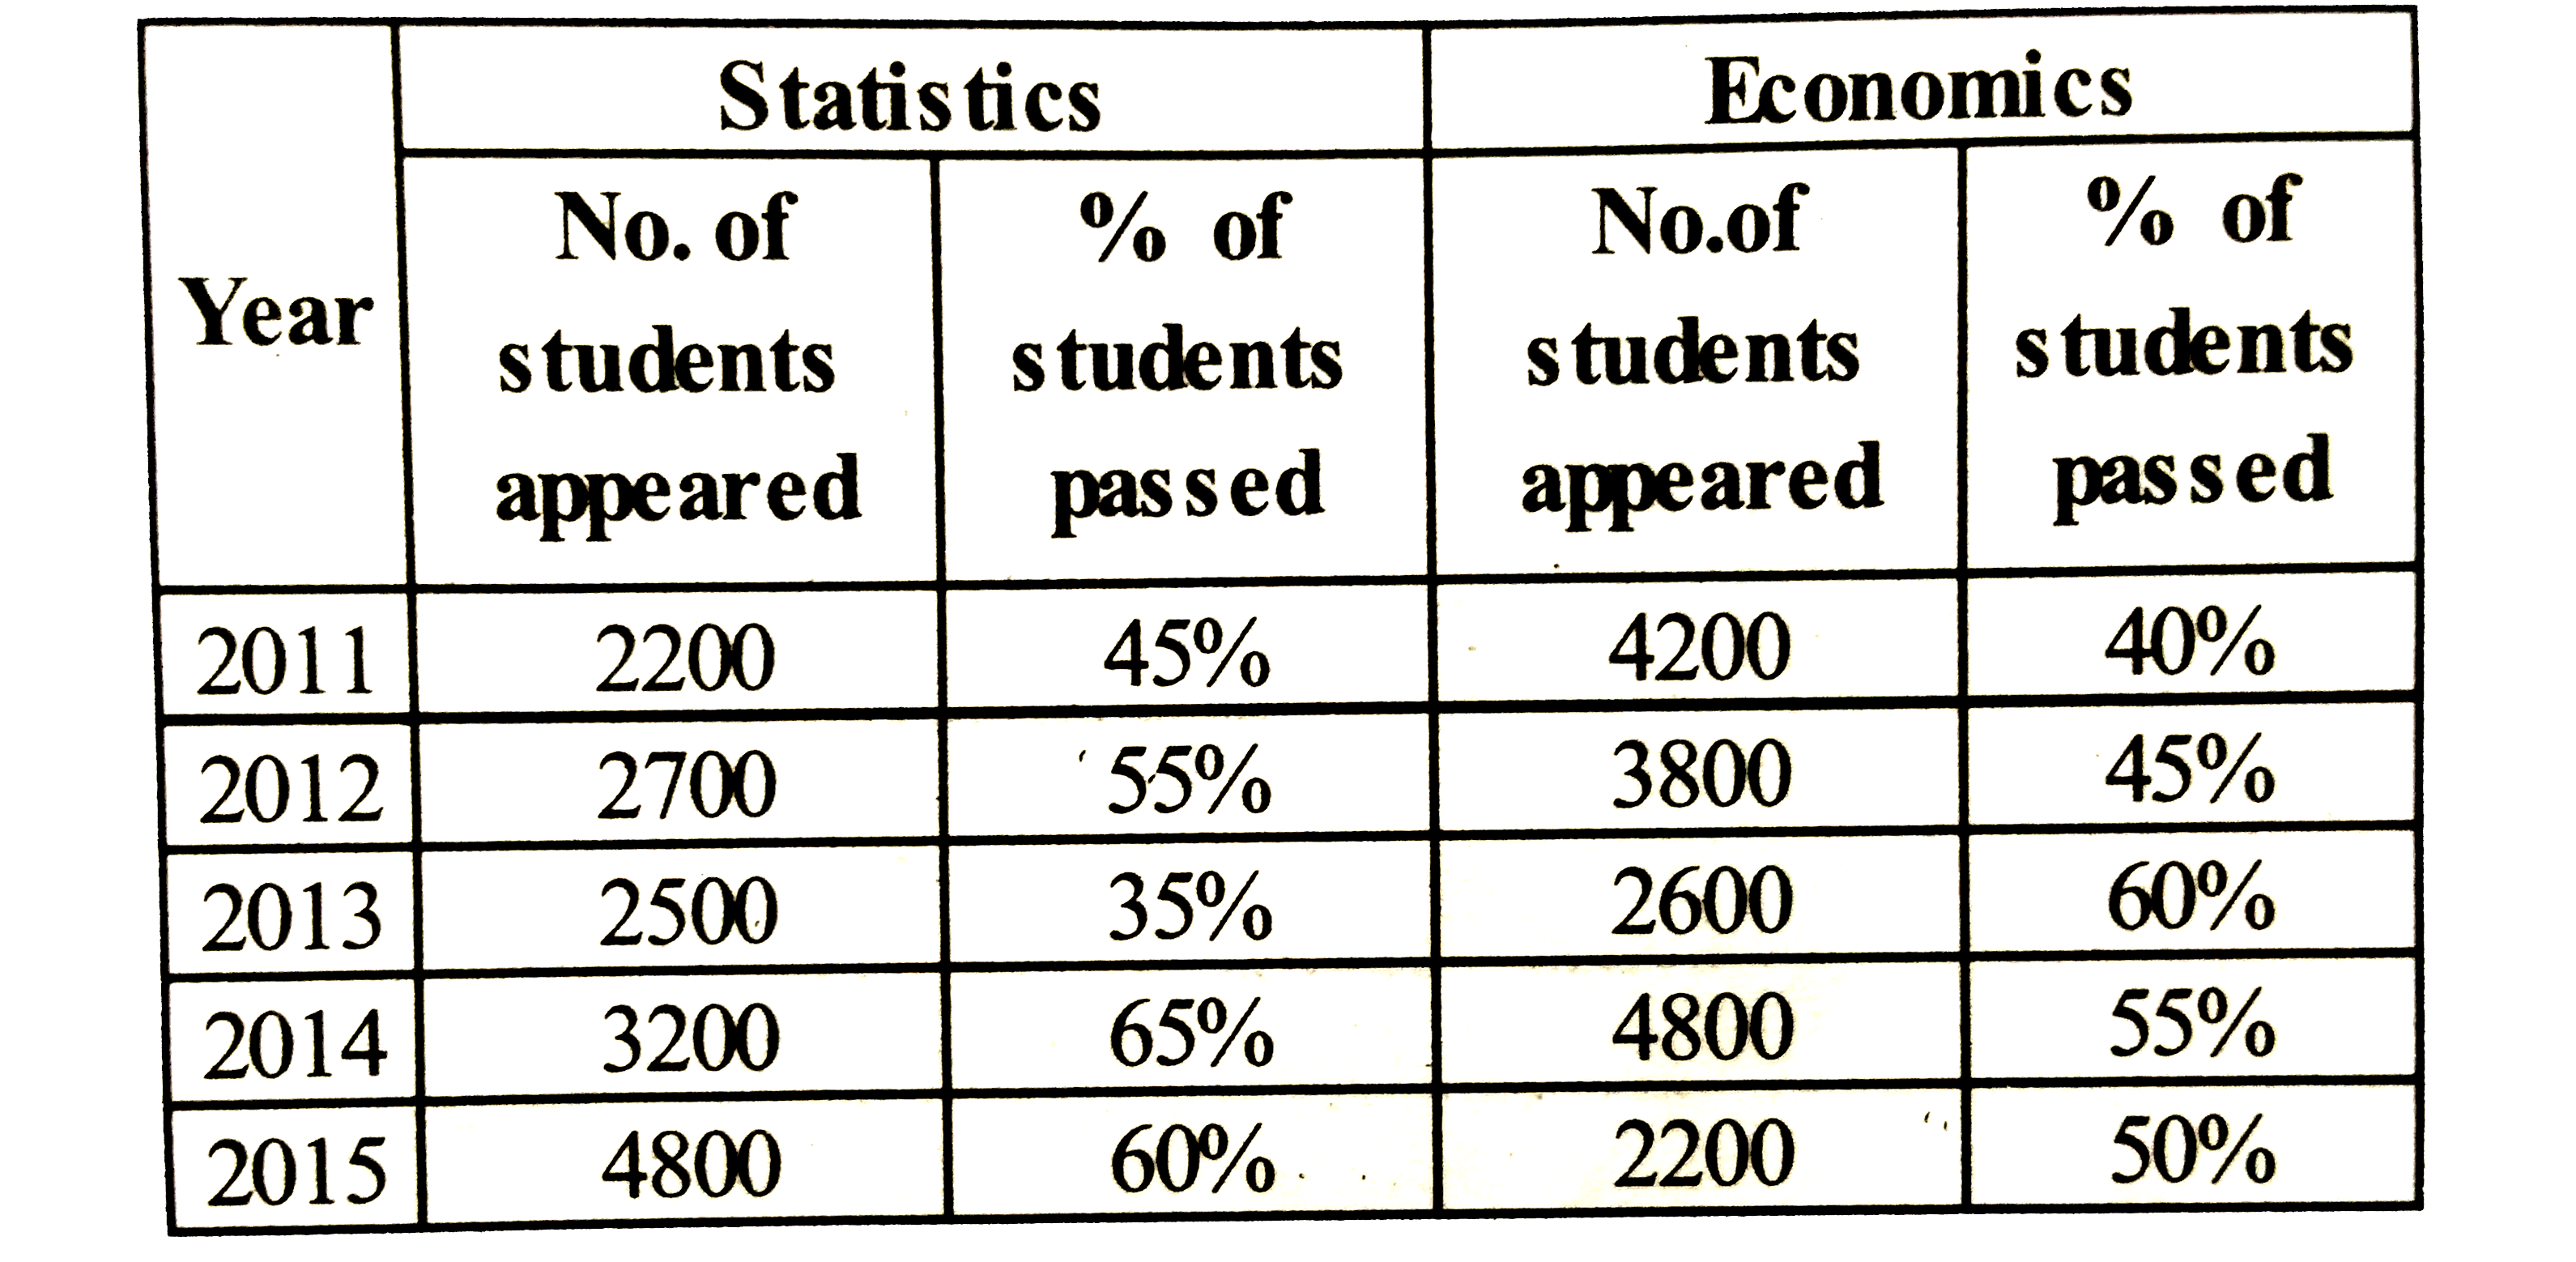
Find the average number of studetns who were failed in Economics in year 2012 and year 2013 together ?
1435
1565
1720
1590
The correct Answer is:B
According to question,
No. of stuedens failed in Satistics in year 2013
=100−35100×3800=2090
No. of students, faild in Economics in year 2013
(100−60)100×2600=1040
Required average =2090+10402=1565
Topper's Solved these Questions
Similar Questions
No. of students and % of students passed out of those who appeared are given for two subjects from year 2011 to 2015 in a college XYZ.
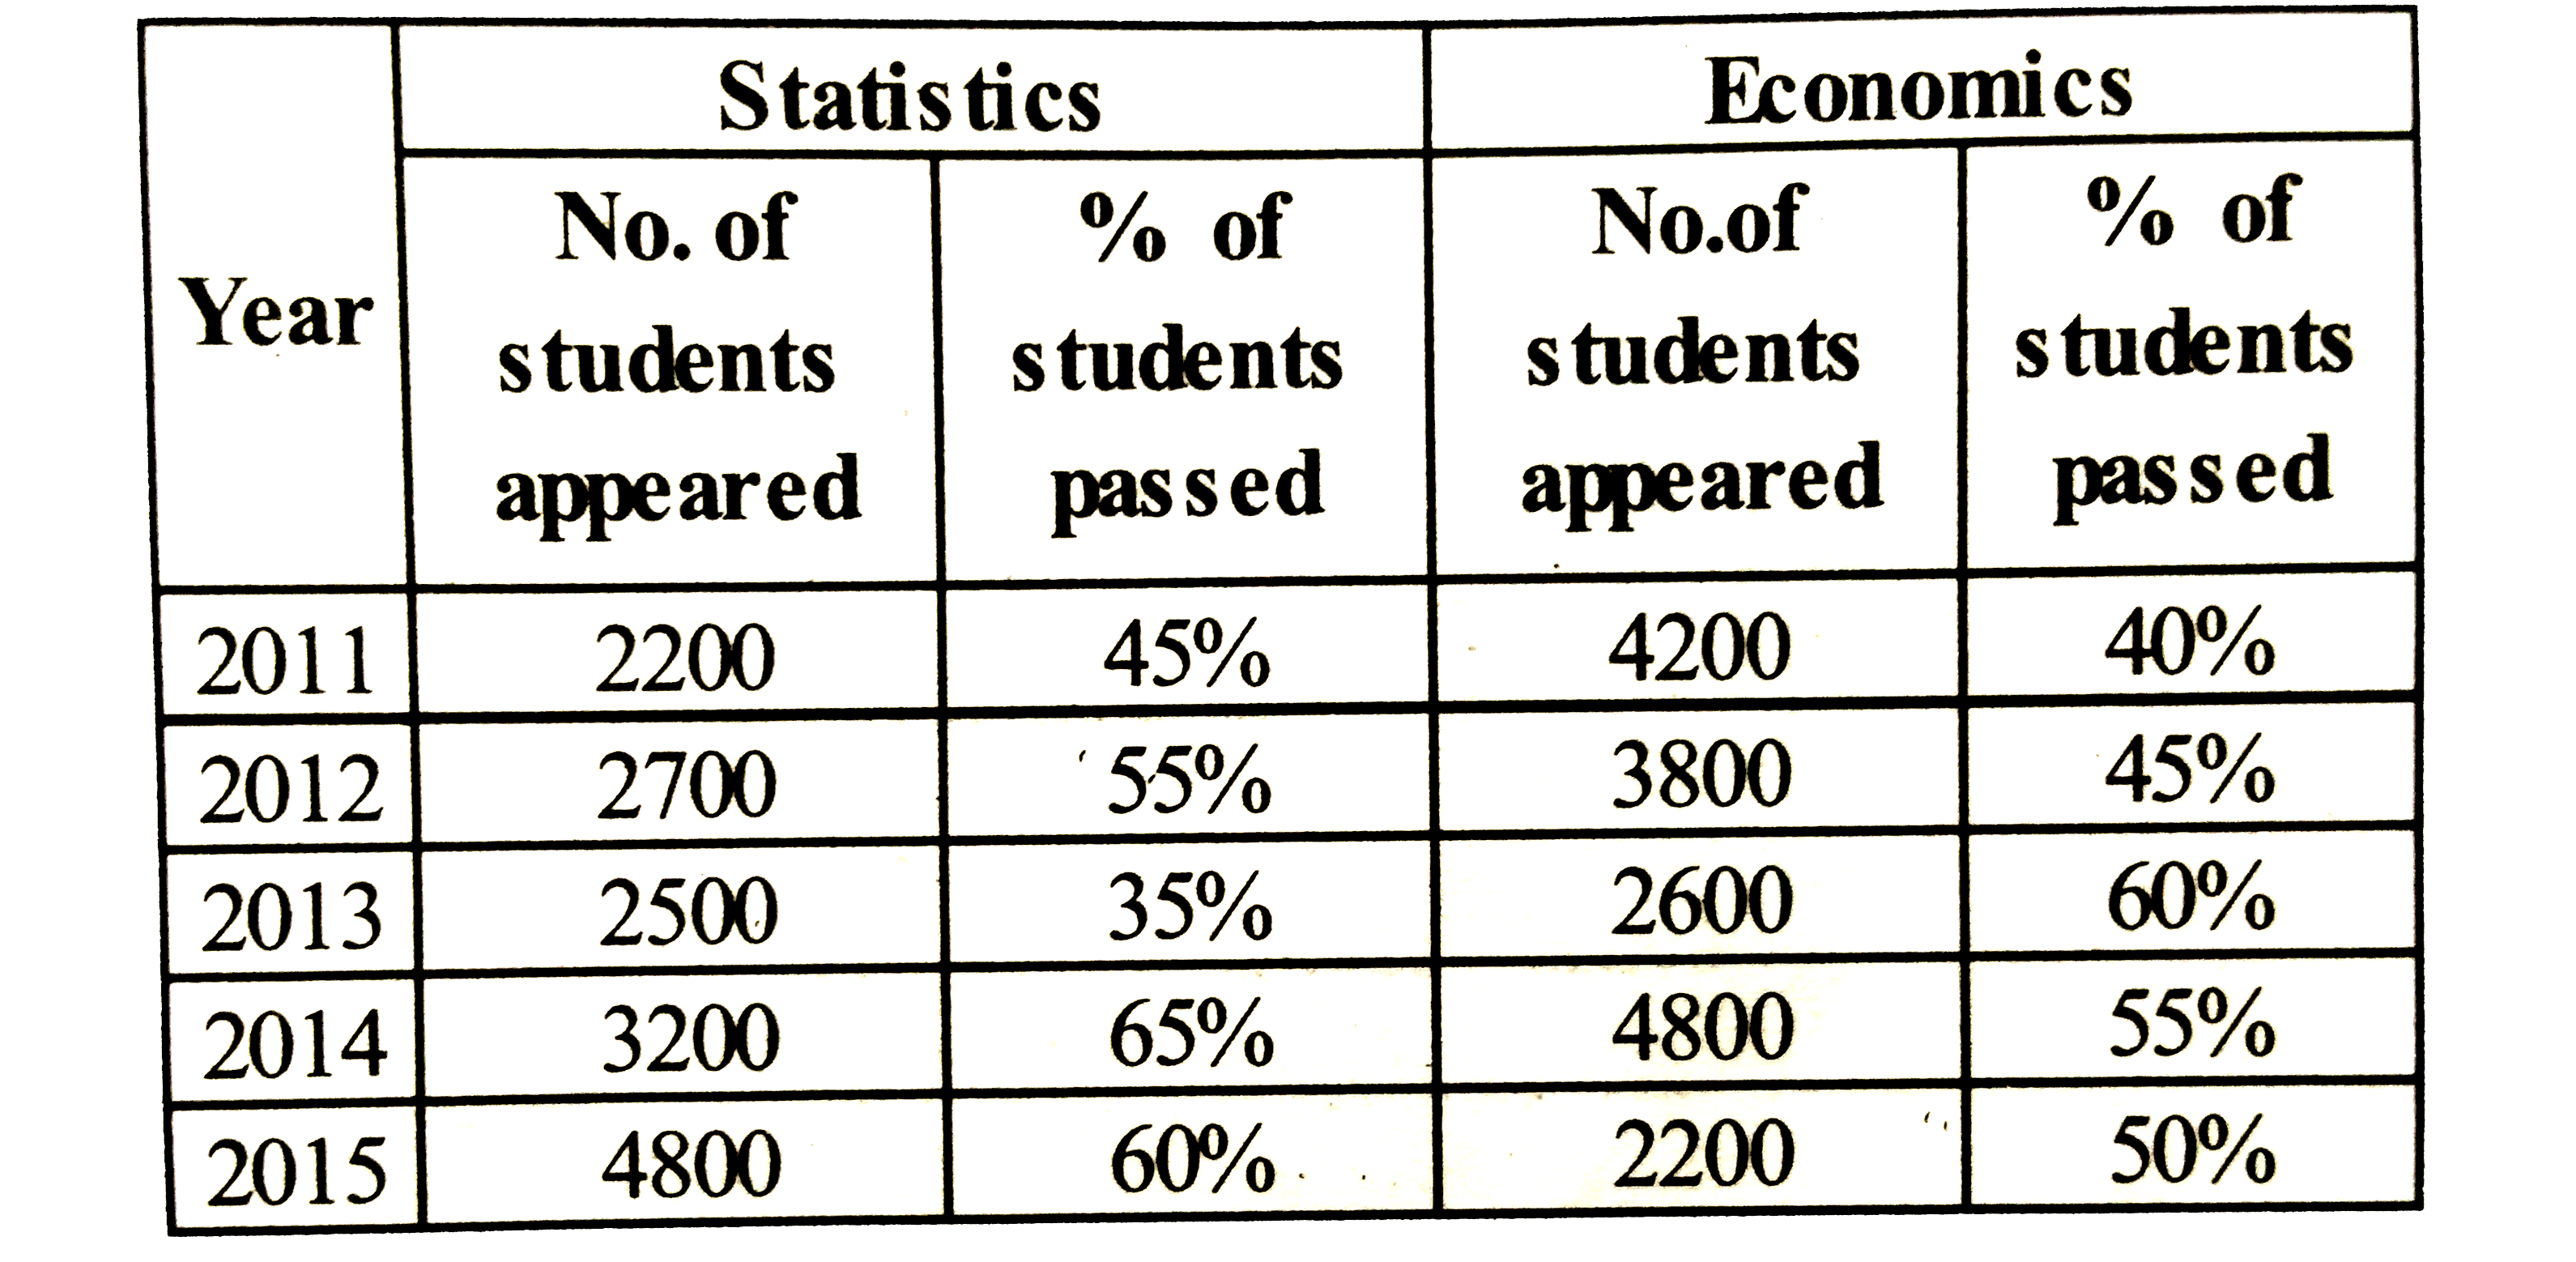
Find the avearage number of students appeared in Economics from year 2011 to 2014 together ?
View SolutionNo. of students and % of students passed out of those who appeared are given for two subjects from year 2011 to 2015 in a college XYZ.
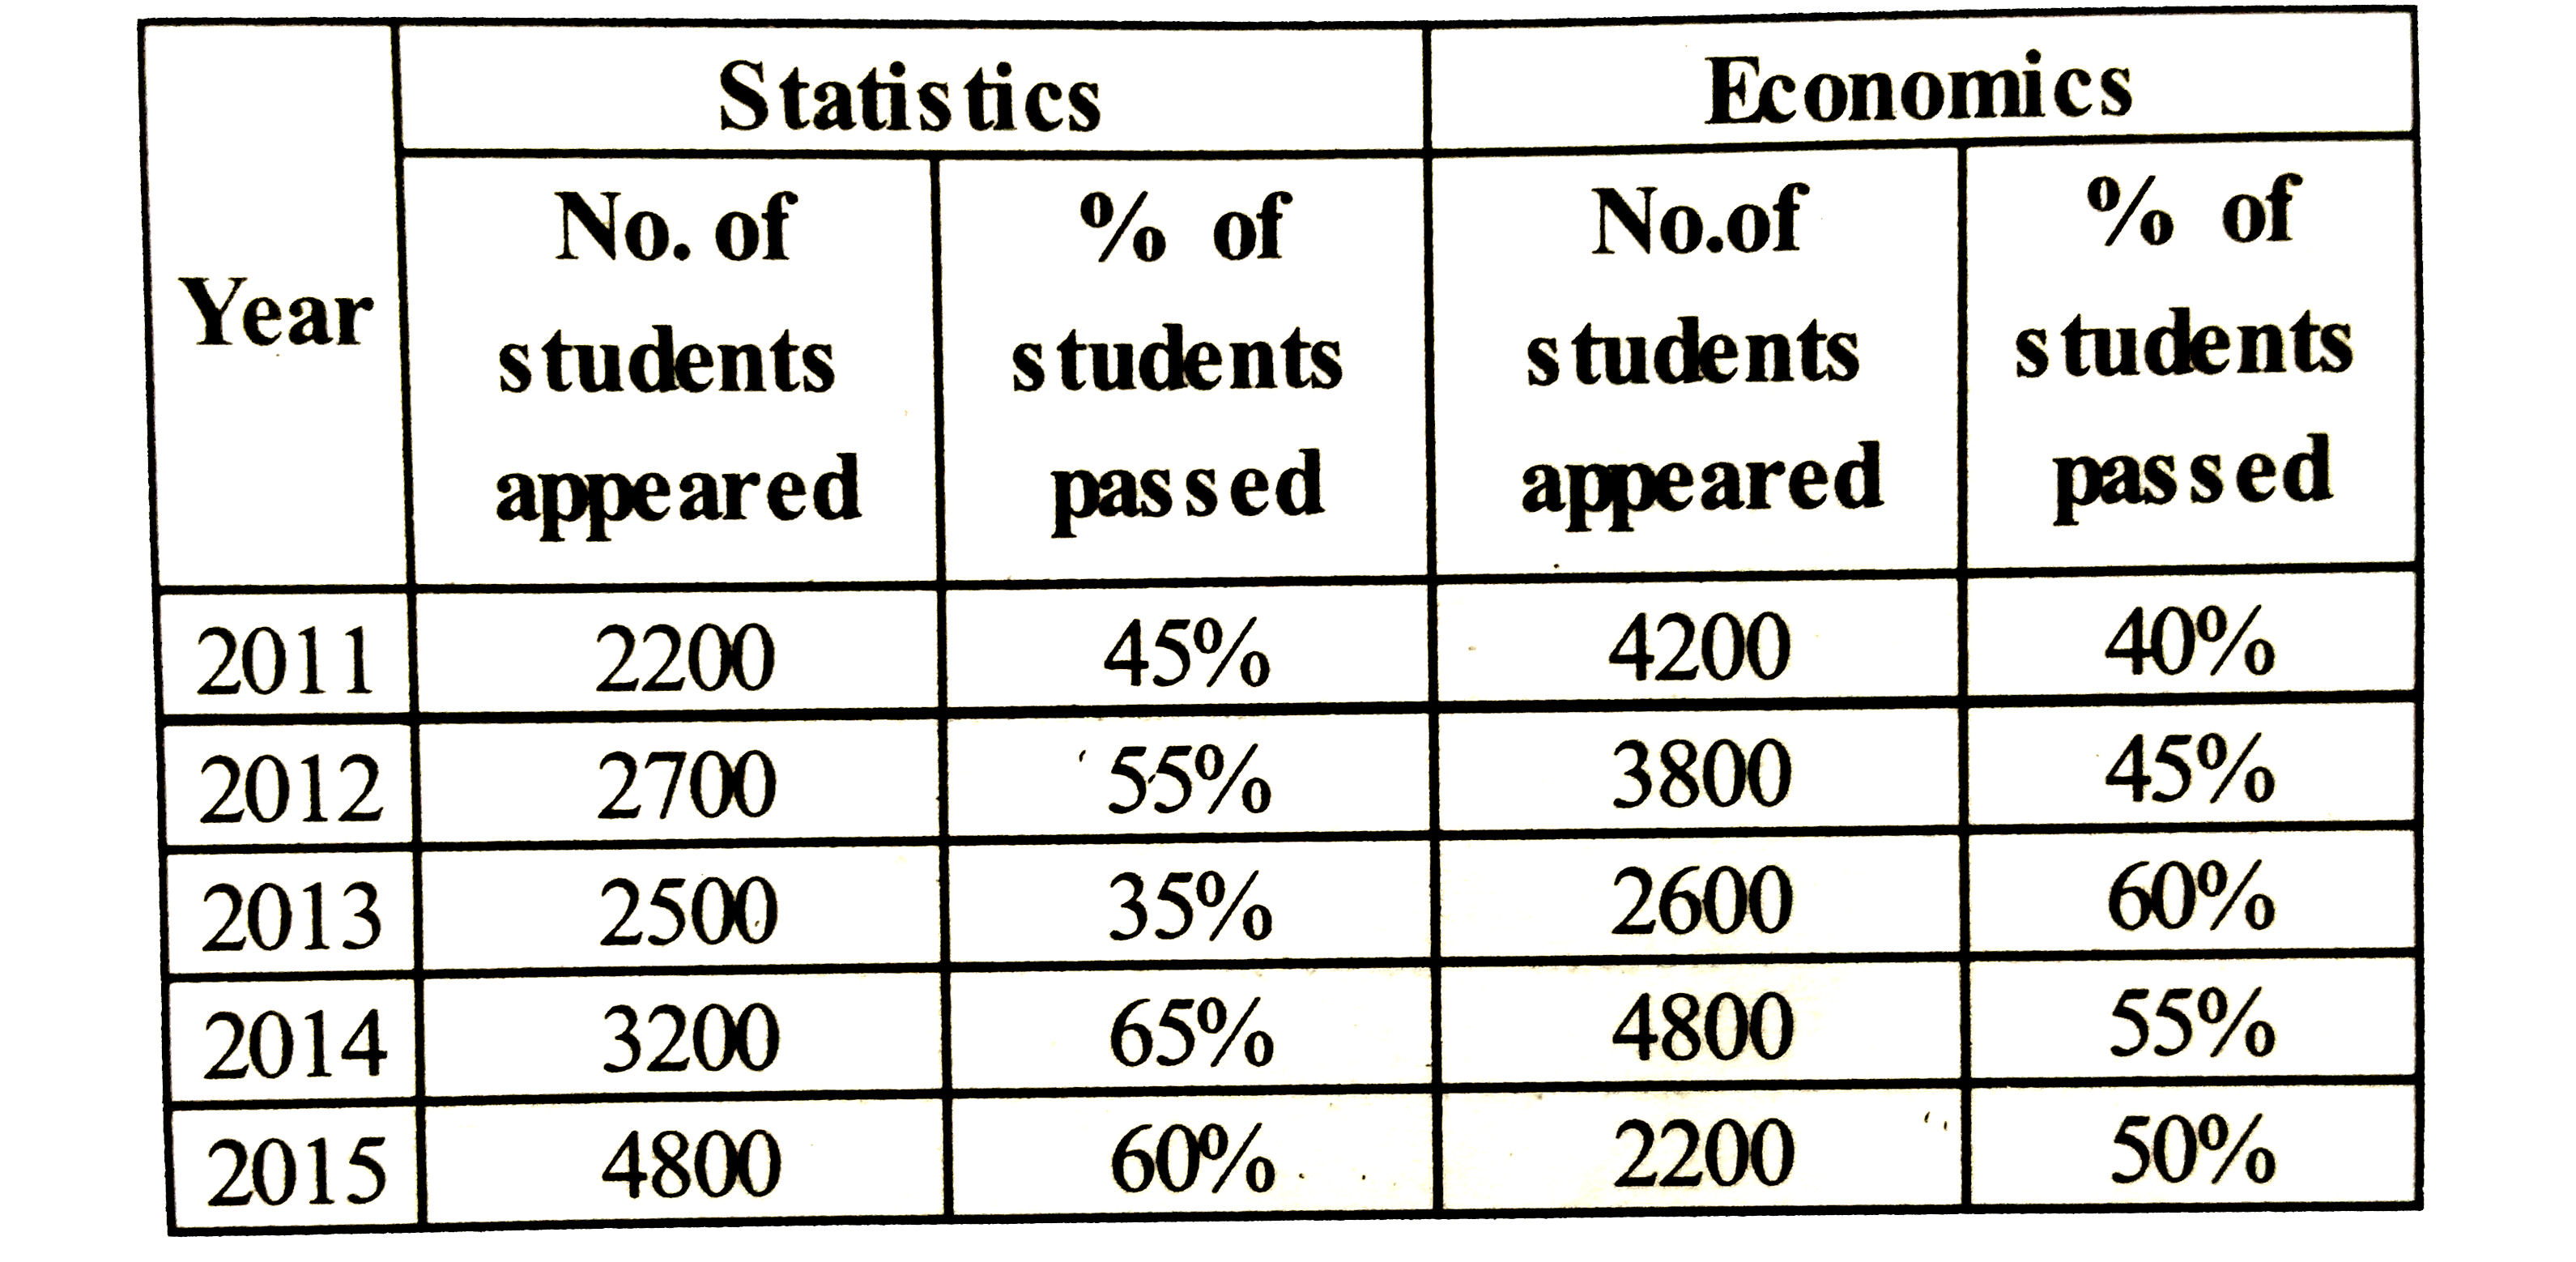
Find the ratio between the total number of students appeared in Economics from 2012 to 2014 togeter and the total number of students appeared in Satistics from year 2013 to 2015 together ?
View Solution
Knowledge Check
What is the approximate percentage of students passed during five academic years
A0.28B0.27C0.21D0.22The table given below shows the number of students admitted in 2 sections X and Y from year 2011 to 2015.
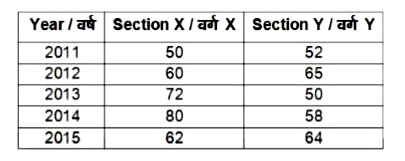
What is the percentage change in the number of students admitted in section X from year 2011 to 2013?A22B50C44D72The table given below shows the number of students admitted in 2 sections X and Y from year 2011 to 2015.
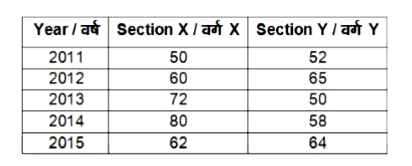
What is the percentage change in the number of students admitted in section Y from year 2011 to 2014?A13.81B11.54C6D58
No. of students and % of students passed out of those who appeared are given for two subjects from year 2011 to 2015 in a college XYZ.
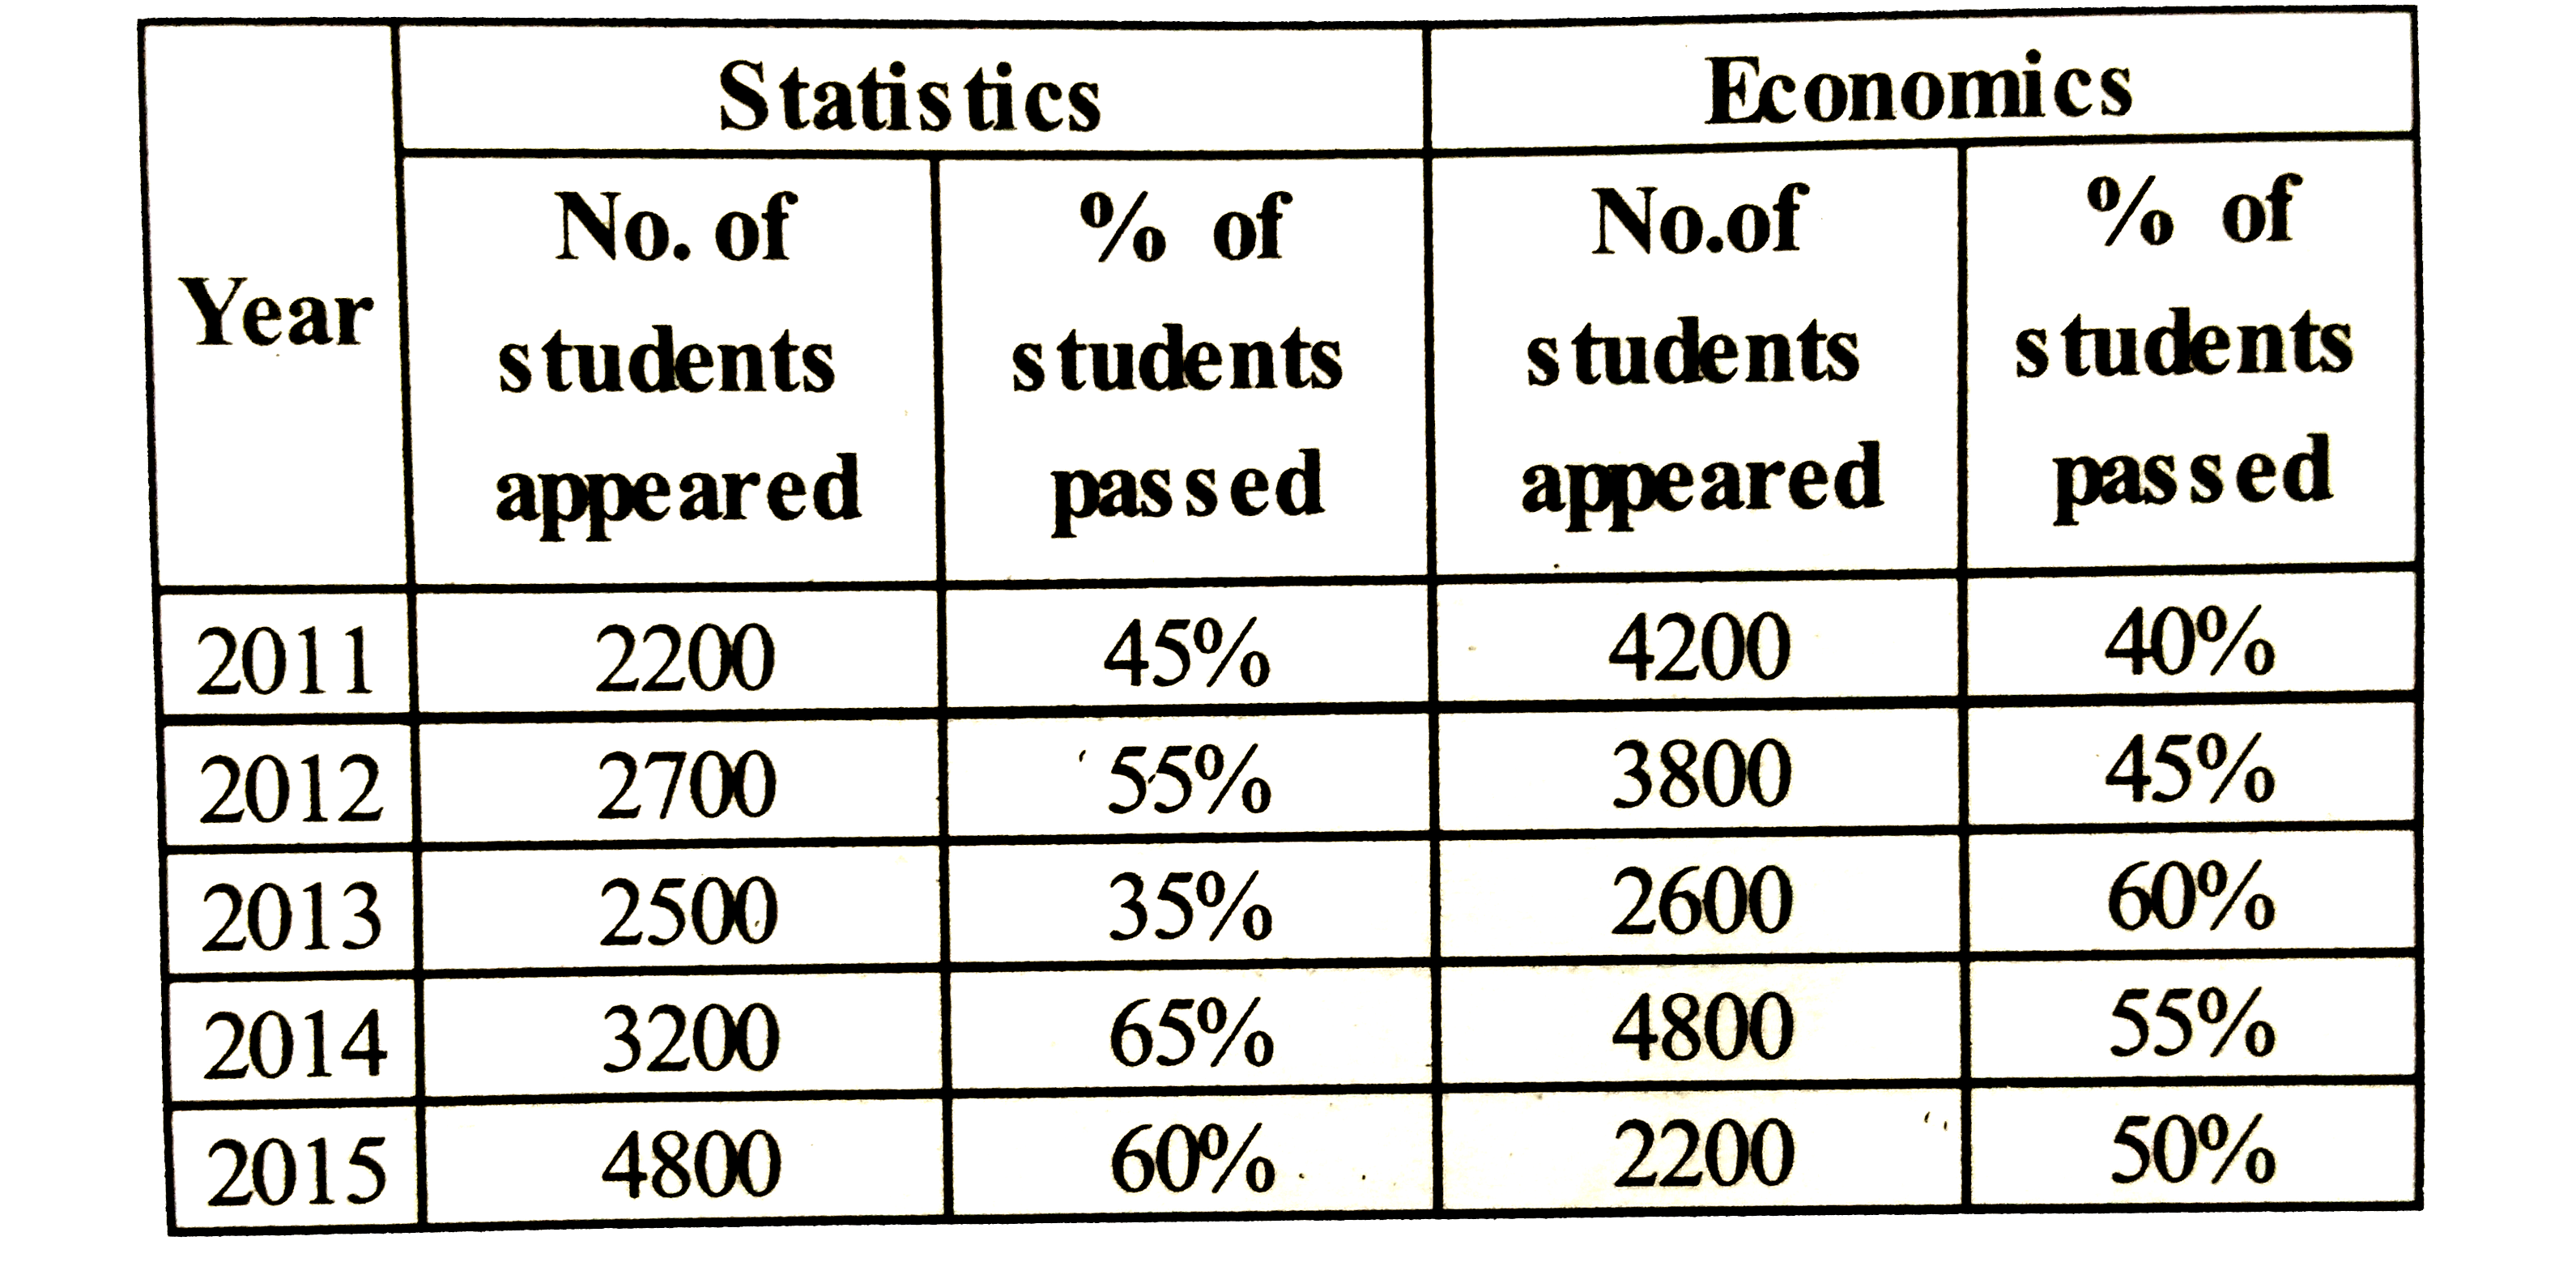
Find the difference between the total number of studetns passed in Statistics in year 2012 and total number of students failed in Economics is year 2015.
View SolutionNo. of students and % of students passed out of those who appeared are given for two subjects from year 2011 to 2015 in a college XYZ.
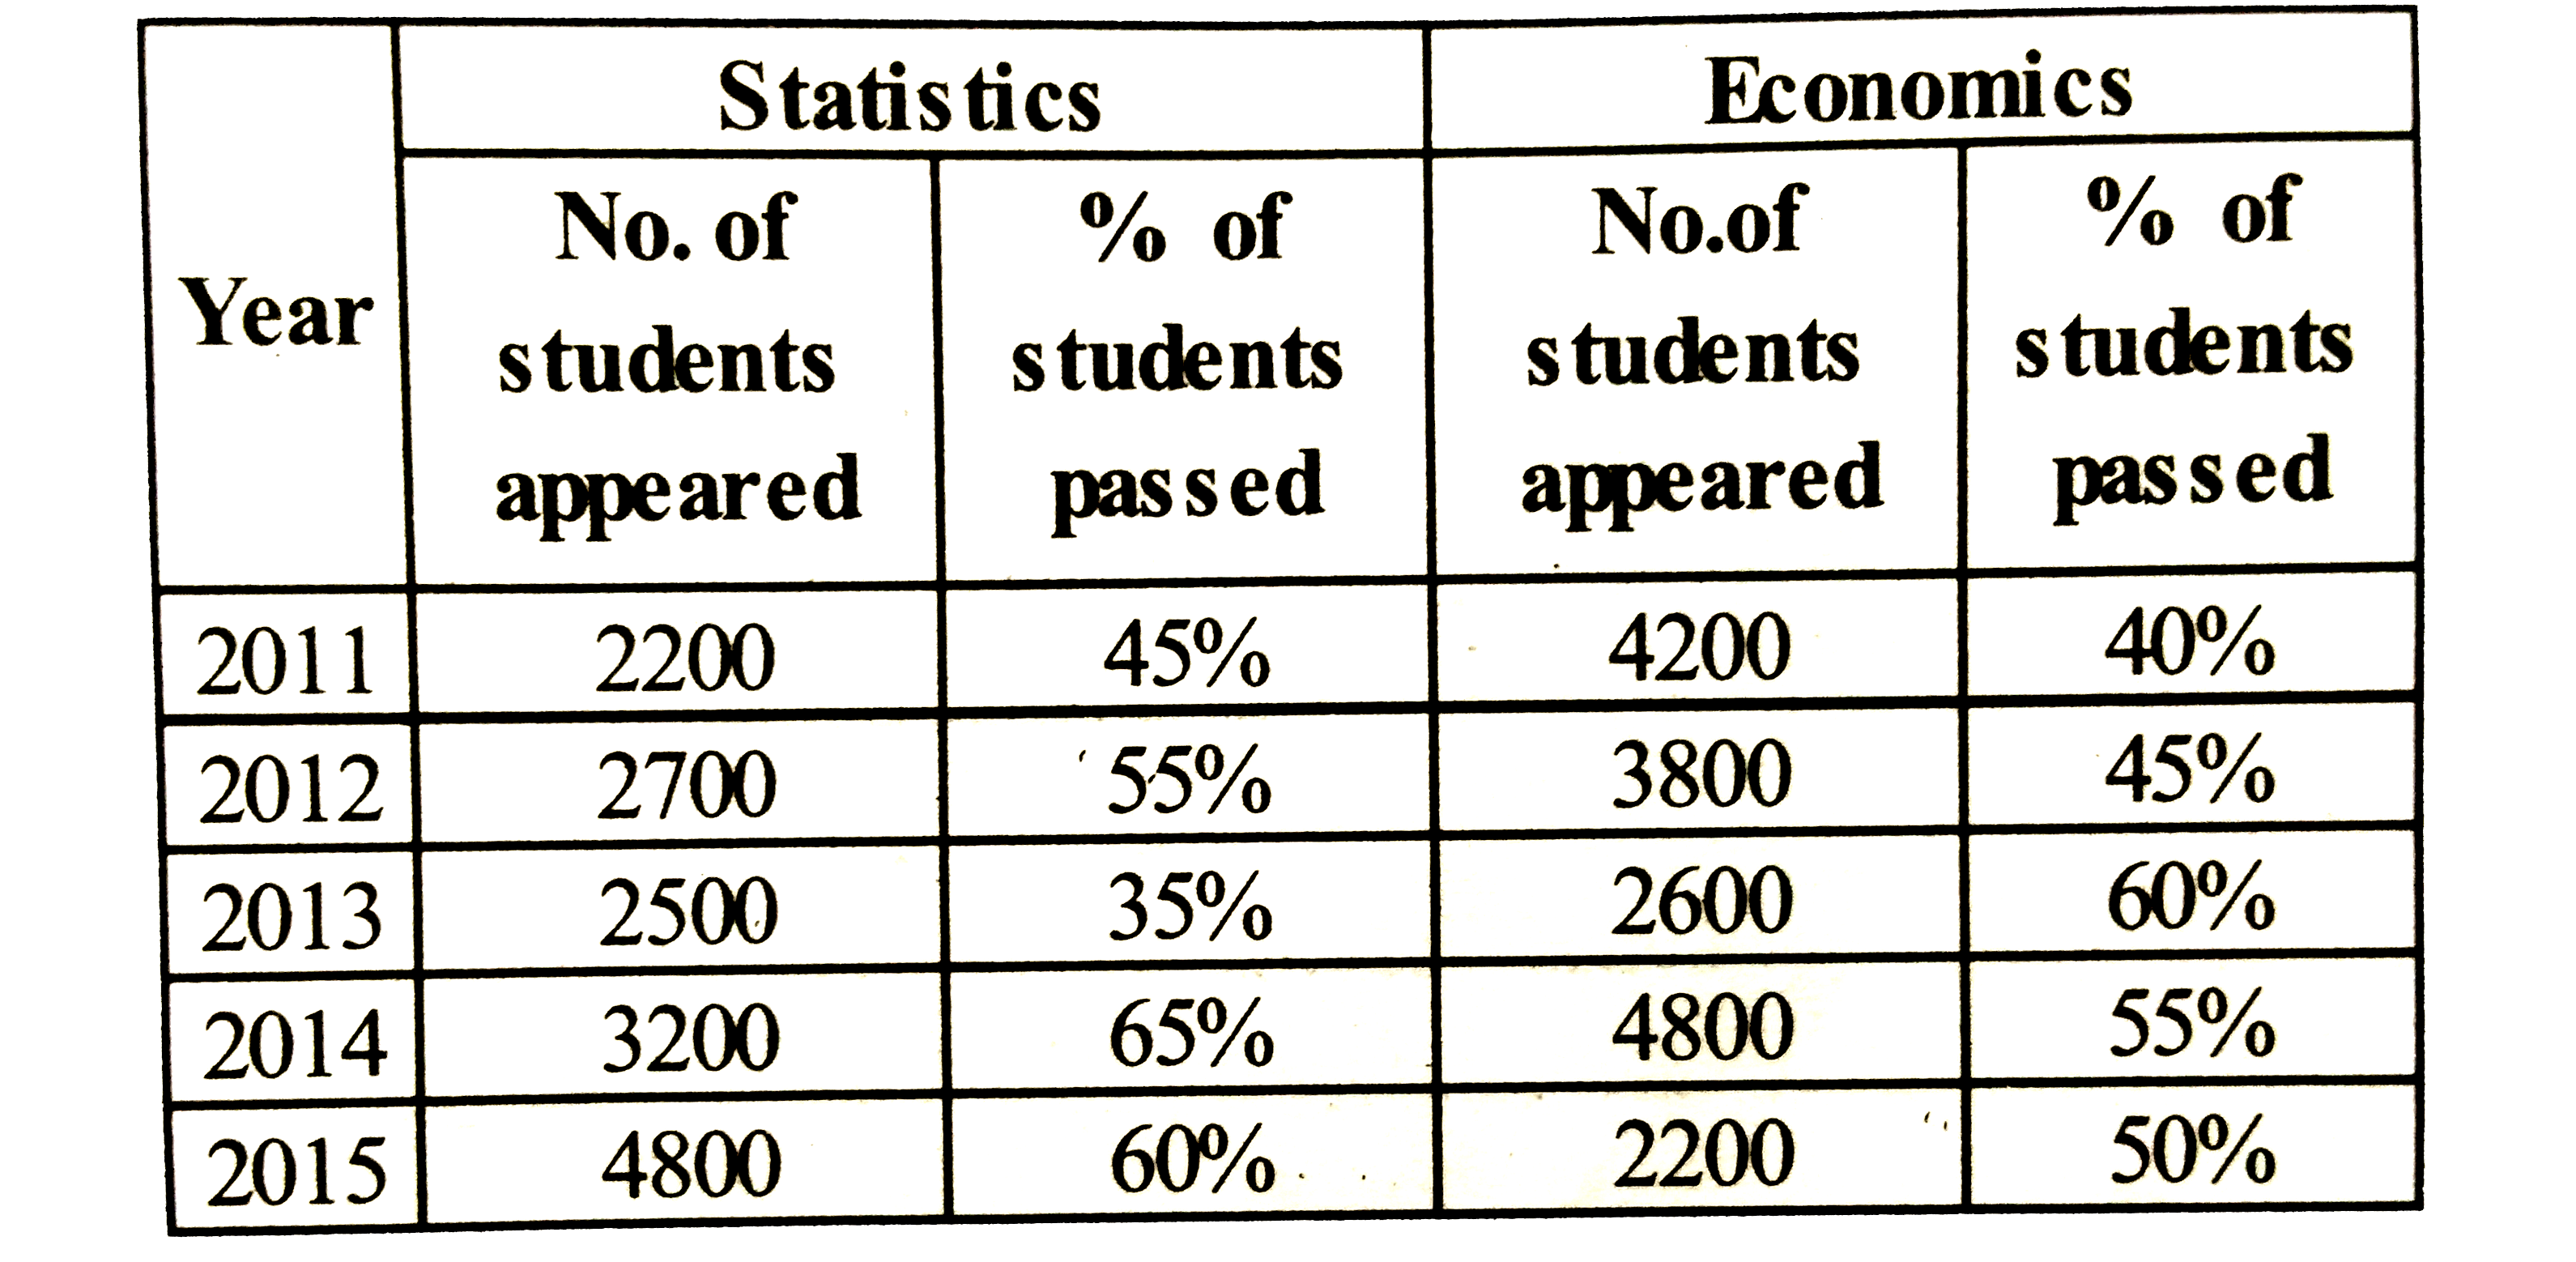
Number of students failed in Statistics in the year 2013 is what % of the number of students failed in Economis in the same year ?
View SolutionThe following bar graph shows the number of students (in hundreds) who have opted for different courses A, B, C and D in 3 years in a college. Study the graph and answer the question.
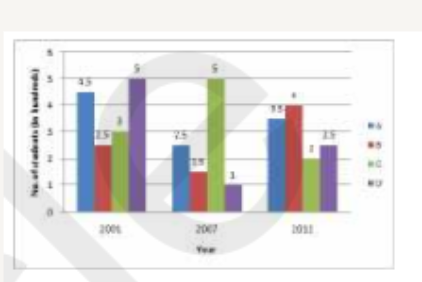 What is the ratio of the number of students who were admitted to course A in the year 2007 to that
of students who were admitted to course C in the year 2012?
View SolutionThe line chart given below shows the number of students in 2 sections X and Y from year 2009 to 2016.
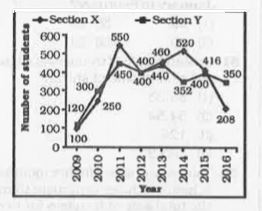
What is the percentage change in the number of students in section Y from year 2011 to year 2015?
View SolutionWhat is the ratio of the number of students passing to those falling from college E in the year 2015?
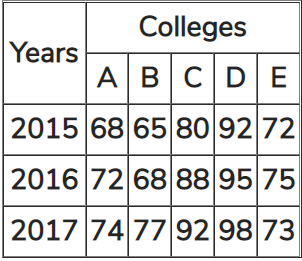
View Solution
