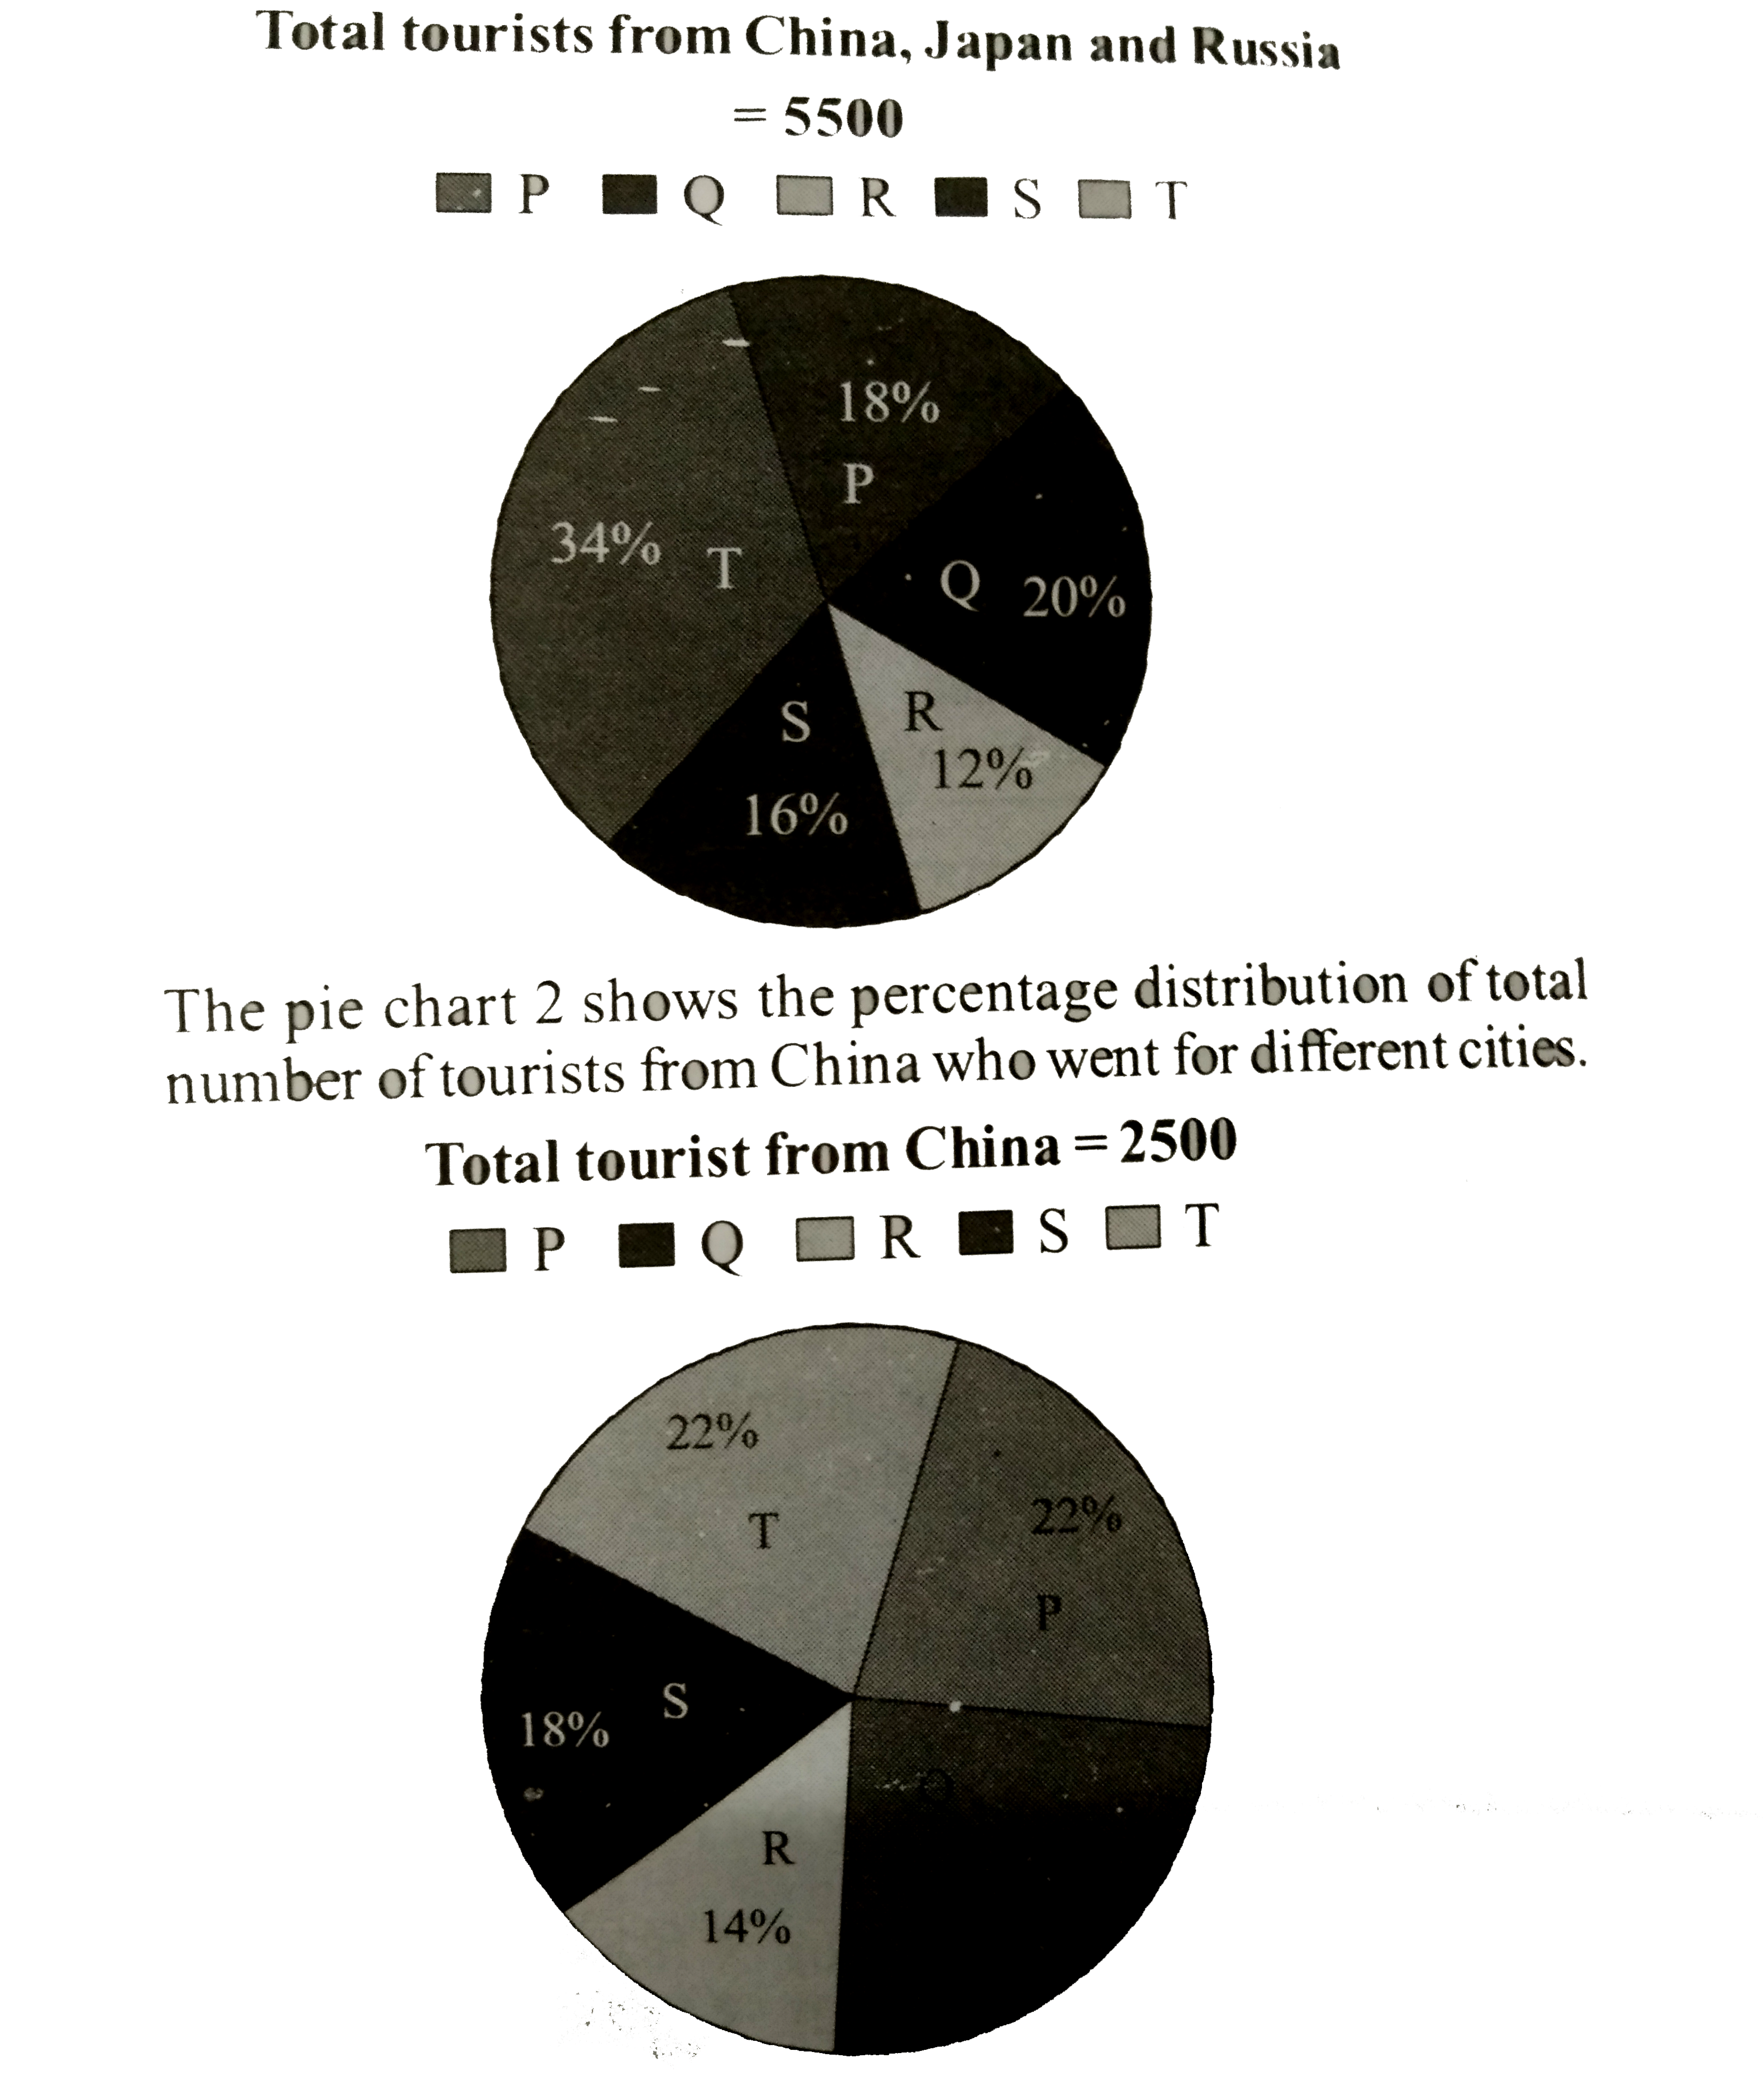
The following pie chart 1 shows the percentage distribution of total number of tourists from China, Japan and Russia who went for different cities.
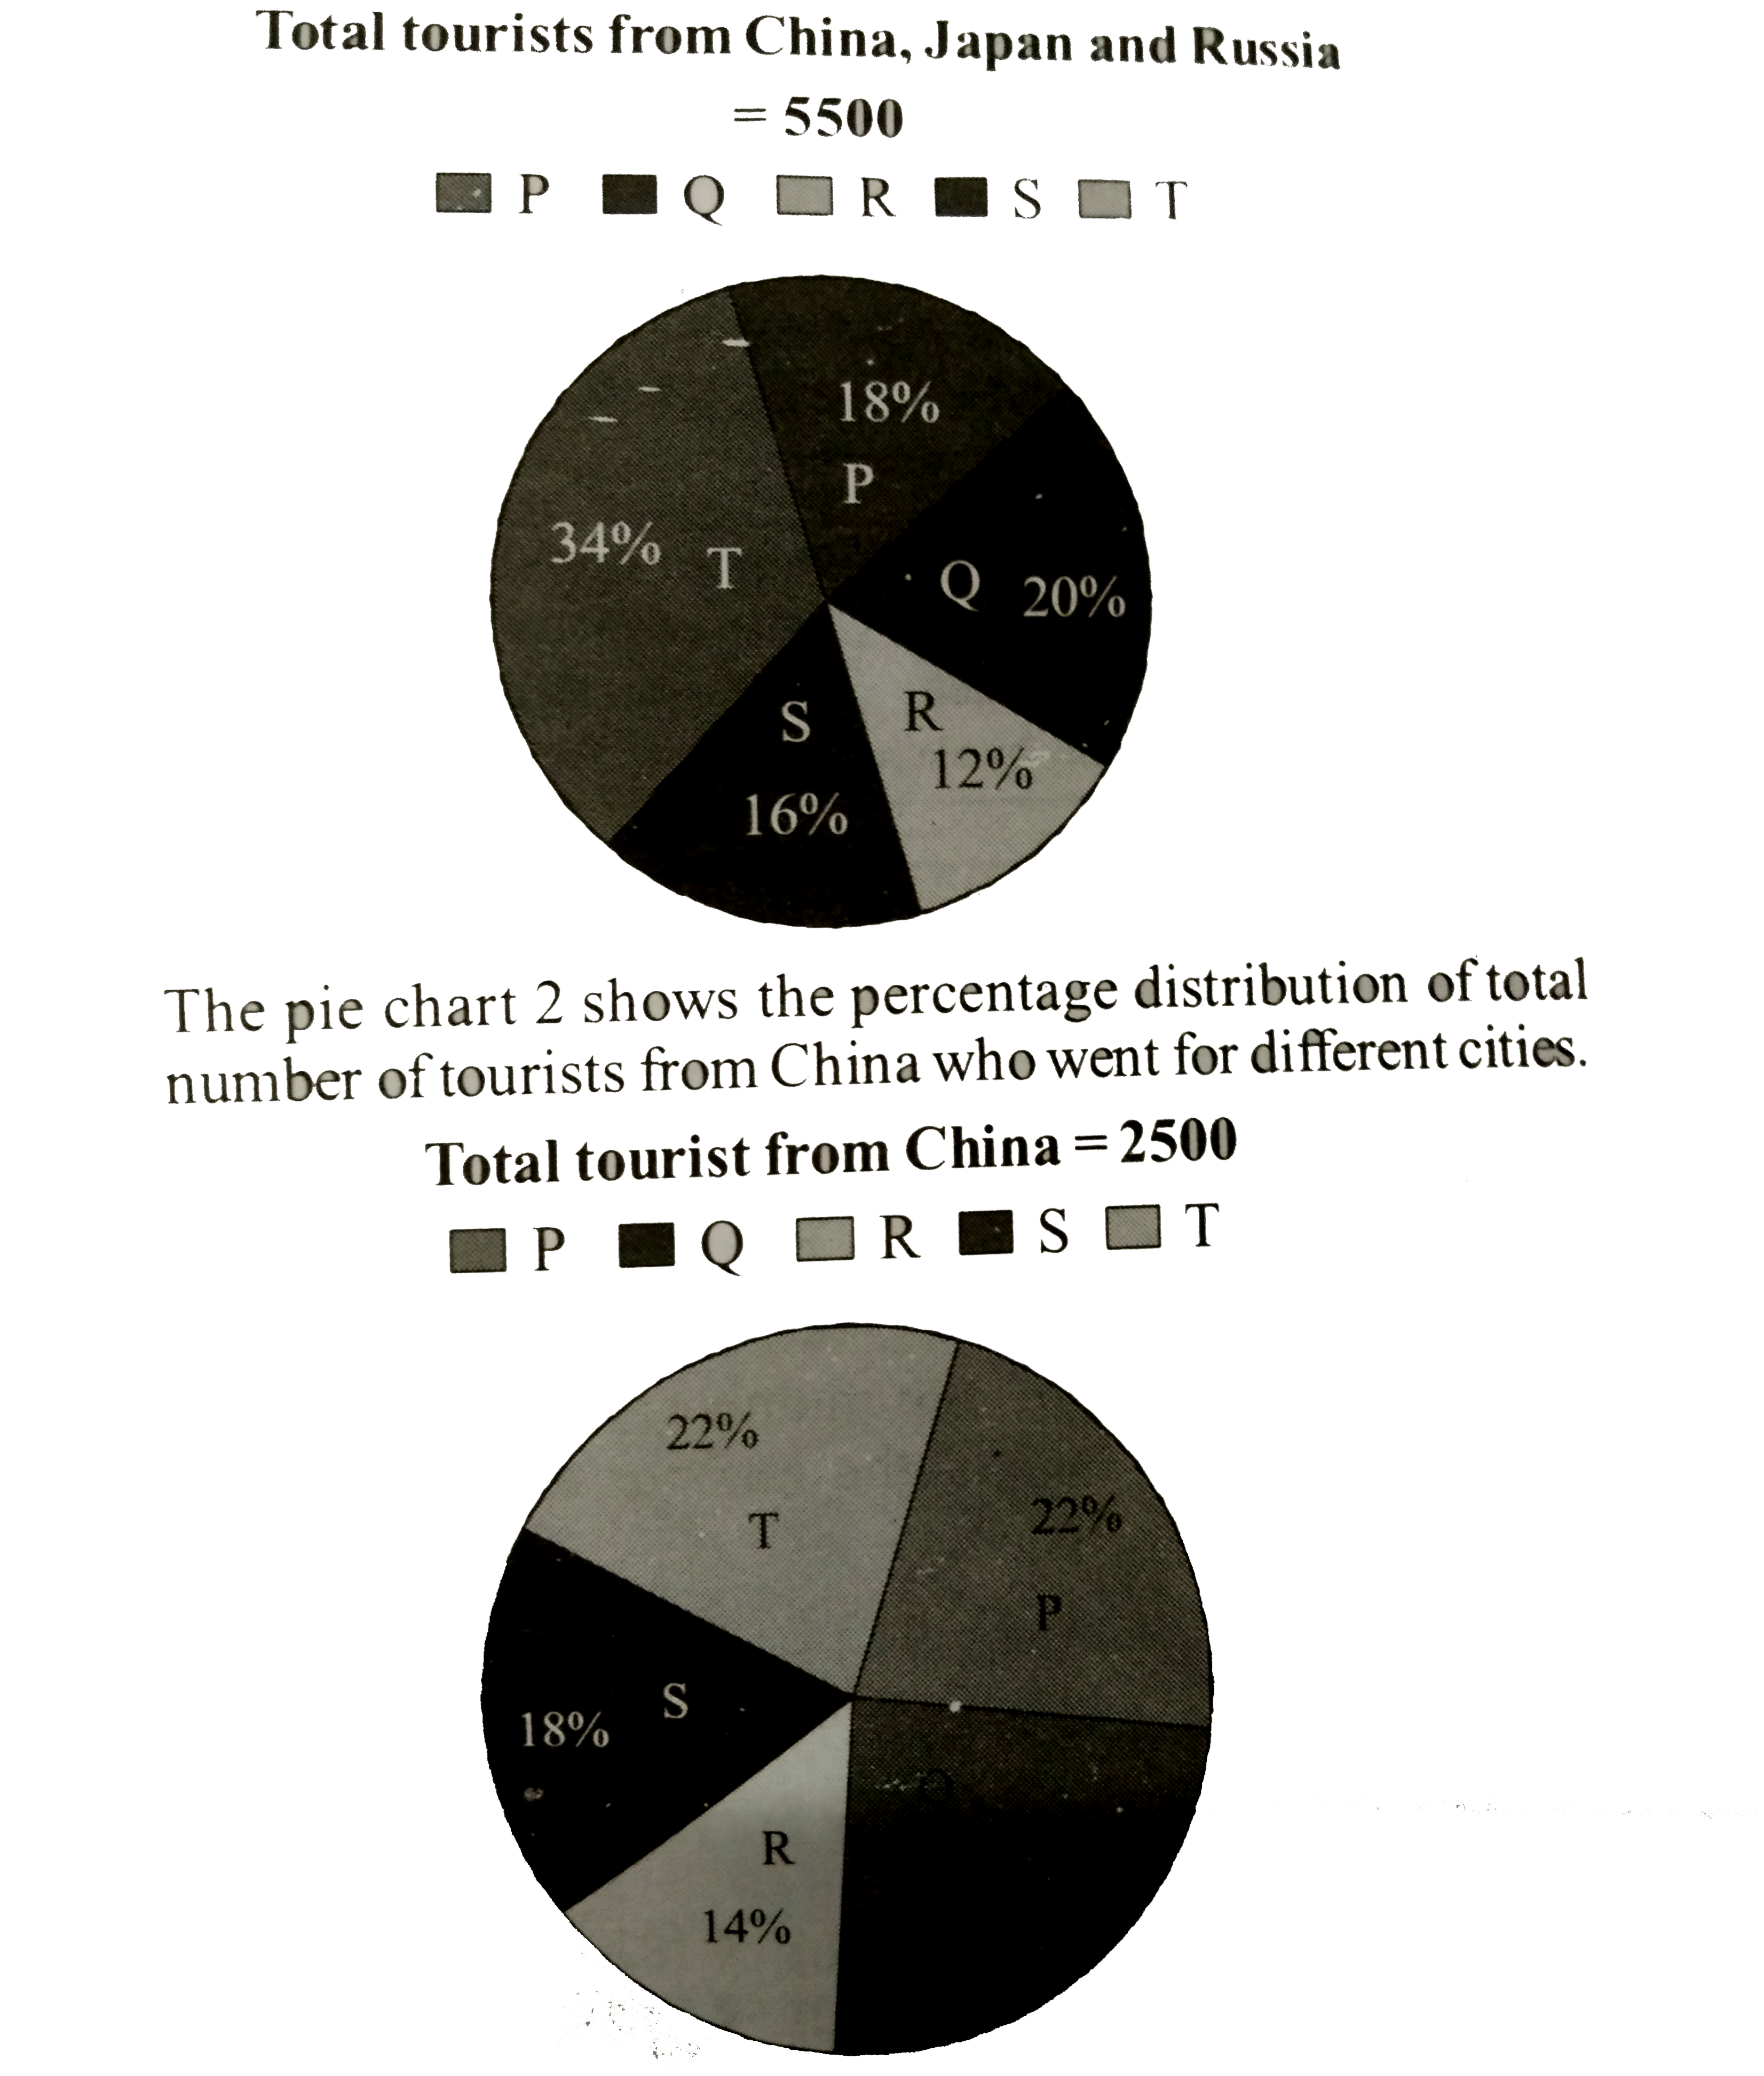
Find the central angle of T of the total tourists ?
The correct Answer is:B
The central angel of T othe totla tourists
Topper's Solved these Questions
Similar Questions
The following pie chart 1 shows the percentage distribution of total number of tourists from China, Japan and Russia who went for different cities.
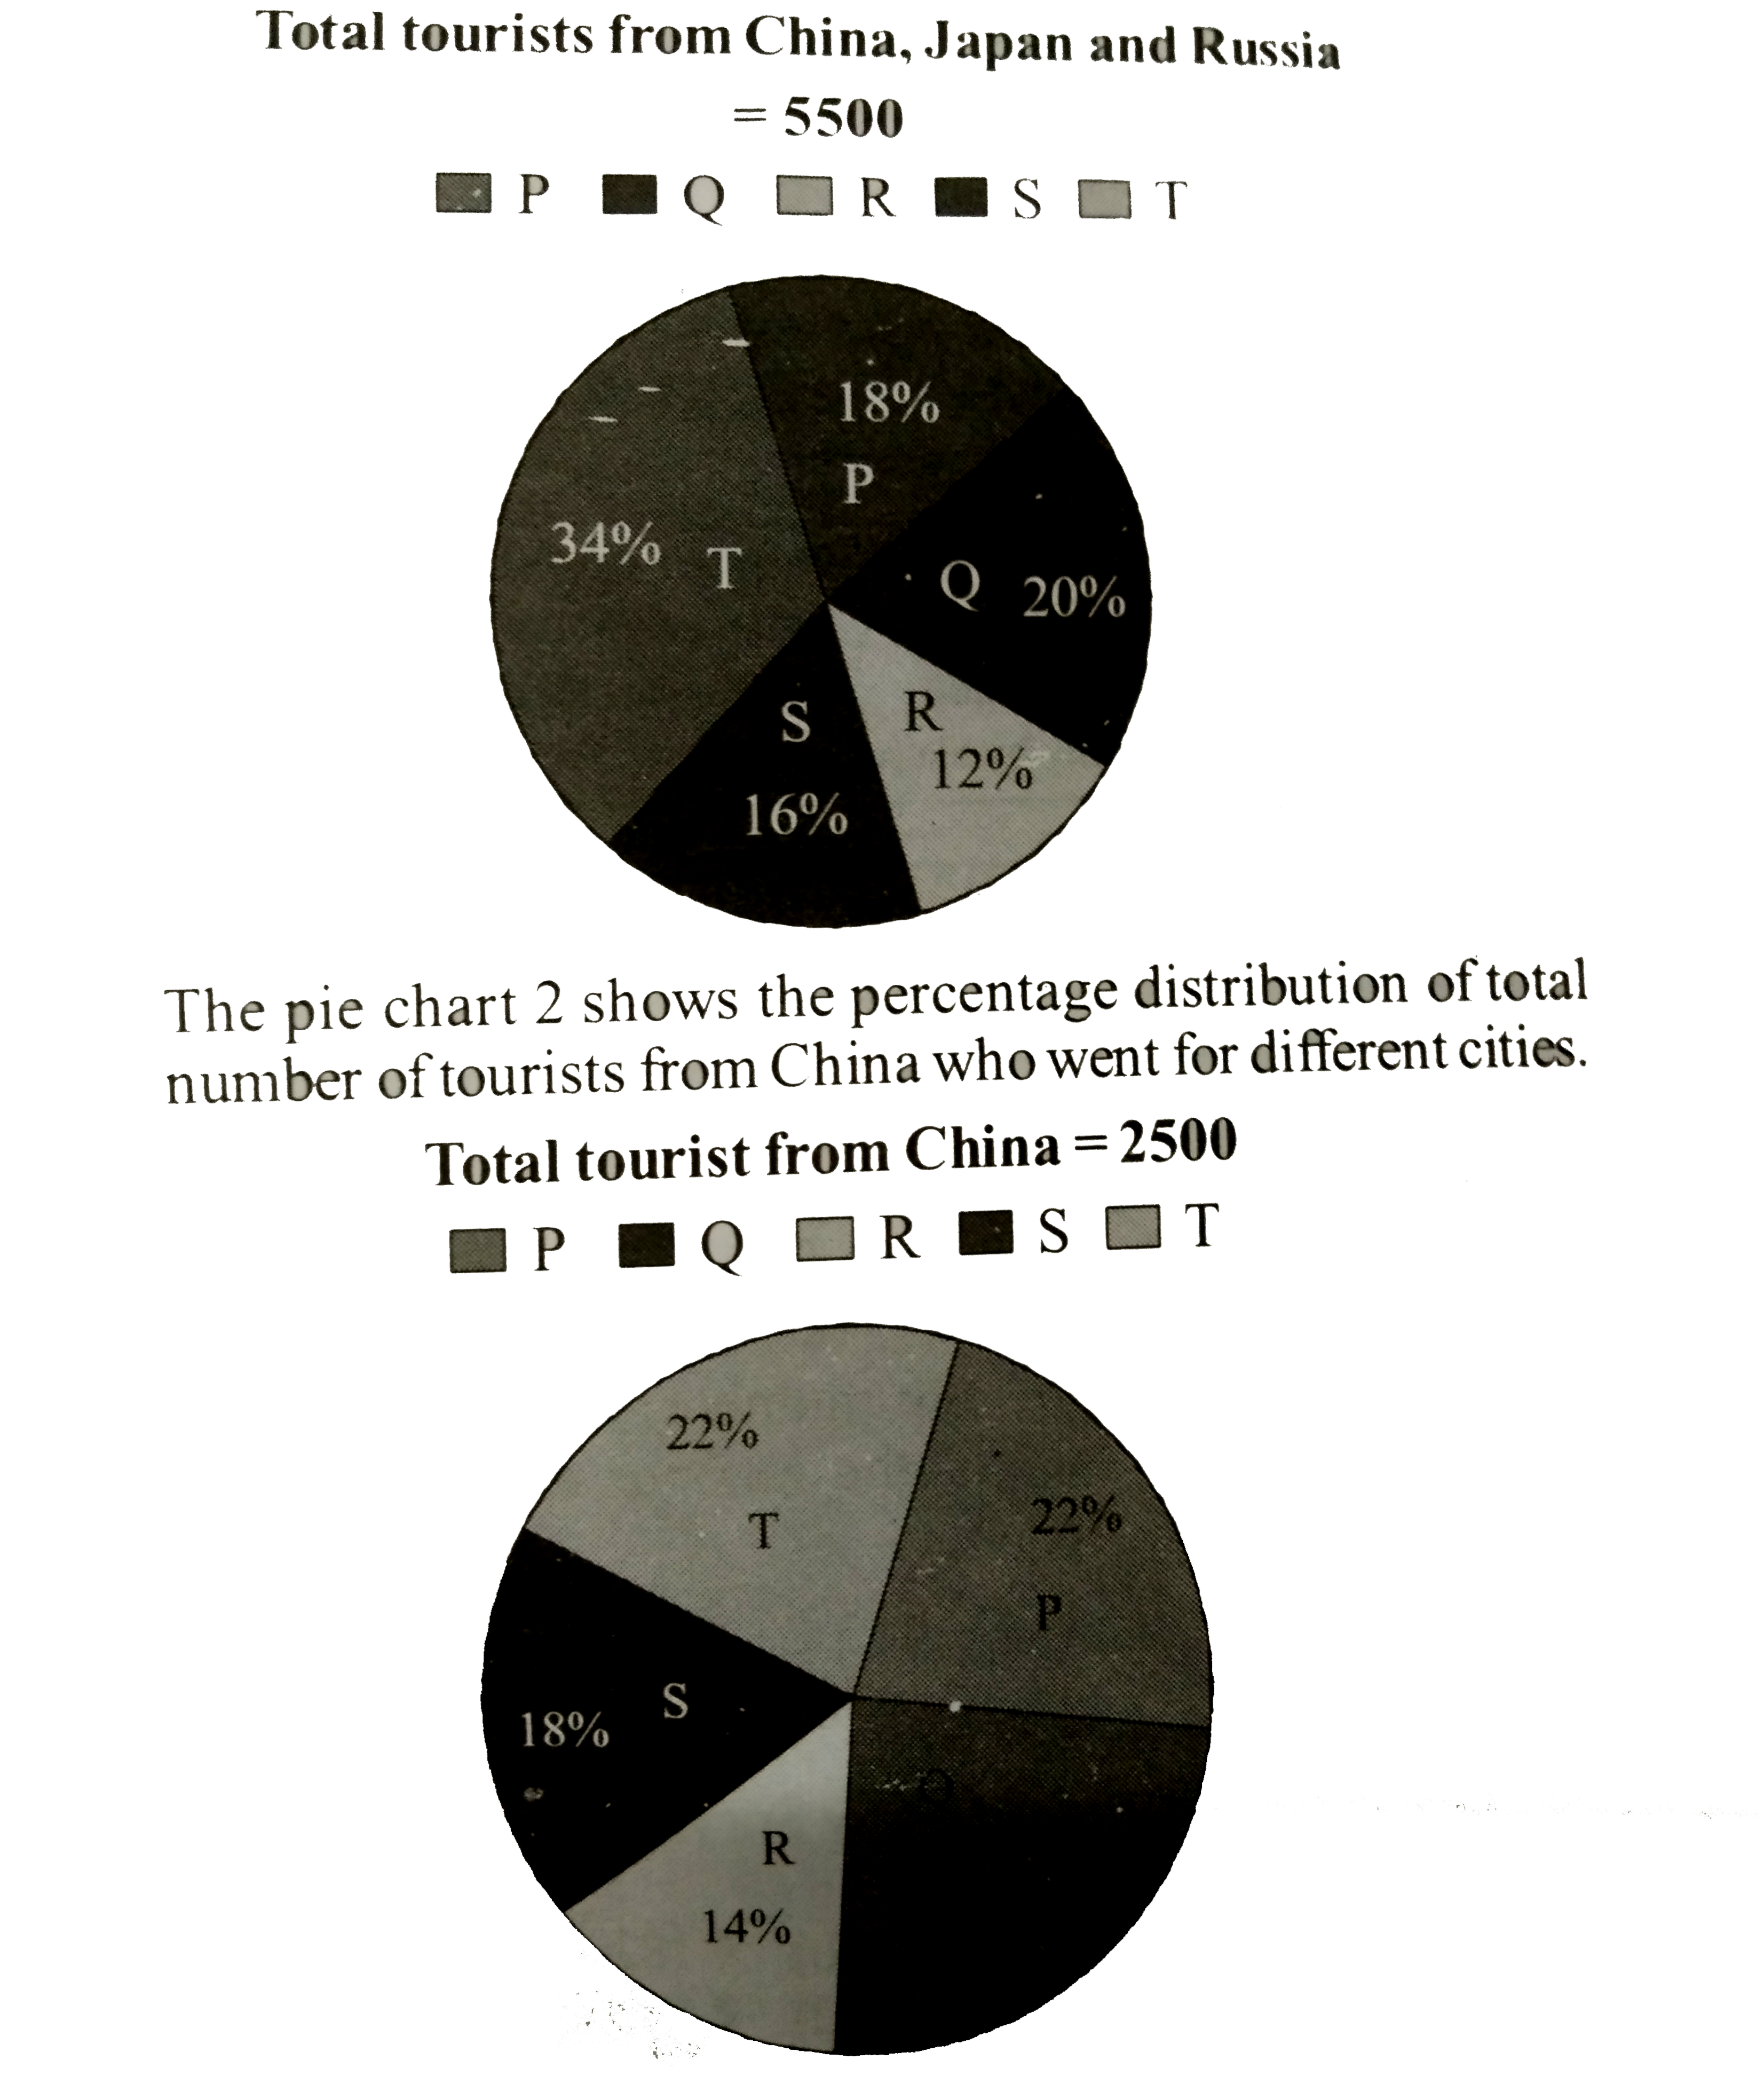
If the total number of male to that of female tourists from Japan and Russia in city is 3:2 then find, the number of male tourists from Japan and Russia in city R ?
View SolutionThe following pie chart 1 shows the percentage distribution of total number of tourists from China, Japan and Russia who went for different cities.
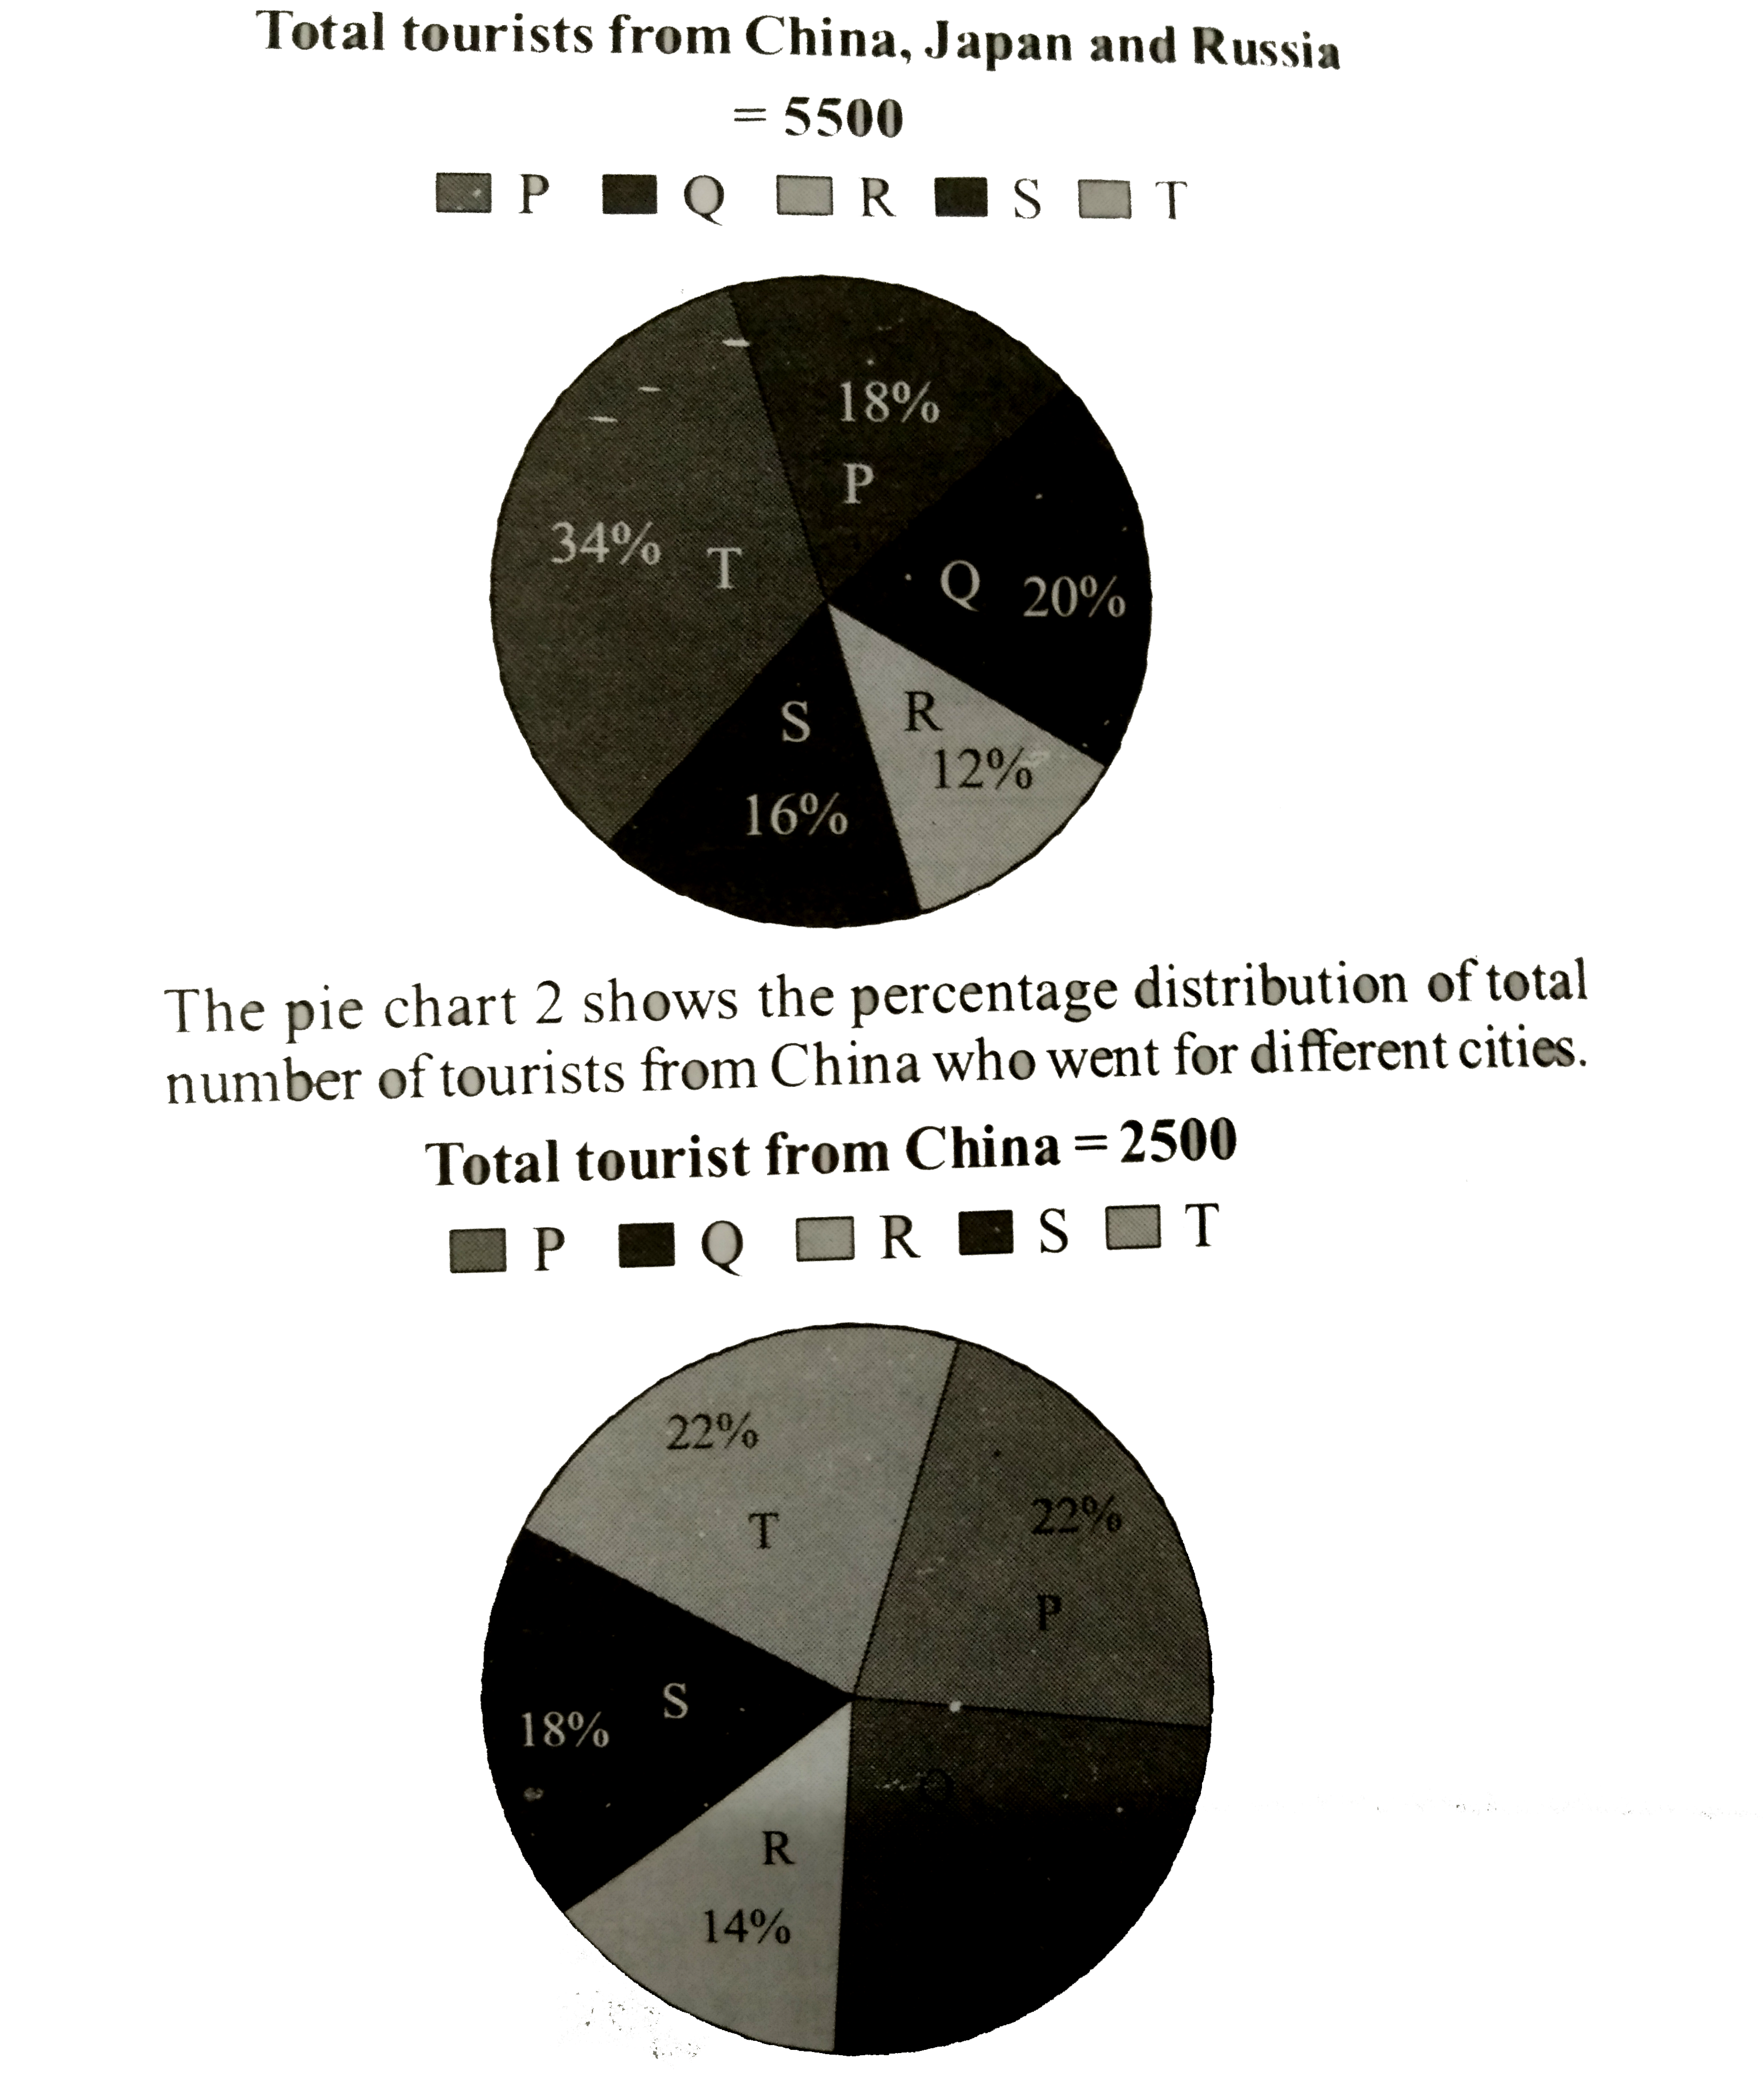
Find the difference between the total number of tourists from Japan and Russia in city. T with the total number of tourists from Japan and Russia in city S ?
View Solution
Knowledge Check
The following pie-chart shows the percentage distribution of the expenditure incurred in publishing a book. Read the pie-chart and answer the questions.

The central angle of the sector corresponding to the expenditure incurred on Royality is :A15∘B48∘C54∘D24∘The following pie-chart shows the percentage distribution of the expenditure incurred in publishing a book. Study the pie-chart and answer the questions based on it.
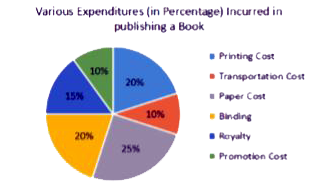
What is the central angle of the sector corresponding to the expenditure incurred on binding?A72∘B90∘C48∘D70∘
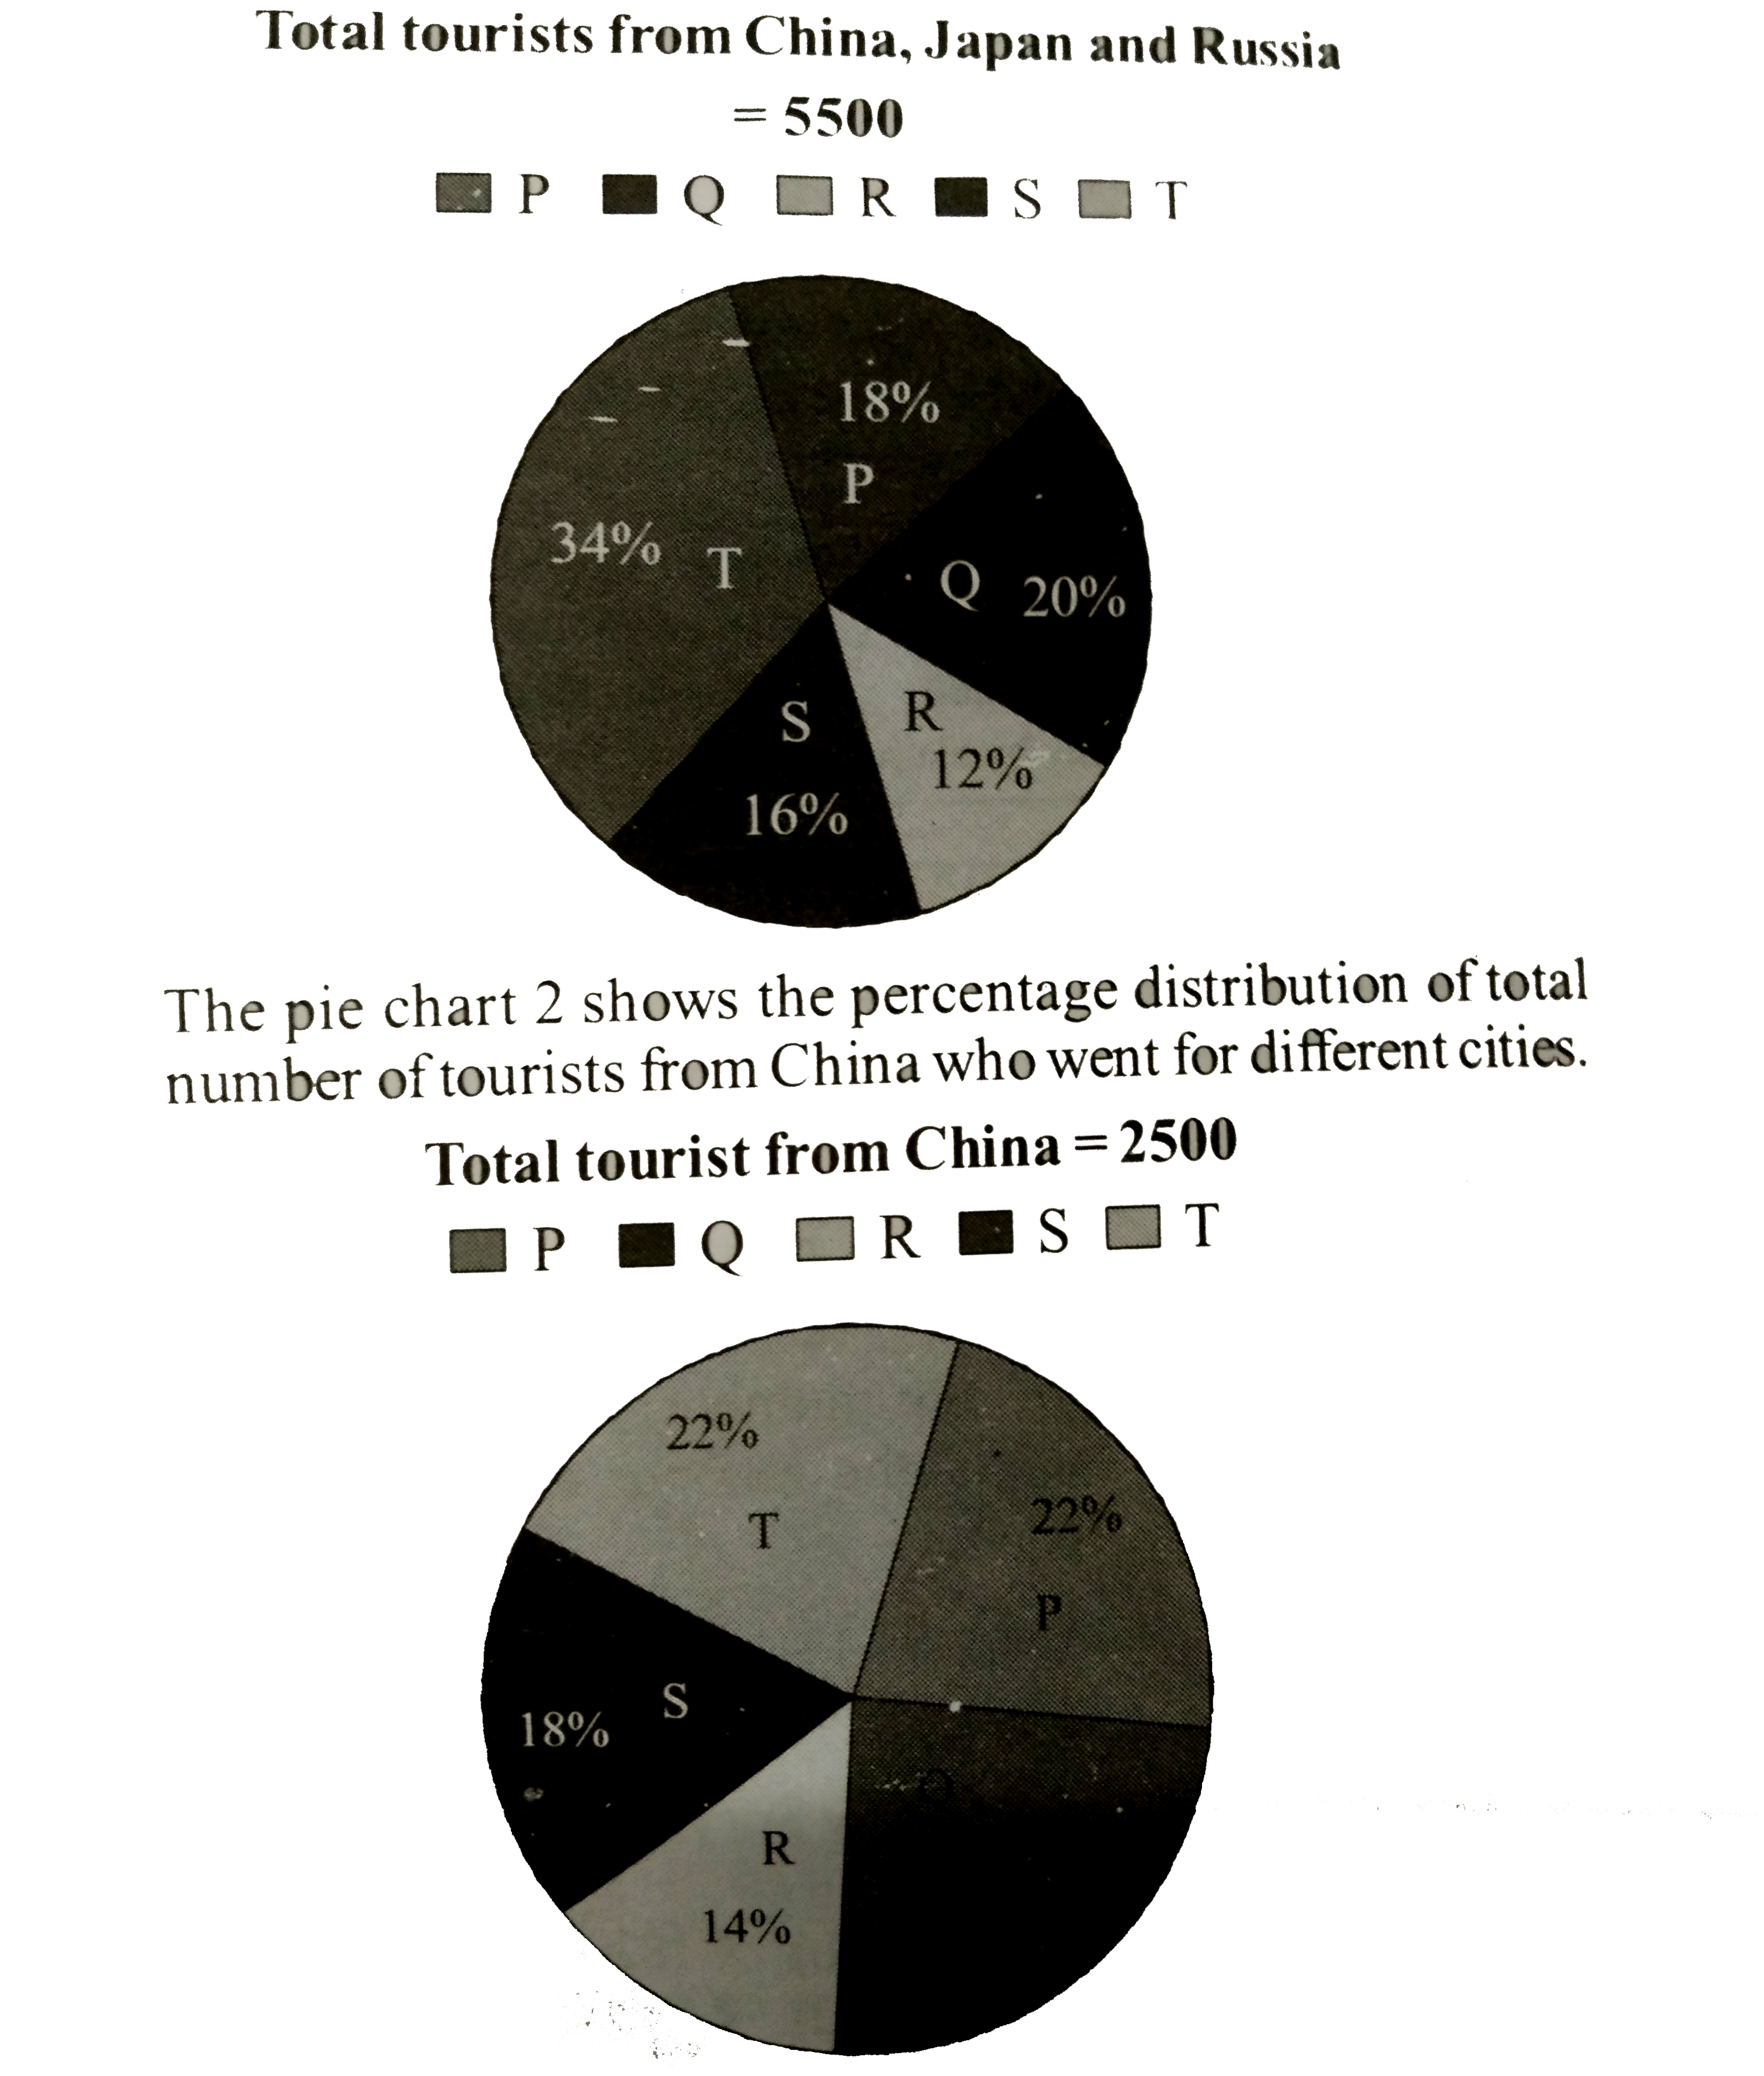
The following pie chart 1 shows the percentage distribution of total number of tourists from China, Japan and Russia who went for different cities.
Find the ratio of total number of China tourists form city Q to that of total number of tourists from city S ?
View SolutionThe following pie chart 1 shows the percentage distribution of total number of tourists from China, Japan and Russia who went for different cities.
In tourists from city P, in which Japan tourists are 120 more than that of tourists from Russia. Then find the number of tourists from Japan in city P ?
View SolutionDirection: Study the following information carefully and answer the given questions: The following pie chart shows the percentage distribution of total number of Apples (Wet +dry)
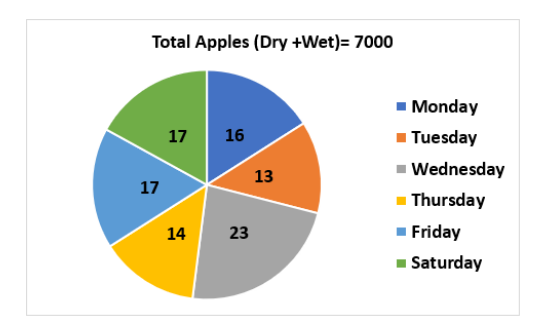
The pie chart2 shows the percentage distribution of total number of Apples (Wet) sold in different days of a week.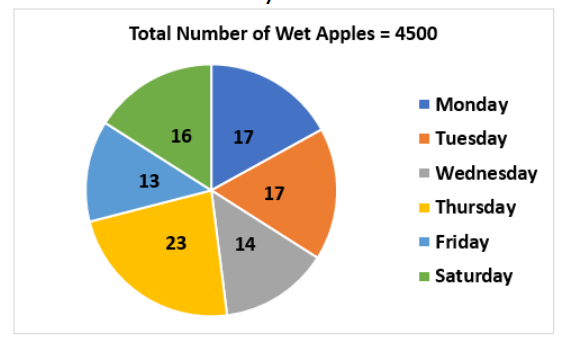
If the Apples (dry) sold on Sunday is 60 % more than the Apples (dry) sold on Saturday. Find the total Apples (dry) sold on Sunday and Saturday together?
View SolutionThe following pie-chart shows the percentage-wise distribution of the number of students in five different schools P, Q, R, S and T. The total number of students in all five schools together is 8400.
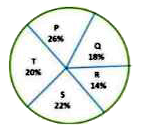
Find the average number of students in schools R and S together.
View SolutionDirection: Study the following information carefully and answer the given questions: The following pie chart shows the percentage distribution of total number of Apples (Dry +dry)

The pie chart2 shows the percentage distribution of total number of Apples (Wet) sold in different days of a week.
Find the difference the Apples (Wet) sold on Tuesday to the apples (Wet + Dry) sold on Thursday?
View SolutionDirection: Study the following information carefully and answer the given questions: The following pie chart shows the percentage distribution of total number of Apples (Dry +dry)

The pie chart2 shows the percentage distribution of total number of Apples (Wet) sold in different days of a week.
What percentage of dry apples sold on Monday and Tuesday together?
View Solution
